Quick Simple ReturnsQSR baby! That's what that stands for to me. Anyway, it took a ton of searching, high and low to find this stock. The markets just haven't really turned from their bearish sentiment even after a strong day yesterday. I need to add some long delta to my portfolio and think this stock is just the one. Check out my market overview for why it has been so hard to find a bullish stock.
Community ideas

How to use ETFs instead of Indexes to know how to trade that dayMost Traders use the indexes to try to understand whether they should buy long or sell short. However, the ETFs impact the index components prices not the other way around. Most traders do not realize that they should be studying the ETF of an index rather than the index to determine how to trade the next day. Also ETF trading can be highly lucrative. Using the chart layouts that I have designed to trade Dark Pool activity, HFT and Hedge Fund activity and Sell Side activity helps you understand who is on control of price for the ETF and thus is created the value changes of the indexes.
When you study the ETF rather than the index, you will find you have far more information in the chart, indicators and price changes.

Gold Devours Stocks and Outshines Crypto with 40% Gains. Why So?Gold OANDA:XAUUSD has returned 40% in the past twelve months — that’s more than four times the S&P 500’s SP:SPX 9% increase.
Besides leaving stock bros with a sour taste in their mouths, gold is also serving a cold dish of revenge to the crypto heads who had for years been slamming it for lack of appeal. It crushed the $3,000 mark last week, pumping to the rarefied air of $3,005 per ounce.
The market’s digital gold — Bitcoin BITSTAMP:BTCUSD — is up 26% in the past year. Gold is certainly having a moment here with just about every star aligning for its upside swing. War tremors, inflation jitters, consumer uncertainty and lower interest rates have come together to make gold great again.
Catch the drift? Yes, we mean US tariffs. Trump’s tariff drama is perhaps the biggest driver right now for the shiny stuff. Anxiety over gold getting slapped with a tariff has sent traders, dealers and investors scrambling to get more of it.
The US President has floated some comments on gold but not to the point where he even remotely hints at imposing a tariff. Around the end of February, Trump said he suspects someone might’ve actually been stealing gold from Fort Knox. His remarks came after Elon Musk, designated as a “special government employee,” raised some alarming questions.
“Who is confirming that gold wasn’t stolen from Fort Knox? Maybe it’s there, maybe it’s not,” Musk wrote on X . “That gold is owned by the American public! We want to know if it’s still there.”
Trump chimed in and said in an interview they’re planning to visit Fort Knox soon. “We’re going to go into Fort Knox, the fabled Fort Knox, to make sure the gold is there. He added that “if the gold isn’t there, we’re going to be very upset.”
Fort Knox is the equivalent of Scrooge McDuck’s impenetrable fortress full of gold collectibles. Only that Fort Knox staff doesn't backstroke through the piles of coins (or do they?). The vault holds a total of 147.3 million ounces worth roughly $430 billion today. To those who’re asking why not sell it and pay off some debt — America has a staggering $36 trillion debt burden . Selling gold to pay it off wouldn’t even return a blip on the chart.
According to Treasury Secretary Scott Bessent (who’s also a hedge fund manager) the gold at Fort Knox is audited “every year” and “all the gold is present and accounted for.”
All American gold is stored in a number of vaults, which collectively add up to a total of 261.5 million ounces (8,100 tons), according to Federal Reserve balances. That’s around a $770 billion piece of a market that’s worth nearly $20 trillion.
So is the gold rush exaggerated and maybe a little overrated?
In practice, gold is a pet rock with an added flair. It doesn’t generate yield, produce earnings or pay any form of interest to those who hold it. But gold has a solid history of being the ultimate store of value.
Gold’s supply is more or less fixed as miners are only able to dig out about 1% to 2% a year at best. All the gold ever unearthed in the world is a little over 216,000 tons , according to the World Gold Council. One way to picture that is 64,200 Tesla Cybertrucks. Or, if we were to melt it all, it would be enough to form a cube that’s 25 yards (23 meters) on each side.
You be the judge now — do you think gold is overpriced? Or are you a gold bug who believes that $3,000 could be the start of a new mega cycle for the precious metal? Share your comments below!

Bitcoin can rebound from triangle pattern to 90K pointsHello traders, I want share with you my opinion about Bitcoin. Not long ago, the price was trading within a range, where it quickly entered the seller zone and remained near this area for quite some time. BTC attempted to rise but failed, and after nearly reaching the upper boundary of the range, it dropped sharply. The price broke through the 94000 level, exiting the range as well, and then fell to the support level, which aligned with the buyer zone. Shortly after, the price made a strong upward impulse toward the resistance level before starting a decline within a downward triangle. Inside this pattern, BTC initially made a correction, climbed back to the resistance line of the triangle, and then resumed its decline. Eventually, the price dropped to the 78900 support level, where it touched the triangle’s support line and then began to rise. At the moment, BTC continues to climb near this level, and I expect it to rebound from the support line of the triangle and break above the resistance, signaling an exit from the pattern. If this happens, I anticipate further growth, so my target is set at 90000 points. Please share this idea with your friends and click Boost 🚀

Volkswagen AG (VOW) – The Cheapest Military Stock in Europe? TP1: €150 – Short-term breakout
TP2: €180 – Mid-term resistance
TP3: €250 – Long-term revaluation target
Why Are We Bullish?
🔹 Defense Sector Entry?
-VW exploring military production, with CEO Oliver Blume confirming interest.
-Idle plants may be repurposed, potential Rheinmetall partnership in the works.
-Rearmament boom – Rheinmetall’s valuation already surpassed VW’s.
🔹 Financial & Growth Catalysts
-Q4 sales up 21%, 7.0% margin, 2025 revenue target +5%.
-€1B cost-cutting, strong EV & U.S. market expansion.
🔹 Bullish Technicals
-MACD Bullish Crossover + Green Histogram Bars confirm momentum.
-Bounced off long-term trendline support, signaling a strong reversal.

EURUSD - How Long Will The Bullish Gravy Train Last?German Chancellor-in-waiting Friedrich Merz announced he had secured the crucial backing of the Greens for a massive increase in state borrowing.
The deal will likely be approved by the outgoing parliament next week. It includes a 500 billion euro ($544.30 billion) fund for infrastructure and sweeping changes to borrowing rules.
Due to this, the dollar weakened against the euro but rose against the Swiss franc and the yen, underpinned by the likelihood the U.S. government will avert a shutdown over the weekend.
Will this weeks high impact events lead to the weakening of EURUSD?

Bull Trap Confirmed: HOOD's 8% Rally Faces ExhaustionHey Traders after the success of our last month trade on Tesla hitting all targets more than 35%+
With a Similar Trade setup I bring you today the NASDAQ:HOOD
Short opportunity on Hood
Based on Technical + Fundamental View
-Market structure
-Head and shoulder pattern
-Currently will be trading at supply zone which was a recent support and now an ideal place for a reversal to create the right shoulder of the bigger head and shoulder pattern - Daily time frame.
1. Declining User Growth and Transaction-Based Revenue
2. Regulatory and Legal Challenges
3. Rising Costs and Profitability Pressures
4. Intense Industry Competition
5. Macroeconomic and Market Volatility
Technical View
Head and shoulder pattern - Pretty visible. Right shoulder is yet to be formed, Which makes an ideal place to SELL with a great Risk Reward ratio.
Pro Tip
Wait for a bearish candle stick pattern to execute trades on end of the day keeping stop loss somewhere above the supply zone.
Target 1 - 35.52$
Target 2 - 30.81$
Target 3 - 26.26$
Stop Loss - 44.72$
Fundamental View
1. Declining User Growth and Transaction-Based Revenue
Robinhood’s revenue model relies heavily on Payment for Order Flow (PFOF), which makes it vulnerable to fluctuations in trading activity. After a pandemic-driven surge in 2020–2021, user growth stalled, with monthly active users dropping 34% YoY to 14 million by mid-2022. Transaction revenue fell 55% in Q2 2022, and while assets under custody grew to $140 billion by Q2 2024, the platform’s dependence on volatile crypto and meme-stock trading amplified revenue instability.
2. Regulatory and Legal Challenges
The SEC’s scrutiny of PFOF and proposed trading rule changes threaten Robinhood’s core revenue source. In 2022, New York regulators fined Robinhood’s crypto unit $30 million for anti-money laundering violations. Ongoing legal risks, including backlash from the 2021 GameStop trading restrictions, have further eroded institutional trust.
3. Rising Costs and Profitability Pressures
Operating expenses surged due to aggressive marketing, technology upgrades, and compliance investments. Despite workforce reductions (23% layoffs in 2022), profitability remains strained. The company’s shift toward diversified products like retirement accounts and credit cards has yet to offset these costs.
4. Intense Industry Competition
Traditional brokers like Fidelity and Charles Schwab adopted zero-commission trading, neutralizing Robinhood’s initial edge. Newer platforms like Webull and Public.com also captured younger investors with advanced features, while Robinhood’s limited product range (e.g., lack of wealth management services) hindered retention of high-net-worth clients.
5. Macroeconomic and Market Volatility
- Interest Rate Sensitivity: As a growth stock, HOOD declined amid rising rates in 2022–2023 and broader tech-sector sell-offs.
- Recent Market Turmoil: On March 10, 2025, HOOD dropped 18% alongside crypto-linked stocks like Coinbase due to Bitcoin’s price volatility and fears of inflationary tariffs under new U.S. policies.
- Retail Investor Pullback: Reduced discretionary investing and crypto crashes (e.g., Bitcoin’s 71% plunge in 2022) dampened trading activity.
NOT AN INVESTMENT ADVISE

AAPL and MSFT Reading Charts For Better Entries and ExitsOptions Trading Strategy Using Ichimoku Cloud, 200 SMA & Monthly Contracts
(Following Your 3 Trading Rules)
This strategy adapts the Ichimoku Cloud & 200 SMA trend-following method for trading monthly options contracts with a focus on high-probability setups. It leverages time decay (theta), trend strength, and proper timing to maximize gains while reducing risk.
🔹 Strategy Overview
We will trade monthly options contracts using:
Trend confirmation via Ichimoku Cloud & 200 SMA
Directional bias based on price positioning
Entry timing rules to avoid low-probability setups
Theta-friendly positioning (avoiding weeklies to reduce time decay risks)
📈 Trading Rules & Setup
(My 3 Golden Rules)
🚫 No trading on Mondays → Avoids choppy market structure from weekend gaps.
🚫 No trading on Fridays → Avoids gamma risk and weekend time decay.
⏳ No trades before the first 15-minute candle closes → Ensures market direction is established.
📊 Selecting the Right Option Contract
For monthly expiration contracts, select options that:
Expire within 30 to 60 days (avoid weekly contracts to minimize rapid time decay).
Are slightly in-the-money (ITM) or at-the-money (ATM) for higher delta (0.55–0.70).
Have open interest >1,000 and a tight bid-ask spread to ensure liquidity.
Example: If today is June 11, trade the July monthly contract (third Friday of the month).
📉 Bearish Put Play (Short Trade)
200 SMA Bias: Price is below the 200 SMA
Ichimoku Cloud Confirmation:
Price is below the cloud
Tenkan-sen is below Kijun-sen (bearish momentum)
Chikou Span is below price from 26 candles ago
Future cloud is red
Entry Trigger (After First 15 Min Candle):
Price pulls back into the Kijun-sen but rejects it
OR price breaks below the cloud after a weak consolidation
Enter PUT contract (monthly expiration)
Stop Loss & Take Profit:
SL: Above Kijun-sen or recent swing high
TP: First at the cloud’s lower edge, second at a key support level
Exit before Theta decay accelerates (last 14 days before expiry)
📈 Bullish Call Play (Long Trade)
200 SMA Bias: Price is above the 200 SMA
Ichimoku Cloud Confirmation:
Price is above the cloud
Tenkan-sen is above Kijun-sen (bullish momentum)
Chikou Span is above price from 26 candles ago
Future cloud is green
Entry Trigger (After First 15 Min Candle):
Price pulls back into the Kijun-sen but holds
OR price breaks out above the cloud
Enter CALL contract (monthly expiration)
Stop Loss & Take Profit:
SL: Below Kijun-sen or recent swing low
TP: First at the cloud’s upper edge, second at a key resistance level
📊 Trade Management & Adjustments
Rolling: If trade is profitable near expiry but not at the full target, roll to the next monthly contract.
Closing Early: If the trade is at 70-80% max profit, close early to avoid decay risk.
Cutting Losses: If price closes inside the Ichimoku Cloud, consider exiting early (trend loss warning).
🛠 Why This Works for Monthly Options?
✅ Avoids time decay risks of weekly options by trading monthly contracts.
✅ Uses strong trend confirmation from Ichimoku & 200 SMA.
✅ Only trades at high-probability times, avoiding choppy Monday & Friday moves.
✅ Allows scaling into strong trends rather than short-term noise.

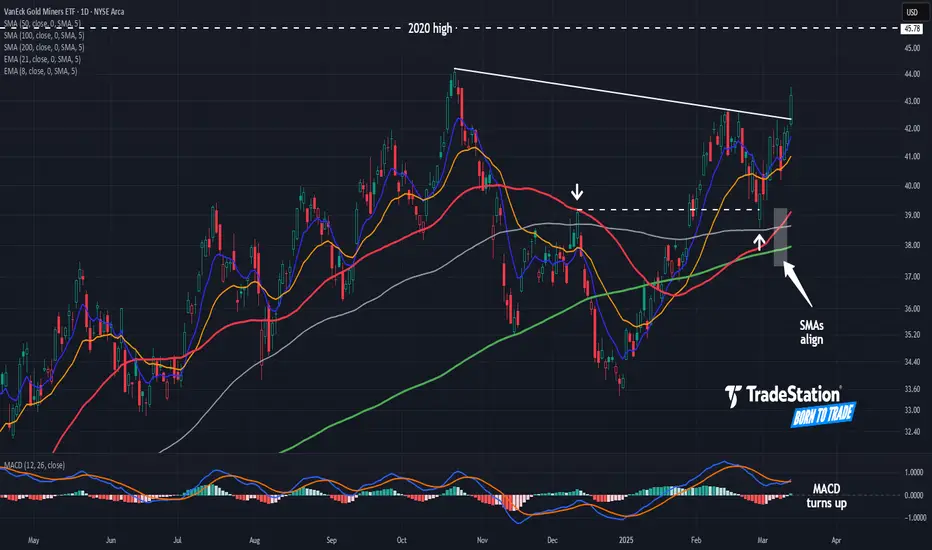
Are Gold Miners Going Higher?Gold miners are one of the top-performing industries this year, and some traders may see further upside in a key ETF tracking the group.
The first pattern on today’s chart of the VanEck Gold Miners ETF is the falling trendline along the highs of October and February. GDX cleared that resistance on Thursday, which may suggest a breakout is underway.
Second, the 50-day simple moving average (SMA) rose above the 200-day SMA in February and above the 100-day SMA in March. That alignment, with faster SMAs above slower SMAs, may be consistent with a longer-term uptrend.
Third, the ETF peaked around $39 in December and bounced at the same level on February 28. Did old resistance become new support?
Next, MACD just turned positive. The 8-day exponential moving average (EMA) is also above the 21-day EMA. Those are potentially bullish short-term signals.
Fifth, GDX remains below its 2020 high of $45.78 –- despite physical gold setting new records. The ETF is also still under peaks from early last decade. Investors may wonder whether the producing companies are undervalued on a relative basis.
Finally, TradeStation data shows GDX averaging roughly 128,000 options per day in the last month. That may help traders position for moves with calls and puts.
Standardized Performances for the ETF mentioned above:
VanEck Gold Miners ETF (GDX)
1-year: +52.63%
5-years: +34.98%
10-year: +83.14%
(As of February 28, 2025)
Exchange Traded Funds ("ETFs") are subject to management fees and other expenses. Before making investment decisions, investors should carefully read information found in the prospectus or summary prospectus, if available, including investment objectives, risks, charges, and expenses. Click here to find the prospectus.
TradeStation has, for decades, advanced the trading industry, providing access to stocks, options and futures. If you're born to trade, we could be for you. See our Overview for more.
Past performance, whether actual or indicated by historical tests of strategies, is no guarantee of future performance or success. There is a possibility that you may sustain a loss equal to or greater than your entire investment regardless of which asset class you trade (equities, options or futures); therefore, you should not invest or risk money that you cannot afford to lose. Online trading is not suitable for all investors. View the document titled Characteristics and Risks of Standardized Options at www.TradeStation.com . Before trading any asset class, customers must read the relevant risk disclosure statements on www.TradeStation.com . System access and trade placement and execution may be delayed or fail due to market volatility and volume, quote delays, system and software errors, Internet traffic, outages and other factors.
Securities and futures trading is offered to self-directed customers by TradeStation Securities, Inc., a broker-dealer registered with the Securities and Exchange Commission and a futures commission merchant licensed with the Commodity Futures Trading Commission). TradeStation Securities is a member of the Financial Industry Regulatory Authority, the National Futures Association, and a number of exchanges.
Options trading is not suitable for all investors. Your TradeStation Securities’ account application to trade options will be considered and approved or disapproved based on all relevant factors, including your trading experience. See www.TradeStation.com . Visit www.TradeStation.com for full details on the costs and fees associated with options.
Margin trading involves risks, and it is important that you fully understand those risks before trading on margin. The Margin Disclosure Statement outlines many of those risks, including that you can lose more funds than you deposit in your margin account; your brokerage firm can force the sale of securities in your account; your brokerage firm can sell your securities without contacting you; and you are not entitled to an extension of time on a margin call. Review the Margin Disclosure Statement at www.TradeStation.com .
TradeStation Securities, Inc. and TradeStation Technologies, Inc. are each wholly owned subsidiaries of TradeStation Group, Inc., both operating, and providing products and services, under the TradeStation brand and trademark. When applying for, or purchasing, accounts, subscriptions, products and services, it is important that you know which company you will be dealing with. Visit www.TradeStation.com for further important information explaining what this means.
Booze Wars... How DAX could react?Now it's time for US and EU to have their public tariff battle. Given that wine, champagne and beer are a huge part of EU export into the US, there might be some pain felt among the MARKETSCOM:DE30 bulls. Let's dig in.
XETR:DAX
Let us know what you think in the comments below.
Thank you.
74.2% of retail investor accounts lose money when trading CFDs with this provider. You should consider whether you understand how CFDs work and whether you can afford to take the high risk of losing your money. Past performance is not necessarily indicative of future results. The value of investments may fall as well as rise and the investor may not get back the amount initially invested. This content is not intended for nor applicable to residents of the UK. Cryptocurrency CFDs and spread bets are restricted in the UK for all retail clients.

Dogecoin (DOGE): Possible 40% Decline Before 400% PumpDogecoin has a chance to drop another 40% from current zones but only to form a proper support zone and then do 400% movement. Would it be a good time to do DCA?
More in-depth info is in the video—enjoy!
Swallow Team

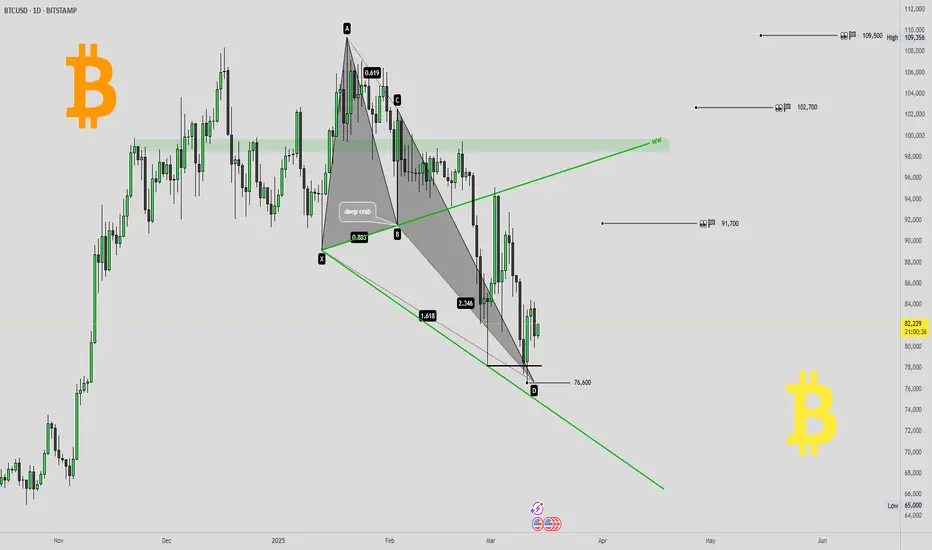
Bitcoin reversal confirmed ?!Bitcoin reversal confirmed ?! 👀
I would like to present you some charts with important levels and relevant patterns.
🖥daily-chart (BITSTAMP) and 💡everything important in the chart 👀
💥Here in the daily chart (BITSTAMP)
- a Deep-Crab harmonic with
- a WolveWave
and the daily-chart of the
🔥Daily MA200 re-test 👀
- gap fill
- support-line 2022 and 2024 TOPs
👉 BITCOIN roadmap/outlook (from 27th february 2024) 💡
🎯 If you like this idea, please leave me a 🚀 and follow for updates 🔥⏰
Furthermore, any criticism is welcome as well as any suggestions etc. - You're also very welcome to share this idea.
Have a nice evening & successful trading decisions 💪
M_a_d_d_e_n ✌
NOTE: The above information represents my idea and is not an investment/trading recommendation! Without any guarantee & exclusion of liability!
BITCOIN Correction in Play - Can Bulls Regain Control?COINBASE:BTCUSD is experiencing a corrective move after forming a double top near the upper boundary of the channel. The rejection from this level has led to increased selling pressure, with price steadily approaching a significant support zone around $73,000. The confluence of the trendline support and the horizontal demand zone increases the probability of a bullish reaction.
If buyers step in at this level, we could see a rebound, with a potential move toward the $90,000 resistance zone. This level could act as a short-term target within the current market structure.
However, failure to hold this support could signal further downside, potentially extending the retracement toward lower levels. Traders should monitor bullish confirmation signals, such as rejection wicks, increasing volume, or bullish engulfing patterns, before anticipating a continuation to the upside.
If you agree with this analysis or have additional insights, feel free to share your thoughts here! 🚀

Idea #100 - In this market, it BETTER be a good one: LONG WMTIt's been a while since I posted an idea and to those who follow me I am sorry/not sorry. I didn't post for a few reasons:
1) I know that there are people who trade my ideas despite my warnings/disclaimers and I didn't like how the market was acting for the last couple of weeks (rightly, as it turns out) and I didn't want anyone else to get caught up in this unnecessarily. I have been continuing to personally trade my system, with mixed results (to be expected in this market), but I wanted to make #100 a good one.
2) I wanted to do a summary of the ideas I've posted so far with #100 and wanted to get that information together first.
3) I think posting this now can provide some insights as to how to deal with market washouts calmly and with confidence, with things that could apply to most trading systems, I think.
So first, lets deal with the idea at hand. I chose WMT because:
a) it is historically a top 10% stock in terms of daily % return for how I trade, so if anyone decided to follow me on this trade (see disclaimer below), it was at least a stock that has historically done well. And by well, I mean 1355-0 W/L record well, with an AVERAGE gain of 5.16% per trade for all 1355 trades (backtested and actual trades combined) going back through every market meltdown since 1972.
b) This is the kind of market that makes it FAR more likely that trades will take a long time to play out. MUCH longer than average. So again, if I have to hold this a long time, I want a quality stock that has a long track record of surviving long downtrends in the market. I can't think of a better retail stock to own during a recession, which I think is a certainty at this point, it's just a question of when it becomes official and how long it lasts. WMT is already the retailer of choice for many, and if saving money becomes a requirement for many more, WMT will steal a lot of business from more expensive retailers.
c) despite the recent carnage for it and the market, WMT is still above it's 200d MA and solidly in an uptrend. I always like trading stocks in uptrends. Hopefully it stays in one long enough for me to make my money and run.
Lot 1 opened today at the close at 87.82
Per my usual strategy, I'll add to my position at the close on any day it still rates as a “buy” and I will use FPC (first profitable close) to exit any lot on the day it closes at any profit.
As always - this is intended as "edutainment" and my perspective on what I am or would be doing, not a recommendation for you to buy or sell. Act accordingly and invest at your own risk. DYOR and only make investments that make good financial sense for you in your current situation.
_______________________________
So there's my case for WMT. Now here's the case for why I'm trading anything using my system right now. The first idea I posted here was on June 22nd of this past summer. Since the close that day, the Nasdaq's return is actually negative (-1.48%) and the S&P 500 is up marginally (+2.7%).
Since June 22nd, I have logged (timestamped) here every buy and sell of every lot of every idea since then. That amounts to a total of 330 lots traded. In the time since, 289 of those trades closed with a gain, 37 are still open and negative, and two were opened today (this one and an add to RDDT) which are neither winning nor losing yet. That's an 87.6% win rate so far.
INCLUDING the 37 trades that are losers right now (the losers include 8 lots that are down 30% or more and two options trades that each lost 100%), the AVERAGE return on those 330 trades is +1.88% EACH. That translates to .11% per day held - almost 3x the long term average daily return for stocks and almost 8x the average daily return of the S&P 500 since June 22. Annualized, that's 27% rate of return and I was on pace for a 36% annualized rate of return on these trades before this market swoon hit. Compared to -1.48% and 2.4% for the indices, it's been a pretty good 9 months of trading, but actually below my system's long term average.
The profit factor on these trades (including the open losers) is currently 1.98 (it was over 2.5 2 weeks ago before the market collapse began). The average holding period is 17 days, but that is skewed longer by 10 lots of PXS that I've been holding for over 4 months each. The median hold length for all 330 trades is 5 trading days and the most common holding period (including the 37 still open losers) is ONE trading day.
OK, this turned out to be a longer post than I intended, so I'll post another idea tomorrow with some thoughts about dealing with trading in down markets.
To everyone who is reading this and especially those who are following me - thanks for the follows and for taking the time to read this whole thing. Be safe trading out there!

The only tech stock I’d consider buying right nowThis analysis is provided by Eden Bradfeld at BlackBull Research.
We’ve seen the S&P, NASDAQ and every other American index get slammed in the last couple of days. Some people are panicking. A lot of people are panicking. If you go on Twitter (sorry — X dot com) you will find a lot of people who listened to a recommendation from a guy on YouTube about a trash stock like say, IonQ or HIMS, and are now fairly upset said YouTube guy (or Twitch guy, or whatever) got it wrong.
Frankly, a correction is a healthy thing because it allows investors to purchase good companies at more reasonable multiples.
I have no idea where the market goes from here. I can’t see the future. I admit this sell-off has me adding tech stocks (and other American stocks) to my watch-list, and I’ll continue to monitor them.
A lot of tech stocks — the bulk of what has fallen as of late — still aren’t in that zone for me yet. Amazon still trades at a current multiple of 35x earnings and a fwd multiple of 28x — I can’t find much value in that, especially when I consider that Google, a company with +$83 billion in net profit and a 32% operating margin, can be acquired for 16x fwd earnings (I had to check those numbers too just to be sure — when you’ve still got things like Palantir trading “to the moon” (and back), 16x⁴ seems like a reasonable price for the dominant advertising platform in the world).
Here’s Buffett, in his 2008 essay — Buy American, I am:
A simple rule dictates my buying: Be fearful when others are greedy, and be greedy when others are fearful. And most certainly, fear is now widespread, gripping even seasoned investors. To be sure, investors are right to be wary of highly leveraged entities or businesses in weak competitive positions. But fears regarding the long-term prosperity of the nation’s many sound companies make no sense. These businesses will indeed suffer earnings hiccups, as they always have. But most major companies will be setting new profit records 5, 10 and 20 years from now.
Buffett was right, of course. If you purchased stocks in 2008 and held them you would’ve done pretty well (as long as you didn’t buy Lehman Brothers!). The GFC saw stocks fall 48% from their peak — if we are indeed heading towards that territory there is more room to fall. I have no idea — examining the basket of tech stocks I look at, the only one that presents any value is Google. It’s reasonable at 16x fwd earnings. If it traded at 12x earnings, it would be a bargain - in my opinion. How low can you go?

TSLA Breakout Retest: What Could Signal Bullish Surge NASDAQ:TSLA Breakout Retest: What Could Signal Bullish Surge – Is Tesla poised for a major move? In this video, I break down the breakout retest pattern on TSLA’s weekly chart, focusing on the critical near term levels. A validated breakout could hint at a higher time frame bullish scenario! I’ll cover:
Rules to validate or invalidate the pattern
Conservative and aggressive price targets
My personal targets based on years of trading experience
Don’t miss this Tesla stock analysis for 2025!
What to Watch For:
Breakout confirmation at $490
Stop-loss zones and risk management
Potential bullish surge targets

Gold is on a relentless hunt for the $2,720 levelGold is on a relentless hunt for the $2,720 level, navigating through a well-defined ascending channel where the upper boundary has acted as long-term resistance and the lower boundary as dynamic support. The price has respected this structure, with multiple touches reinforcing its integrity. However, a recent double top near the upper boundary signals potential bullish exhaustion, increasing the probability of a downside move. If the price remains below this key level, further declines are likely, with $2,720 emerging as a crucial support zone—aligned with the golden pocket on the Fibonacci retracement, making it a prime area for a reaction.
The Alternative Scenario: The New Economy's Bullish Case
Despite the bearish structure, gold in the new economy presents an alternative bullish outlook. A smaller bullish channel has formed between $2,789 and $2,855, suggesting that buyers are still in control within this range. If this mini uptrend holds, it could fuel another breakout attempt above recent highs, invalidating the bearish scenario and positioning gold for a renewed push toward higher levels.
For now, gold is at a crossroads, with $2,720 as the primary target on the downside—but if buyers defend this level or sustain the new bullish channel, the uptrend may persist in the evolving economic landscape.


Bitcoin - Will history repeat itself?In this analysis, we are observing the potential repetition of market history by comparing the current Bitcoin price action to the previous bullrun cycle. By utilizing Fibonacci retracement levels, historical patterns, and the current macroeconomic landscape, we can formulate a hypothesis that the market might follow a similar trajectory if bearish sentiment prevails.
Historical Comparison
During the last bullrun, Bitcoin experienced significant price appreciation before eventually reaching a new all-time high (ATH). However, one key observation from the previous cycle is that before Bitcoin reached its ATH, the price retraced to the 0.618 Fibonacci retracement level multiple times. This level acted as a critical support zone, where the price found demand before making the next leg upward.
Currently, we are seeing a similar pattern unfolding. Bitcoin has recently experienced a parabolic rise, reminiscent of the previous bull cycle. As the market is showing early signs of exhaustion, the possibility of a deeper retracement towards the 0.618 Fibonacci level (around $50,000) is becoming increasingly plausible. If history repeats itself, this level could act as a springboard for the next significant price increase.
Last bullrun we had a 77% drop, and from the current ATH its only a 55% drop to the fib level:
Bearish Sentiment and Market Dynamics
Despite positive news emerging globally, such as the USA announcing its Bitcoin reserves and other adoption-related headlines, the market has reacted negatively, which is a characteristic of bearish sentiment. This kind of price action aligns with what we saw in previous cycles, where good news failed to provide upward momentum as the market was already in a distribution phase.
The fact that Bitcoin has failed to sustain gains even amid positive news further reinforces the likelihood of a deeper retracement. The market is driven by liquidity cycles, and the large players may still be in the process of shaking out retail investors before the next parabolic move.
Key Fibonacci Levels to Watch
0.618 Level (~$51,500): Historically tested in the last cycle before the final leg up.
0.65 Level (~$48,500): Another confluence zone that could provide significant support.
0.786 Level (~$36,000 - $40,000): If the market becomes extremely bearish, this level could act as the final capitulation zone before the next macro bullrun.
Psychological and Macro Factors
Additionally, the broader macroeconomic environment plays a crucial role in this scenario. With ongoing geopolitical tensions, inflation concerns, and central banks' monetary policies, investors are more risk-averse, which could further contribute to the bearish price action.
Historically, Bitcoin has shown strong correlation to traditional markets, especially during uncertain times. If the macroeconomic environment remains unstable, Bitcoin could follow traditional markets into a corrective phase before making a recovery.
Daily Chart Imbalance Zones
On the daily chart, Bitcoin is currently trading between two key imbalance zones. These zones represent areas of liquidity where the market could either find support or break down further. The current price action suggests that if Bitcoin holds the imbalance zones as support, the market structure will still be intact, leaving the possibility for a continuation of the upward trend.
However, if these imbalance zones fail to hold, it would signal a bearish continuation pattern. In this case, the probability of Bitcoin testing the $50,000 level as the next major support becomes highly likely. Traders should closely monitor these zones, as they will play a pivotal role in determining the market’s next major move.
Conclusion
While no analysis can predict the future with certainty, the confluence of technical, historical, and macroeconomic factors suggests that Bitcoin might follow a similar pattern as the previous bullrun. A retracement to the 0.618 Fibonacci level around $50,000 is highly plausible before a new ATH is achieved. However, if bearish sentiment continues to dominate, we could see lower levels before the market finds its true bottom.
The current price action, coupled with negative market reactions to positive news, is an indication that larger players might still be accumulating before the next leg up. Traders and investors should remain cautious, monitor key Fibonacci levels, and be prepared for heightened volatility in the coming months.
Only time will tell if history will indeed repeat itself, but the current evidence suggests that the market might be following a familiar path once again.

Is Trump’s Golden Age a Recession in the Making? Let’s Find Out“This tariff low key slaps,” says no trader ever as markets get jerked and jolted day in and day out because no one can really figure out what’s happening. On some days, US President Donald Trump wakes up and chooses to slap a tariff or two on America’s closest and biggest allies. On other days, he goes for the pardon.
Turns out, investors don’t really like it. Stock markets left and right wiggled to the point they couldn’t take it anymore — the tech-heavy Nasdaq Composite NASDAQ:IXIC dived into correction territory last week. That is, the index plunged more than 10% from its most recent peak, which was a record high.
Even though Friday was a good day for stocks, the S&P 500 SP:SPX closed out its worst week since September, wiping off 3.1%. Zoom out and you get an S&P 500 that’s barely holding above the flatline since the election. In other words, more than $3 trillion has been washed out from the Wall Street darling since it hit a record high in late February.
Where Do We Stand on Tariffs Now?
So where has the dizzying labyrinth of tariffs landed? And is that final? (No, it’s not.) Trump last week declared that there’s simply “no room left” for Canada and Mexico to bargain over a deal or even a delay. That’s a 25% levy taking effect right there. A day later it was no more — a month-long reprieve for carmakers was introduced.
Then a day later, Trump suspended the 25% levy on almost all goods from its closest neighbors. To this, Trump said that the “big” wave of tariffs is coming in early April to a bunch of countries, including the European Union. Right now, only China’s 20% tariff remains in place.
The roller-coaster ride around who gets slapped with what has sent the dollar TVC:DXY in a freefall — so much so that the markets have started to chat about a “Trumpcession,” (not something you’d like to have your name on). That is, some traders and investors expect Trump’s policies to tip the American economy into a recession.
Swirling fears of a downturn came right as the Federal Reserve apparently managed to stick the soft landing — Jay Powell and his clique of central bankers lowered inflation through interest rate cuts while the economy continued to grow without nosediving into a downturn.
A side worry of the tariffs (with very real front-and-center consequences) is a pullback from the Federal Reserve on its rate-cutting campaign. Analysts are quick to say that the US central bank won’t be looking to trim borrowing costs any time soon. Not with all that White House noise threatening to derail consumer confidence and dent corporate profits and revenue.
Apparently, the huge wave of uncertainty around Trump’s tariff agenda, centered on isolation and protectionism, is making global investors nervous.
In this context, how are you navigating the sea change? What’s your portfolio showing and how do you feel about growth prospects ahead? Share you thoughts in the comment section and let’s chat!

QQQ relief bounce on the cardsNASDAQ:QQQ is at a critical level which will lend itself to a relief bounce in the coming weeks.
Note: This is not a trade recommendation do your own due diligence.

S&P, NASDAQ, DOW JONES Weekly Market Forecast: Mar 10-14 In this video, we will analyze the S&P 500, NASDAQ, AND DOW JONES Futures. We'll determine the bias for the upcoming week, and look for the best potential setups.
Markets have been bearish due to mixed numbers employment, Fed statements, and uncertainty in US trade policies. Are the markets poised for a bounce back week? Perhaps. Traders will need to exercise patience before jumping in these volatile markets, waiting for the proper confirmations before we determine a bias. Once the markets tip their hand in that way, we can take advantage.
Enjoy!
May profits be upon you.
Leave any questions or comments in the comment section.
I appreciate any feedback from my viewers!
Like and/or subscribe if you want more accurate analysis.
Thank you so much!
Disclaimer:
I do not provide personal investment advice and I am not a qualified licensed investment advisor.
All information found here, including any ideas, opinions, views, predictions, forecasts, commentaries, suggestions, expressed or implied herein, are for informational, entertainment or educational purposes only and should not be construed as personal investment advice. While the information provided is believed to be accurate, it may include errors or inaccuracies.
I will not and cannot be held liable for any actions you take as a result of anything you read here.
Conduct your own due diligence, or consult a licensed financial advisor or broker before making any and all investment decisions. Any investments, trades, speculations, or decisions made on the basis of any information found on this channel, expressed or implied herein, are committed at your own risk, financial or otherwise.

Powell’s Speech & Bitcoin’s Decline: Is More Downside Ahead? Today, Fed Chair Jerome Powell is set to speak, and traders should brace for potential market volatility! Given the recent economic data , his tone is likely to be balanced but leaning hawkish .
Why a More Hawkish Powell?
1- Strong Job Market :
Unemployment Rate : 4.1% (Still low)
Non-Farm Payrolls (NFP) : 151K (Decent, but lower than before)
Average Hourly Earnings : 0.3% (Steady wage growth)
This suggests that the labor market remains resilient, which might discourage the Fed from cutting rates too soon.
2- Inflation Still a Concern :
Wage growth and inflationary pressures persist, which means Powell may emphasize keeping rates steady longer to combat inflation.
3- Markets Are Too Optimistic on Rate Cuts :
Investors are heavily betting on rate cuts in 2024, but Powell may push back against these expectations to prevent excessive risk-taking.
Powell will likely maintain a cautious yet hawkish stance to manage expectations. Big price swings are expected across forex, crypto, and commodities—so stay alert! (Of course, this is just a personal analysis).
In addition to Donald Trump , Signs Executive Order to Create Bitcoin Strategic Reserve
Of course, today, we didn't see any strange movement in Bitcoin, and probably, the proverb " buy the rumor, sell the news " was fulfilled.
----------------------------------------------------------
Now let's take a look at the Bitcoin chart on the 1-hour time frame and also take help from technical analysis tools .
Bitcoin ( BINANCE:BTCUSDT ) is in a Heavy Resistance zone($93,300_$89,250) and has started to decline from Potential Reversal Zone(PRZ) .
From a Classic Technical Analysis , Bitcoin appears to move in a Symmetrical Triangle .
According to Elliott Wave theory , Bitcoin has completed the Double Three Correction(WXY) , and we should wait for the next bearish wave .
I expect Bitcoin to attack 200_SMA(Daily) again after breaking the lower line of the Symmetrical Triangle .
Note: Bitcoin is likely to pump more if the symmetrical triangle's upper line breaks.
Please respect each other's ideas and express them politely if you agree or disagree.
Bitcoin Analyze (BTCUSDT), 1-hour time frame.
Be sure to follow the updated ideas.
Do not forget to put a Stop loss for your positions (For every position you want to open).
Please follow your strategy and updates; this is just my Idea, and I will gladly see your ideas in this post.
Please do not forget the ✅' like '✅ button 🙏😊 & Share it with your friends; thanks, and Trade safe.
