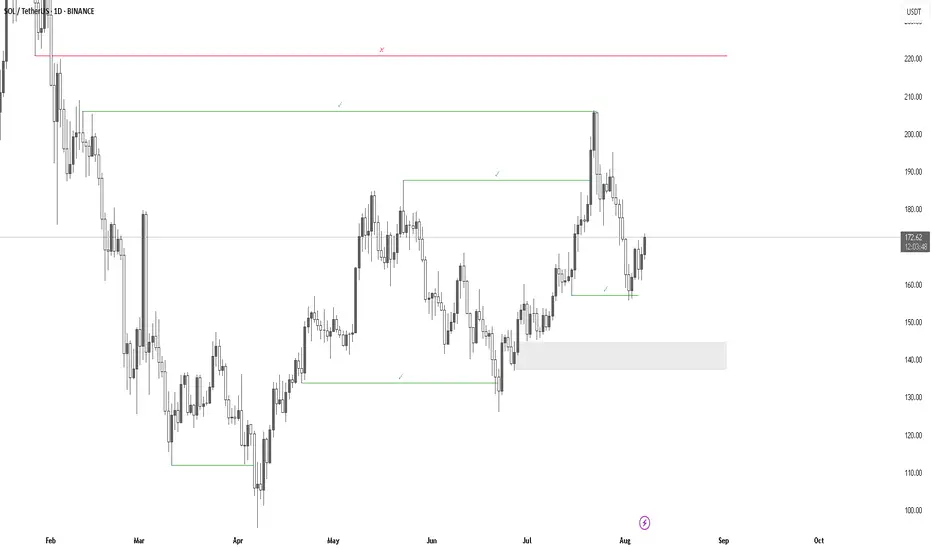
Support & Resistance – Quick Guide In 5 StepsSupport and resistance are key concepts in technical analysis that help traders identify where price is likely to react.
Support acts like a floor — a level where buying interest is strong enough to prevent further declines.
Resistance acts like a ceiling — a level where selling pressure can stop price from rising.
These zones often lead to bounces, reversals, or breakouts, and are used to plan entries, exits, and stop-losses.
How to Identify them:
1. Assess the chart.
2. Identify Swing Points: Look for repeated highs/lows and label them. (Flags)
3. Multiple touches: Highlight the zones with multiple touches. 2+ Touches are stronger.
4. Define: Clearly define the zones. Above is resistance, below is support.
5. Entry: When price makes it way down to support, wait for the reversal. Upon reversal enter on the low time confirmation. Ensure price has failed to break below the support.
Then set TP to the previous High/Resistance zone.
Tips:
Always treat S&R as zones, not exact lines.
Combine with trend, candlestick patterns, or volume for better confluences.
Avoid trading into strong S/R — wait for breaks or retests.
Community ideas

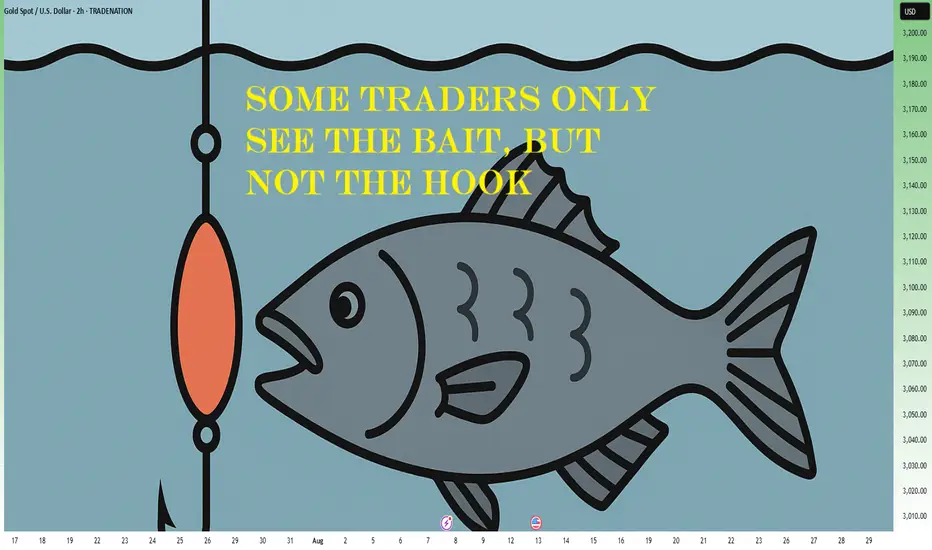
Some Traders Only See The Bait, But Not The HookLet’s get one thing straight: if you seriously think you’ve discovered a “secret” setup that you saw in a YouTube video with 1 million views, and it’s right there on the chart – clean, centered, elegant – congrats. You’re already on the hook.
Welcome. You’re liquidity.
🧼 “Clean breakout” = dig your own grave, enthusiastically
It’s honestly beautiful how thousands of traders see the same “clean breakout,” the same “double bottom,” the same “bullish engulfing,” and all believe they’re geniuses. They enter confidently, with a “perfect oversold” RSI, a “confirmed” MACD, and maybe even the moon in Capricorn.
Then, of course, the market spits their orders back in their face at 300 km/h.
Standard response? “It was manipulation.”
No, bro. It was bait. You were the fish. You bit. The market says thank you for your participation and moves on.
🧠 If you see what everyone else sees, it’s useless
What most don’t get is this: if a setup looks “too clean,” it will most probably not work. If you see it, everyone sees it. If everyone thinks something is “about to explode,” that means it’s being used – to attract orders. Your money. Your emotions. Exactly what bigger players need to exit, gracefully – on your dime.
The market is like an exclusive party: if you found out about it, it’s already lame.
💅 That warm feeling of “certainty”? Yeah, you’re screwed
The irony? The moments when a trader feels most certain are exactly the moments when they’re most exposed. The market wants you to feel relaxed. Wants you to think “this is the one.” It’s like a drug dealer giving you your first hit for free, with a smile. Not because he likes you, but because he knows you’re hooked.
So when you feel “sure” – check your mouth. You might already be on the hook.
🤡 “But it was an A+ setup!”
Of course it was. The A+ setup – seen, tested, recycled, and re-sold thousands of times. The one that works great in textbooks, backtests, webinars, and in the wet dreams of those who think they just need “a perfect strategy”.
But the market isn’t here to validate your setup. It’s here to take your money. From whom? From those who still think it’s a “fair game.”
Spoiler: it’s not.
🤔 If you’re gonna bite, at least ask: who’s holding the line?
Look at any “clear opportunity” and ask the magic question:
“Who benefits from what I’m seeing right now?”
If the answer is “me ” – you’re in trouble.
If you don’t know – you’re in even more trouble.
The market is full of traps dressed up as opportunities. Hooks that move slowly, with sexy candles, to lure in the kind of trader who only learned the “buy low, sell high” part – but skipped the chapter on “ don’t bite every shiny thing you see. ”
🎬 Bottom line:
The market doesn’t try to fool you. You’re already doing that yourself.
The market doesn’t need complex tricks. All it needs is people in a hurry, easy to excite, who never ask the right questions. Who see a green candle and think, “This is it.”
Who don’t bother looking for the hook because they’re too busy dreaming about the profits.
If you want to trade seriously, it’s simple:
Don’t ask “Where do I enter?”
Ask: “Where do they want me to enter?”
And if you’re already there… run.
🧭 Alright, now seriously
( I mean, I tried to be funny above – but let’s get real for a second )
Let’s look at a few concrete recent examples from the market:
📉 EUR/USD
On Monday, I mentioned that price was testing resistance and could offer a nice selling opportunity.
But… I changed my mind. (You know... dynamic probabilities )
The pattern was way too clean, too clear, too pretty.
And of course, price broke above.
Because if it looks too obvious – it’s probably already bait.
🟡 XAU/USD (Gold)
Since yesterday, I’ve been talking about the potential for an upside breakout.
Why?
Because 3380–3385 resistance zone is way too clean.
Everyone sees it. Everyone talks about it. Everyone sells there.
Which makes me ask: if everyone’s expecting a drop… isn’t that, once again, just bait?
Here is my Gold analysis from today:
BTC/USD
We all see the confluence of support. The perfect alignment. The setup that screams “Buy me.”
But what if it’s too perfect to be true?
What if it’s just another classic trap – the kind that gets everyone excited before the drop comes.
💡 Now don’t get me wrong – this isn’t about abandoning technical analysis.
Far from it. For me, it’s essential.
But we’ve got to use it differently.
✅ Not as a treasure map
❌ But as a battlefield map showing us where the traps are laid
So maybe… don’t bite like a lizard the second something shiny pops up on your chart.
Instead, ask yourself:
“Does this make sense… or does it make too much sense? ”
Because in trading, when something looks too clean – that’s exactly when it gets dirty.
Disclosure: I am part of TradeNation's Influencer program and receive a monthly fee for using their TradingView charts in my analyses and educational articles.
When Profit Comes, Leave Before It Vanishes Again. how??!!Have you ever stayed in a winning trade just to get more?
That voice whispering “keep it longer, this might be the big one”?
It’s the same voice that’s emptied thousands of portfolios...
Hello✌️
Spend 2 minutes ⏰ reading this educational material.
🎯 Analytical Insight on Solana:
BINANCE:SOLUSDT has seen healthy volume recently and is testing key daily support along with an important trendline. Holding these zones could fuel a 15%+ rally toward the $199 mark 📊🚀
Now, let's dive into the educational section,
🧠 The Psychology of Greed: Profit’s Evil Twin 😈
When you enter a trade and it starts moving in your favor, your subconscious kicks in. Suddenly, your brain whispers: “Just a little more... hold it!”
That’s when the greed game begins.
No matter how well you planned before the trade, once you're in profit, your brain creates a fantasy. A future where profits double, triple... a dream world. And this dream is exactly what makes traders give back everything including their original capital.
Our minds are wired to crave the rush of winning again. It’s like a hit of dopamine. So you hold the position even when the chart is flashing reversal signs. That’s the setup for disaster...
📉 Take-Profit Levels: Why Getting Out Is the Real Win 📌
Here’s the cold truth
If you don’t exit when you planned to, that profit was never really yours
A take-profit isn’t just a number. It’s a psychological boundary that separates a disciplined trader from an emotional one. Many beginners think setting a TP means giving up potential gains but in reality, it means respecting your plan and your capital.
You’ll always have another chance to trade. Always
But if greed wipes out your funds, there’s nothing left for the next opportunity
Each trade is just a chapter, not your whole story.
🧪 The Social Media Trap: When Your Brain Stops Thinking 📱
Online hype is poison. From “X coin just did 100x” to “I made $50K in a weekend” your brain gets hijacked.
You start chasing fantasies, not trades
That illusion of overnight success makes you ignore your own strategy. You stop following your plan and start trying to copy people who probably aren’t even real.
This is how social media slowly pushes traders into ruin
You feel left behind and that fear pushes you into greedy irrational decisions.
🔧 TradingView Tools That Help You Beat Greed 🛠
Luckily, TradingView offers several tools that can help keep your greed in check and your head clear
Alerts
Set an alert at your take-profit zone so you don’t keep staring at the chart. Let the system notify you when it’s time.
Long/Short Position Tool
Use this to visually define your entry, TP, and SL. Seeing it on the chart makes it easier to stick to your plan.
Bar Replay
This is gold for practice. Rewind price action and practice exits. See how often greed would’ve destroyed your trades.
Notes
Add reminders to your charts. Write things like “Exit at 2500 don’t overstay.” When future-you sees that message, it helps stay on track.
These tools don’t just improve your trades. They show discipline. And that’s exactly the kind of analysis editors look for when picking Editor’s Choice posts.
🚪 Final Words: In and Out, That’s the Game 🎯
Taking profit is a skill but exiting on time is an art
If you learn to respect your plan and silence greed, you’ll protect your capital and your sanity
There’s always a next trade if you survive this one
✨ Need a little love!
We pour love into every post your support keeps us inspired! 💛 Don’t be shy, we’d love to hear from you on comments. Big thanks , Mad Whale 🐋
📜Please make sure to do your own research before investing, and review the disclaimer provided at the end of each post.

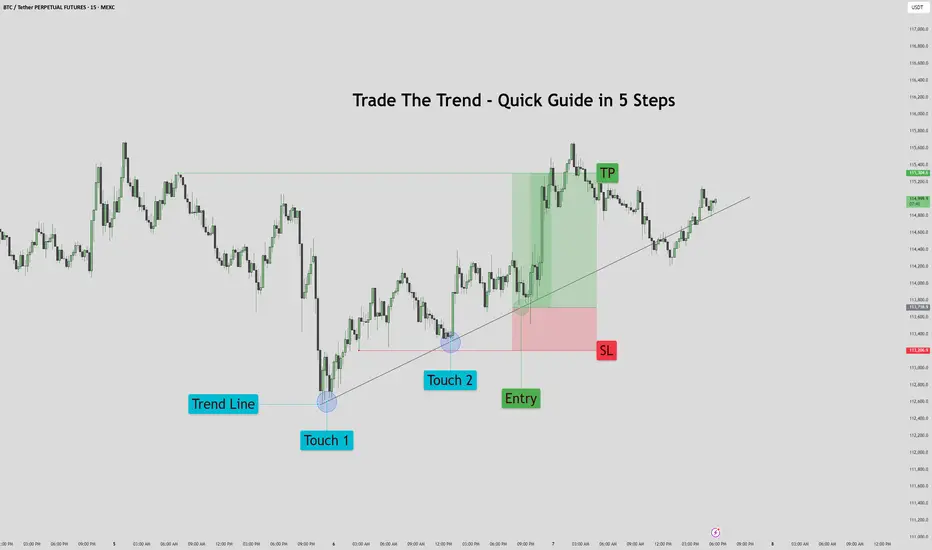
Trade The Trend – Quick Guide In 5 StepsWhat is Trading the Trend?
Trading the trend means buying when the market is going up, and selling when it’s going down.
You're following the direction of the market, not fighting it.
If the trend is up:
Price makes higher highs and higher lows
You look for chances to buy (go long)
If the trend is down:
Price makes lower highs and lower lows
You look for chances to sell (go short)
Why it works:
You’re going with momentum
Simple rule:
Buy in an uptrend, sell in a downtrend — never trade against the flow
1. Assess the chart. Where is it headed? It's headed up.
2. Place your trend line by connecting the first two points.
3. Let the chart play out for a bit. Afterwards prepare your entry on previous failed trend line retest. Set your stop loss below the previous trend line retest, and your TP just before the previous sweep above.
4. Proceed to let the chart play out, then set your pending order.
5. Watch the Trade enter and play out with patience.
This method works for bearish trends as well, just reversed.
If you would like to see more 5 step guides, comment down below.
Thank you!
Examples of Conditions for Starting a Trade
Hello, fellow traders!
Follow us to get the latest information quickly.
Have a great day!
-------------------------------------
This time, I'm going to talk about when to start and when to close a trade.
Trading has no beginning or end.
In other words, you can start a trade at any time and close it at any time.
The only question is whether you can profit from the time you start the trade and when you close it.
Therefore, it's best to be clear about why you need to start trading.
In other words, you need to be able to explain why you need to start trading now.
If you can't, it's best not to start trading.
You should also be able to explain why you're closing the trade now or selling in installments.
If you can't, it's likely that you don't have a well-established trading strategy.
A trading strategy should be developed from a broad perspective.
After that, you should develop a detailed response strategy that stabilizes your psychological state according to price volatility and guides your trading accordingly.
Therefore, a basic trading strategy is essential.
This basic trading strategy may vary depending on your investment style, so it's important to establish a basic trading strategy that suits you.
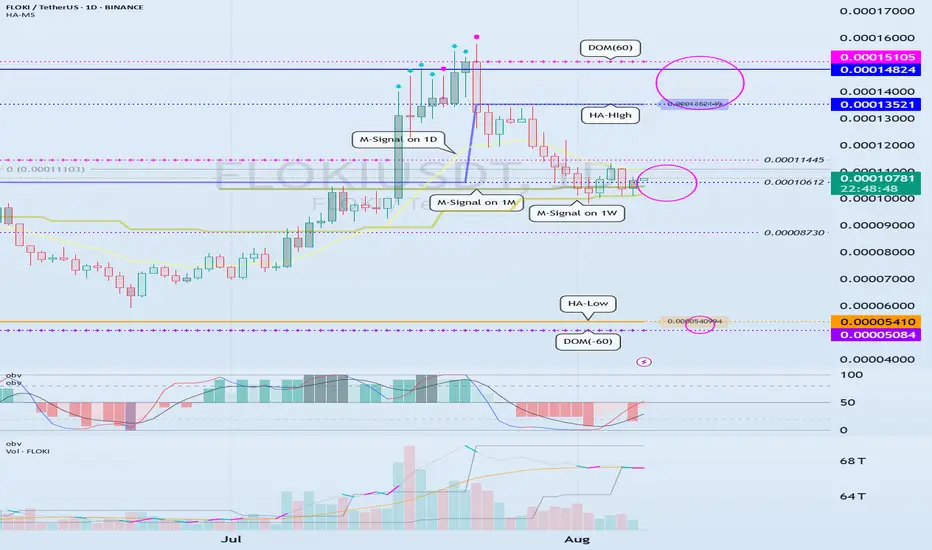
My basic trading strategy is to buy in the DOM(-60) ~ HA-Low range and sell in the HA-High ~ DOM(60) range.
------------------------------------------------------------------------------
To initiate a trade, you can determine whether support is available at important support and resistance levels or areas.
The optimal range for this is when support is found and the price rises in the DOM (-60) ~ HA-Low range.
This corresponds to the conditions for trading on the Heikin-Ashi chart.
-
Next, the M-Signal indicators on the 1M, 1W, and 1D charts converge and break upward, sustaining the price.
In other words, the price rises when support is found around the current price range of 0.000010612-0.00011445.
This represents an important turning point from a trend perspective.
-
If you bought in the above range, the sell range would be 0.00013521-0.00014824.
This sell zone corresponds to the high point, HA-High ~ DOM(60).
This means that a stepwise uptrend, or a full-blown uptrend, is likely to begin only when the price rises above the HA-High ~ DOM(60) range.
-
If you start trading at other support and resistance points or zones, it can be difficult to respond to price volatility.
Therefore, it's best to check for support and initiate trading within the DOM(-60) ~ HA-Low and HA-High ~ DOM(60) zones, if possible.
From a trend perspective, if the M-Signal indicators on the 1M, 1W, and 1D charts converge, and the price breaks upward and sustains, as is currently the case, trading is possible if support is found at the support and resistance levels near those points.
While this trading method cannot guarantee profit, it is worth developing a trading strategy and attempting it.
-
Thank you for reading to the end. I wish you successful trading.
--------------------------------------------------
EURGBP – CHART EXPLANATION & FULL TOP DOWN ANALYSIS BREAKDOWN 📊 EURGBP – CHART EXPLANATION & FULL TOP DOWN ANALYSIS BREAKDOWN
Q3 | W32 | D6 | Y25
Daily Forecast 🔍📅
Here’s a short diagnosis of the current chart setup 🧠📈
Higher time frame order blocks have been identified — these are our patient points of interest 🎯🧭.
It’s crucial to wait for a confirmed break of structure 🧱✅ before forming a directional bias.
This keeps us disciplined and aligned with what price action is truly telling us.
📈 Risk Management Protocols
🔑 Core principles:
Max 1% risk per trade
Only execute at pre-identified levels
Use alerts, not emotion
Stick to your RR plan — minimum 1:2
🧠 You’re not paid for how many trades you take, you’re paid for how well you manage risk.
🧠 Weekly FRGNT Insight
"Trade what the market gives, not what your ego wants."
Stay mechanical. Stay focused. Let the probabilities work.
FX:EURGBP

Bitcoin(BTC): History Never Lies | 3-5 Months Before Bear MarketBull Market - Bear Market - Accumulation - Expansion - Reaccumulation: this is the pattern we have been going with since 2012, where currently, after some help from Trump, in combination with the 2024 halving, we had really good upside momentum, which formed the new ATH and led us into the bull run that we have been looking for (by we I mean most traders).
Now, since the last time we shared this kind of analysis on the markets, we have successfully entered the bull market, where currently, based on previous bull runs, we still have around 90-150 days left of further upside movement, which would be a perfect opportunity for altcoins to have their momentum as well.
But bear in mind, each cycle is different, so we have to be ready for anything. What we see is that 2026 should be a bearish year, so be ready for that!
Swallow Academy

Understanding Trend Reversals: Switch Levels & Peak Formations EAs traders, one of our biggest challenges is identifying the trend and recognizing when it's rolling over to form a peak formation. In this video, I’ll give you a quick yet powerful introduction to the theory behind switch levels and peak formations — key concepts for understanding trend strength, spotting reversal zones, and determining when a high or low is potentially locked in.
Whether you’re a beginner or refining your strategy, this video will help you better develop your bias by recognizing when a trend is losing momentum.
📌 Topics Covered:
What are Switch Levels?
Identifying Peak Formations
How to Confirm a Locked-In High or Low
Reading Trend Strength and Shift Signals

The powerful perspective that can change your attitude to losseWant to know a secret? You can actually change how you react to losing trades—just by thinking differently. Cool, huh?
🫣 Here’s a hard truth that every trader needs to accept: every trade is a potential loss.
Losses are an inevitable part of the game.
No matter how good your setup is, no matter how much you’ve prepared—there will always be trades that don’t work out.
Trading is already emotionally challenging as it is. But if you get stuck obsessing over one single trade, it becomes so much more emotionally exhausting. You start evaluate yourself after every outcome. And that’s not a sustainable way to trade.
Let’s be honest: the result of one trade doesn’t say much about your actual trading performance.
It’s only over time—after a series of trades—that you can honestly evaluate how you’re doing.
If we want to reduce some of the emotional storms that come with trading, we need a different strategy. A more compassionate one. One that gives us the space to breathe, recover and grow.
So how do we do that? By practicing a shift in perspective.
A shift that’s actually rooted in neuroscience. It’s about broadening your perspective.
👉 Broadening your perspective means reminding yourself:
"This is just one of many trades I’ll take in my trading journey."
That’s it. Simple. No complicated strategy. Just a small shift in thinking that helps you regulate your emotions.
Whether you’ve just taken a loss or feel doubt creeping in before entering a trade—say it to yourself (out loud if you want!): “This is only one of many trades I will experience.”
And here comes the science part:
🧠 When you broaden your perspective like this, the brain responds. It decreases arousal in the amygdala—your brain’s “panic button.”
At the same time, it activates the prefrontal cortex—the part of your brain responsible for rational thinking, impulse control and analysis.
Put simply: you become more emotionally balanced—and more able to view the market objectively.
🤔 Why is that important?
Because when your amygdala calms down, the risk of emotionally driven mistakes decreases.
The fear becomes less intense.
And in trading terms: you’ll be better at cutting losers faster and holding on to winners longer.
🪄 Will this shift magically erase all tough emotions? No. The emotions will still be there—just not as loud.
And isn’t it more motivating to remind yourself that you are not defined by a single trade?
You’re defined by your overall journey. Your effort. Your long-term consistency.
💡Pro Tip:
Next time you feel hesitation—even with a solid setup, or after closing a losing trade
👉 Try this reminder:
“This is only one of many trades I will execute during my career.”
Let it soften the inner storm.
Happy, compassionate trading! 💙
/ Tina the Trading Psychologist

Pennant — Trend Is Your Best Friend 🚩 Pennant — Trend Is Your Best Friend 📈
drive.google.com
🔍 Introduction
The Pennant is a trend continuation pattern, resembling a small triangle that forms after a strong initial move (known as the “flagpole”). It is similar to the Flag pattern, but with one key difference: the body of the Pennant is formed by two converging trendlines, rather than parallel ones.
📐 Pattern Description
The Pennant forms after a strong, impulsive price move, indicating that the trend is likely to continue after a short pause.
Like the Flag, the Pennant consists of two main components:
The flagpole — a sharp, directional move (either bullish or bearish)
The Pennant body — a brief consolidation shaped like a symmetrical triangle 🔺
🟢 A bullish pennant forms after a strong upward move
🔴 A bearish pennant follows a strong downward move
🧠 Market psychology behind the pattern:
After a big move, many traders expect a reversal and begin taking counter-trend positions. But when the breakout occurs in the direction of the original trend, it triggers a wave of new orders, pushing price even further. That’s why the Pennant is often used to enter trades in the direction of the dominant trend.
📉 Volume behavior is also key:
High volume during the initial move
Low volume during the Pennant’s consolidation
Rising volume on the breakout
This volume pattern reflects renewed trader interest and often leads to a more explosive breakout compared to a Flag, due to the tightening nature of the consolidation.
⚠️ A weak or sloppy move before the Pennant weakens the signal and increases the risk of false breakouts.
🎯 Entry & Stop-Loss Strategy
📥 Entry: After a confirmed breakout above the Pennant’s resistance (or below it for bearish setups)
🛑 Stop-loss: Placed just below the last local low before breakout
💰 Profit Target:
Partial take profit at the top of the flagpole
Full target = the height of the flagpole projected from the breakout point (aka the Measured Move)
Always account for key support/resistance levels to define the potential range
💡 The Pennant often offers great risk/reward due to its tight structure and explosive potential.
💡 My Pro Tips for Trading Pennants
✅ Pennant Pattern Criteria
Trend continuation pattern
A strong, nearly vertical move preceding the Pennant
Triangle-shaped consolidation (two converging lines)
The Pennant body must be shorter than the flagpole
The lowest point of the Pennant should not exceed half the length of the flagpole
Breakouts should happen in the direction of the initial trend
Tight range before breakout increases accuracy
📈 What Strengthens the Signal
Sharp, clean, directional initial move (strong flagpole) ⚡
High volume on the initial move, and volume surge on breakout 💥
⚠️ What Weakens the Signal
Choppy or weak price action before the Pennant 🫤
Lack of volume during the flagpole or breakout 💤
✅ Examples of My Winning Pennant Setups
🔗 EURUSD Bearish Pennant — Ready to Drop
❌ Examples of My Losing Setups
🔗 XAUUSD Bullish Pennant — Failed Follow-through
💬 Do You Trade Pennants?
They’re one of the most powerful continuation patterns when paired with clean price action and volume confirmation. What’s your experience with Pennants? Share your wins — and fails — below 👇👇

It’s Not About Being Right Often. It’s About Making It Count WheOne of the most common misconceptions in trading is that success comes from taking more trades or having a high win rate.
It doesn’t.
In reality, the most important metric isn’t how often you’re right—it’s how much you make when you are.
⚖️ Asymmetry Is Everything
Great traders don’t need to be right 70% of the time. Many world-class strategies win less than half the time. What matters is asymmetric payoff—the idea that your winners are significantly larger than your losers.
Here’s why that matters:
A strategy with a 40% win rate and 3:1 reward-to-risk ratio can be highly profitable.
A system that wins 80% of the time but only makes 0.8 for every 1 risked will eventually blow up.
High win rate strategies often lead traders to tighten stops, cut winners short, or avoid high-reward trades that feel uncertain. It creates a false sense of control, but slowly erodes your edge.
🧠 Shift Your Mindset
✅ Focus on risk-reward, not frequency.
✅ Accept that losing trades are part of the process.
✅ Build a system where a few big wins drive your equity curve.
Trading isn’t about being “right.” It’s about being positioned well when things go right. The market doesn’t reward ego or activity. It rewards magnitude.
📌 Remember:
It’s not the number of trades or win rate that makes you money.
It’s what you do when the market finally moves in your favour.
🔔 Follow for more trading psychology insights, risk management strategies, and system-building tips.
#tradingpsychology #riskreward #asymmetry #systemtrading #mindset #tradingview #tradingtips

Trading EURUSD AUDUSD | Judas Swing Strategy 05/08/2025The Judas Swing strategy kicked off the new week with two solid setups on Monday, this time on OANDA:AUDUSD and FX:EURUSD While both played out beautifully from a structure and liquidity perspective, let’s walk through the reasoning behind each trade and how they unfolded
The first setup of the day formed on EURUSD during the early part of the New York session. Price had been ranging during the London hours, setting clear highs and lows. Just as expected, NY brought the liquidity sweep a sharp push above the range high, baiting breakout buyers and triggering stops.
That was our cue. Once the sweep completed, we watched closely for the break of structure to confirm the reversal. It came swiftly, followed by a retrace into the freshly formed Fair Value Gap the same confluence we wait for every time.
As price tapped into the imbalance and printed a bearish close, we executed the short. Risk: 1%. Target: 2R. Price moved cleanly in our direction, offering little drawdown and ultimately hitting our target in due time. A disciplined start to the week with a solid +2% gain.
Not long after we entered the FX:EURUSD position, OANDA:AUDUSD served up a nearly identical setup. Once again, we had a clear range established during the Judas Swing sessions. Then came the sweep price spiked above the range high, taking out buy-side liquidity before quickly reversing.
We marked our structure break and noted the FVG left behind. Just like before, we waited for the retrace no chasing.
Price pulled back, tapped the imbalance, and gave us a strong bearish entry signal. We entered short with the same parameters: 1% risk, aiming for a 2R return. The market delivered. The trade ran smoothly to target, netting our second +2% win of the day.

SolFun and memetokens on Solana: from chaos to structure
Solana — an ecosystem with a long-term vector
Solana occupies a stable position among the leaders in blockchain infrastructure. High speed, scalability, and minimal fees make it an ideal platform for both serious DeFi products and speculative activity. In recent months, interest in Solana has only grown, which has directly affected the number of new projects within the network.
One of the most notable trends has been memecoins. They are filling the blockchain at a tremendous rate, with dozens and hundreds of new assets appearing every day. This dynamic is largely explained by the ease of launching tokens through the Pump.fun platform.
The more popular Solana becomes, the more tokens will appear within it. This is a direct correlation: a strong foundation generates high activity at the second level of the ecosystem.
Memes as a reflection of the market
Meme tokens are not just chaos and humour. They are a separate form of local trading, with high volatility and instant reactions. This segment has become particularly active on Solana :
The absence of commissions makes trading convenient;
The speed of the blockchain allows for instant reactions;
The ease of launching tokens is a factor in mass adoption;
The community itself fuels trends.
But along with this came complications: scams, dumps, and mass bot participation. And here, the need for filtering comes to the fore.
The problem of selection and how traders deal with it
In a rapidly changing market, it is impossible to analyse every token manually. Therefore, most traders have long since developed a basic set of tools. These include things like auto-filters in Telegram, dashboards, and, of course, extensions directly within Pump.fun.
One of the most widely used is SolFun . It is built into the interface and displays key token metrics: reliability index, decentralisation, activity, holder concentration, presence of suspicious addresses, etc.
For most active participants in the Solana market, SolFun is not a ‘tool’ but part of the working environment. It has long been used by those who make dozens of trades per session.
What the trading logic looks like
In a hyperactive market, it is not the speed of entry that is important, but filtering. Successful traders do not try to catch every wave. Instead, they build a funnel: 80% of tokens are cut off at the analysis stage.
The scenario is simple:
Low reliability index — pass;
One of the holders owns too large a share — risk of dumping;
Suspicious activity from bot-like accounts on Twitter — pass;
If there are no red flags, the distribution is even, and the activity is lively, you can continue with the analysis.
These signals are immediately visible — many of them are displayed in SolFun . But perception comes not through the interface, but through habit — the eye catches familiar parameters. And if the picture does not match expectations, the trader does not enter.
Why technical analysis is not needed here
Memecoins on Solana are a market where technical analysis loses its meaning. There are no histories, patterns, or liquidity. Everything happens in minutes, and by the time any pattern appears, the movement is already complete.
Therefore, the approach here is fundamental — in its adapted form. This is not a study of the white paper, but a quick check:
How many unique holders are there?
Who are they?
How are the tokens distributed?
Is there activity from live users?
Are there any red flags — such as pBOT or sudden injections?
Such metrics are the basis of the logic that traders operate on. And tools like SolFun simply make this process faster.
Where is everything heading?
Solana is showing steady growth. This means that the ecosystem will continue to expand. And that means the meme market will only gain momentum. This is not just speculation — it is a reflection of demand and attention.
In such conditions, it is not the first to enter who survives, but those who know how to filter out the noise. SolFun , like other automated assistants, has simply established itself as part of this ecosystem. Not as a solution, but as infrastructure.

The Illusion of ControlThere comes a point in every trader’s journey when you do everything right, and it still goes wrong.
You plan the trade meticulously, plot the levels, define your risk, wait patiently for the setup, and enter with the kind of discipline that would make any textbook proud. You follow your rules. You trust your process. And yet, the market does what it does!
It breaks through your stop as if your risk management was never there. Sometimes it gaps hard against you, leaving no room to act. Sometimes it simply meanders sideways, wearing down your conviction until, exhausted and uncertain, you exit - only to watch the market finally rally the moment you’re out.
This experience is frustrating and discouraging. Yet, for those with enough experience, it's a familiar scenario.
It's not just about losing money, though that definitely stings. This kind of hit really messes with your confidence, throws off your game, and makes you feel disconnected from your work. Before you know it, those sneaky little doubts creep in: Did I miss something? Could I have stopped this? Am I just not good enough at this yet?
So you go back to the charts, really digging into every detail. You watch replays, try out new filters, and pile on more indicators, scrutinizing the trade from every possible angle. You tell yourself this super careful process makes you better, a crucial part of being a professional. But if you're real with yourself, it's more than just getting better. Underneath all this striving for improvement is often a deeper reason: you really want to be in control.
We often discuss risk management, patience, and emotional discipline, yet we seldom acknowledge our deep-seated desire to control the market. We invest countless hours in learning, testing, and refining, expecting our efforts to yield tangible results. When the market doesn't respond as we anticipate, it's disheartening. This is because, at our core, we not only aspire to be skilled traders but also crave the belief that we are truly in command.
The market just does its thing, plain and simple. It doesn't care how much work you put in or how carefully you prepare. It's not about rewarding effort; it just moves. Trying to find a reason for every little change is pointless, like trying to argue with the ocean. You can't outsmart randomness; you can only learn to coexist with it.
The best traders do prepare with care. They’re thoughtful, meticulous, and dedicated. But many cross a subtle line, often unknowingly - the line where preparation morphs into obsession, where working harder becomes an emotional shield, and where we start to believe that if we can just control every input, we can guarantee the output.
This is where it all becomes dangerous. Not financially, necessarily, but psychologically. When your self-worth becomes intertwined with your performance, every loss starts to feel personal. Every drawdown feels like an indictment. You tell yourself you’re striving for excellence, but what you’re really chasing is certainty; and in a domain governed by uncertainty, that’s a recipe for chronic frustration.
The truth is, trading isn't about being right all the time, or even most of the time. The real skill is staying cool when you mess up and not freaking out when things go sideways. You don't have to be perfect; you just need to handle the unknown without needing to control it. You won't pick up this tough lesson from courses, forums, or even tons of practice, unless you're truly reflecting on what you're doing. You learn it by watching winning trades go bad, by handling losses without freaking out, and by being able to stay cool when things get uncomfortable.
You know that annoying feeling we sometimes get? It's usually just fear, popping up as worries about messing things up, looking foolish, or not being quite good enough. When you're trading, these fears can seriously mess with your mind. You might jump into trades too quickly, fiddle with your stop-loss, settle for smaller gains, or just abandon your whole strategy when things get tough. We might try to convince ourselves we're being clever, but typically, we're just trying to escape feeling uncomfortable.
Trying too hard to control the market often hurts your edge. Trading systems usually don't fail because of math errors; they fail because traders don't have the patience to stick with them through tough times and let them do their job.
Every trader eventually faces a fundamental, liberating truth: you are not in control. Once you accept this, you can stop trying to control the uncontrollable and instead concentrate on what you can manage: your risk, routine, discipline, and behavior.
Detaching from the outcome isn't about indifference or a lack of concern; it's about embracing trust. Trust in your preparation. Trust in your edge. Trust in the law of large numbers — that over time, if you execute consistently, the results will follow. Not perfectly, not smoothly, but faithfully.
You build trust over time, often without even realizing it. It's about sticking to your plan even when things aren't going your way, taking losses in stride, and not messing with something that's working, just because it hasn't paid off yet.
Over time, your trading approach transforms. You no longer dwell on every loss or micromanage winning trades. The urge to constantly adjust your system after a bad week/month subsides. Your perspective broadens; you begin to think in terms of years, not just days. This shift cultivates a deeper, process-driven confidence, untethered from mere numbers. You stop striving for absolute control, and in doing so, discover a sense of peace.
True mastery isn't about dominating the market, but rather relinquishing the illusion that you ever could.
You Got Liquidated, Whales Used Your Liquidity To Fuel PumpsEver got stopped out right before a massive pump?
Felt like the market dipped just to take your position out?
Maybe it’s time to see whale pullbacks from a different angle...
Hello✌️
Spend 2 minutes ⏰ reading this educational material.
🎯 Analytical Insight on Dogecoin:
BINANCE:DOGEUSDT has breached all key Fibonacci supports and now rests on a critical daily support level. If this holds, a potential 20% upside toward 0.25 becomes likely. 📊🛡️
Now , let's dive into the educational section,
💣 Deep Game of the Market: Pullback or a Setup?
When we hear “pullback” we usually think of a buy opportunity. But is it always that simple? Or are some pullbacks just strategic moves by whales to hunt your liquidity?
Before major bullish moves the market looks for one precious thing: liquidity from over-leveraged poorly placed traders.
💡 How Whales Think 🤔
The biggest mistake retail traders make is assuming the market is fair
It’s not
Sudden pullbacks aren’t random They’re engineered to trigger SLs of over-leveraged traders absorb liquidity and kick off the real bullish move
🧠 Fear and Greed Psychology 😱
Retail trading is powered by two emotions
Fear leads to premature exits and tight stop-losses
Greed causes reckless entries without confirmation
These are exactly what whales feed on The market moves where emotions are strongest and liquidity is highest
🔄 After the Pullback: Time to Pump 🚀
Once the liquidity is taken the real game begins
The pump usually starts from the same level where your SL just got triggered
You’re out they’re in
This is where experience and structure reading come into play
📌 Real Pullback vs Whale Pullback 📉
A real pullback respects structure reacts to known zones and comes with volume confirmation
A whale pullback is usually fast erratic and hits zones that retail traders commonly use for SLs especially without logical support on the chart
🔁 This Pattern Repeats Just Look Back
Take a look at BTC or ETH history
Before almost every major pump there’s been a sharp fast dip that wiped out leveraged longs
Is that a coincidence or a well-crafted liquidity strategy?
🛠 How to Avoid Being Liquidated 🔐
Don’t place SLs in obvious local zones
Use volume-based tools seriously
Wait for multi-layer confirmations such as price action volume and liquidity
Avoid over-leveraging and don’t play the whale’s game
📊 Read Charts Like Maps Not Casinos 🧭
Charts tell you everything but only if you learn the language
Once you understand what whale pullbacks look like you’ll stop being a victim of pumps and start riding them
🧰 TradingView Tools to Catch Whale Pullbacks
Reading fake pullbacks or liquidity grabs isn’t easy with just candles. But TradingView offers a range of tools that act like night vision goggles in this game
🔹 Liquidity Zones Indicators: Tools like Liquidity Swipes or Session High and Low help spot areas where SL hunts are likely
🔹 Volume Profile: Highlights zones with heavy trading activity revealing where whales are likely building up positions
🔹 Relative Volume (RVOL): Spikes in volume during fast drops often signal fake pullbacks and trap setups
🔹 Fair Value Gap (FVG): These imbalanced zones usually get revisited and are prime zones for whale entries
🔹 Heatmaps (external tools): Connected to TradingView these show high liquidity zones which are perfect spots for SL hunts
Combining these tools gives you the edge to trade like a pro not a target
📎 Final Thoughts and Tip
If your SL keeps getting hit before every major move you’re not unlucky you’re playing exactly into their plan
Start using TradingView’s tools learn to read liquidity and always question whether that dip is really a pullback or a trap
✨ Need a little love!
We pour love into every post your support keeps us inspired! 💛 Don’t be shy, we’d love to hear from you on comments. Big thanks , Mad Whale 🐋
📜Please make sure to do your own research before investing, and review the disclaimer provided at the end of each post.

Cyclical Stocks vs Non-Cyclical Stocks: How Can You Trade Them?Cyclical Stocks vs Non-Cyclical Stocks: How Can You Trade Them?
Not every stock is created equal. One of the biggest distinctions is cyclical vs non-cyclical—those that grow or decline alongside economic conditions and those that are less sensitive. In this article, we explore the key differences between the two, how to analyse both, and how to trade them.
What Are Cyclical Stocks?
Cyclical stocks are those that rise and fall in line with the broader economy. They’re more sensitive to consumer spending and include those in the travel, automotive, construction, and luxury goods sectors.
Simply put, when consumers have more disposable income, they’re likely to buy new cars, travel abroad, or invest in home improvements. Demand boosts corporate earnings and pushes share prices higher. However, when consumers have less money or face economic uncertainty, they reduce and delay spending on these discretionary purchases, dampening company earnings and stock valuations.
Nike and Starbucks are good examples here—both are cyclical companies that see higher demand when consumers are in a stronger financial position and feel comfortable purchasing brand-name clothes or buying coffee on the go.
Cyclical stocks tend to be more volatile than non-cyclical ones. Their sensitivity to cyclical business conditions offers potential opportunities for traders to capitalise on a growth phase, but timing matters—getting caught in a temporary or prolonged downturn can lead to sharp drawdowns.
Cyclical Sectors
- Automotive
- Airlines & Travel
- Luxury Goods & Apparel
- Construction & Materials
- Banking & Financial Services
- Technology & Semiconductors
- Restaurants & Entertainment
- Retail (Discretionary Spending)
Is Tesla a Cyclical Stock?
Yes, Tesla is a cyclical stock. Demand for electric vehicles moves in line with economic conditions, consumer spending, and interest rates.
Is Amazon a Cyclical Stock?
Amazon is partly cyclical. Its retail business depends on consumer spending but its cloud computing division (AWS) sees constant demand and provides diversification.
What Are Non-Cyclical Stocks?
Non-cyclical stocks belong to companies that sell essential goods and services. Contrasting with cyclical stocks and their sensitivity to consumer spending, non-cyclical companies sell things people buy regardless of economic conditions. They’re often referred to as defensive stocks because they tend to hold up when the economy weakens.
Non-cyclical sectors include healthcare, utilities, and consumer staples. Supermarkets, pharmaceutical companies, and electricity providers see relatively steady demand because people still need food, medicine, and power whether the economy is growing or contracting.
For example, consumer non-cyclical stocks, like Procter & Gamble, which owns brands like Oral-B, Charmin, and Gillette, continue to generate revenue year-round because consumers still buy everyday household items. The same goes for Johnson & Johnson, which sells medical products that hospitals and pharmacies need.
Compared to cyclical stocks, non-cyclical stocks are usually less volatile because their earnings are more consistent. While their potential returns are relatively limited vs their more growth-oriented cyclical counterparts, non-cyclical stocks are believed to not dive as sharply during a downturn.
Non-Cyclical Sectors
- Consumer Staples (Everyday Goods)
- Healthcare & Pharmaceuticals
- Utilities (Electricity, Water, Gas)
- Telecommunications
- Grocery & Essential Retail
- Defence & Aerospace
How Traders Analyse Cyclical Stocks
In a market where going long or short volatile cyclical stocks is an option (such as with CFDs), many prefer to trade them over non-cyclical stocks. More broadly, traders analyse a few key indicators to determine whether cyclical stocks are in a growth phase.
Macroeconomic Indicators
When GDP expands, businesses and consumers spend more, and free-flowing spending boosts demand in cyclical sectors. Similarly, interest rates determine spending on more big-ticket purchases, like cars, homes, and luxury goods. Lower interest rates encourage borrowing and vice versa.
Employment rates also play a key role. More layoffs and a higher unemployment rate mean consumers dial back purchases of discretionary goods and services. Employment conditions, along with economic and policy uncertainty, drive consumer confidence. When optimism is high, cyclical stocks often rally.
Earnings Trends & Sector Data
Unlike non-cyclical companies, cyclical firms see earnings fluctuate based on economic cycles. Traders pay attention to quarterly reports and especially forward guidance. If a company expects strong sales growth due to rising demand, this can drive its stock price higher and possibly signal an upswing in the sector.
Industry-specific data, like auto sales figures or airline bookings, is also a useful gauge for assessing the future performance of a company.
Market Sentiment & Seasonal Trends
Cyclical stocks are prone to seasonal patterns—retailers surge in the holiday season, while travel stocks perform well in summer. Market sentiment is another important factor; for instance, if economic uncertainty is growing but investors on the whole believe it to be a temporary blip, then cyclical stocks may still rise.
Analysing Non-Cyclical Stocks
While traders often favour cyclical stocks for their higher potential returns, many still turn to non-cyclical companies as a possible form of short-term defence against downturns, to balance a long-term portfolio, or when unique occasions arise (earnings reports, company-specific news, etc.).
Earnings Stability & Cash Flow
Since non-cyclical companies sell essential goods and services, their earnings tend to be more consistent. Traders look at revenue trends, gross margins, and free cash flow to assess a firm’s ability to generate relatively steady income. Consistent earnings—even during downturns—can be a marker of a strong non-cyclical stock.
Dividend History & Payout Ratios
Many non-cyclical stocks pay dividends. That makes them attractive for those looking for income-generating assets. A company with a long track record of consistent or growing dividend payments is often a sign of financial strength. The payout ratio (dividends paid as a percentage of earnings) is another metric traders examine—too high, and it could indicate unsustainable distributions.
Market Conditions & Defensive Rotation
If economic uncertainty rises, investors will generally shift into defensive sectors like healthcare, utilities, and consumer staples. Many will monitor fund flows—where institutional money managing exchange-traded funds (ETFs), mutual funds, and large portfolios is headed—to understand if risk aversion is growing.
Likewise, outperformance in certain sectors can be a signal. If sector indices like the S&P 500 Consumer Staples Index or the S&P 500 Healthcare Index outperform the overall S&P 500, it may indicate capital moving into non-cyclical stocks.
Trading Cyclical and Non-Cyclical Stocks
Now, let’s take a closer look at how traders engage with these stocks.
Short-Term Trading
Short-term traders generally focus on stocks or sectors expected to move over hours or days. One strategy might be to examine the broader conditions and trade ahead of earnings reports. If summer is approaching and the economy is doing well, Delta Air Lines could rise in the weeks before an earnings release as traders anticipate strong quarterly performance and positive forward guidance.
Another strategy is trading macro themes. If inflation rises, traders might focus on companies with strong pricing power, like consumer staples firms that can pass costs onto consumers. If economic data points to a slowdown, they might focus on healthcare stocks.
Medium-Term Trading
Medium-term traders take a broader view and typically adjust their portfolio weightings based on economic conditions. During expansions, they may overweight cyclicals like construction and travel stocks, while shifting into non-cyclicals as recession risks grow. That could mean just rebalancing a collection of ETFs, over/under-weighting a set of stocks, or a mix of both.
Here, the focus is usually on broader economic trends while also staying alert for possible strengthening or weakening consumer demand.
Long-Term Trading
Long-term traders often hold a mix of cyclical and non-cyclical stocks to maintain a balanced portfolio across economic cycles. While they may still adjust weightings over time, they tend to be more concerned with long-term sector trends and income generation.
With a longer time horizon, these traders may be more willing to allocate more capital to cyclical stocks during a downturn, especially to otherwise strong companies or sectors, to take advantage of potential rebounds months down the line.
The Bottom Line
Understanding the difference between cyclical and non-cyclical stocks is fundamental to trading them. Careful analysis—macroeconomic, sectoral, and company-specific—can help traders identify potential opportunities across all time horizons.
FAQ
What Are Examples of Cyclical Stocks?
Cyclical stocks include Tesla (TSLA), Delta Air Lines (DAL), Nike (NKE), Caterpillar (CAT), Marriott International (MAR), and Ford (F).
Which Industries Are Most Cyclical?
Highly cyclical industries include automotive, airlines, hospitality, construction, luxury goods, and consumer discretionary retail.
Is Coca-Cola a Cyclical Stock?
No, Coca-Cola is considered a non-cyclical stock. Demand for its wide range of products remains stable regardless of economic conditions.
Is Starbucks a Cyclical Stock?
Yes, Starbucks is a cyclical stock. Coffee purchases aren’t essential, so demand fluctuates based on disposable income and consumer confidence.
This article represents the opinion of the Companies operating under the FXOpen brand only. It is not to be construed as an offer, solicitation, or recommendation with respect to products and services provided by the Companies operating under the FXOpen brand, nor is it to be considered financial advice.
The Platinum BulletOver the years, I have posted a lot of educational content here on TradingView. Everything from Elliot waves to Wyckoff, psychology to Gann.
I have been lucky as a trader, 25 years doing this you pick up a thing or two. But above everything else, what you realise is that trading is a mindset game and not a technical one.
Many new traders try their luck. They are either experts in another field or simply successful in something else, or they come to the trading arena seeking wealth.
Both tend to get humbled quickly.
It is common for many new traders to put so much emphasis on the strategy, they overlook the psychology. You see, a strategy might work for someone, but you can't get it to work for you. This could simply be the time on the charts you lack, the timeframe or the instrument you are trading. The account balance or the fact you are not used to seeing 3-4 losses in a row.
When it comes to trading, less really is more!
Here's a simple one for you.
Take the mechanical range post I posted.
Now look at this;
On the larger timeframes we can see clearly the ranges and the supply/demand.
Then dropping down to the daily.
This is where, the technical aspect becomes less important and the psychology behind the move shows it's hand.
I have added volume and the AD line just to show how obvious this can be.
What do you see? Well as the price goes up, the volume goes down, we know we took liquidity to the upside.
So, if nothing else you would anticipate a pullback phase.
Then you get the clarity. Price drops and then pushes back, yet fails to make a new high. Almost like the volume told you it was about to happen.
Where did it pull back to?
Adding a simple volume profile too, from the swing high to the swing low. You can see the majority of the sell off (PoC) happened at a specific price point. Price pulled back to exactly that region before dropping.
The drop caused a local change in character and immediately took out the swing low - the last swing low of the leg up. (the real change in the trend).
There is obviously more to cover than this, but that is for another post.
Once you learn the way markets capitalise on the fear, the greed, the herd mindset, sentiment of the retail crowd. You can use the sentiment analysis in your favour.
You don't need 6 screens, fancy indicators, there is no silver bullet or 100% win rate strategies. And no a bot won't make you a Billionaire overnight.
If it was that easy, we would have no doctors, lawyers or firefighters; they would all be professional Bot traders.
Simplify your approach, put emphasis on the proper mindset, psychology and risk management and you will do alright!
Stay safe in the markets!
Some other recent posts;
Disclaimer
This idea does not constitute as financial advice. It is for educational purposes only, our principal trader has over 25 years' experience in stocks, ETF's, and Forex. Hence each trade setup might have different hold times, entry or exit conditions, and will vary from the post/idea shared here. You can use the information from this post to make your own trading plan for the instrument discussed. Trading carries a risk; a high percentage of retail traders lose money. Please keep this in mind when entering any trade. Stay safe.

Accurate Price Model for Trading Smart Money Concepts SMC (=
If you trade Smart Money Concepts SMC, there is one single pattern that you should learn to identify.
In this article, you will learn an accurate price model that you can use to predict a strong bullish or bearish movement way before it happens.
Read carefully and discover how to track the silent actions of smart money on any market.
The only thing that you need to learn to easily find this pattern is basic Structure Mapping . After you map significant highs and lows, you will quickly recognize it.
This SMC pattern has 2 models: bullish and bearish ones.
Let's start with a bearish setup first.
Examine a structure of this pattern
it should be based on 2 important elements.
The price should set a sequence of equal lows.
These equal lows will compose a demand zone.
The area where a buying interest will concentrate.
The minimum number of equal lows and lowers highs should be 2 to make a model valid.
Exhausting of bullish moves will signify a loss of confidence in a demand zone . Less and less market participants will open buy positions from that.
At some moment, a demand zone will stop holding. Its bearish breakout will provide a strong bearish signal , and a bearish continuation will most likely follow.
This price model will signify a market manipulation by Smart Money.
They will not intentionally let the price fall, not letting it break a demand zone. A buying interest that will arise consequently will be used as a source of liquidity.
Smart money will grab liquidity of the buyers, silently accumulating huge volumes of selling orders.
Once they get enough of that, a bearish rally will start, with a demand zone breakout as a trigger.
Though, the chart model that I shared above has a strong bullish impulse, preceding its formation, remember that it is not mandatory.
The price may also form a bearish impulse first and for a pattern then.
Each bullish movement that initiates after a formation of an equal low should be weaker than a previous one.
So that the price should set a lower high every time after a formation of an equal low.
Look at a price action on USDCHF forex pair. Way before the price dropped, you could easily identify a market manipulation of Smart Money and selling orders accumulation.
A breakout of a horizontal demand zone was a final bearish confirmation signal.
Let's study its bullish model.
It has a similar structure.
The price should set a sequence of equal highs, respecting a horizontal supply zone.
Each bearish move that follows after its test should have a shorter length, forming a higher low with its completion.
This model will be also valid if it forms after a completion of a bearish impulse.
Weakening bearish movements will signify a loss of confidence in a supply zone, with fewer and fewer market participants selling that.
Its bullish breakout will be an important even that will confirm a highly probable strong bullish continuation.
Smart Money will use this price model to manipulate the market and accumulate buying orders, not letting the price go through a supply zone. They will grab a liquidity of the sellers each time a bearish move follows from a supply zone.
When they finally get enough of a liquidity, a bullish rally will initiate and a supply zone will be broken , providing a strong confirmation signal.
That price model was spotted on GBPJPY forex pair.
Smart Money were manipulating the market, not letting it continue rallying by creating a significant horizontal supply zone.
Selling orders that were executed after its tests provided a liquidity for them.
A bullish breakout of the underlined zone provides a strong bullish confirmation signal.
A breakout and a future rise could be easily predicted once this price model appeared.
Why they do it?
But why do Smart Money manipulate the markets that way?
The answer is simple: in comparison to retail traders, they trade with huge trading orders . To hide their presence and to not impact market prices much, they split their positions into a set of tiny orders that they execute, grabbing the liquidity.
The price model that we discussed today is the example how they do it.
The important thing to note about this pattern is that it efficiently works on any market and any time frame. You can use that for scalping, day trading, swing trading. And it can help you find great investing opportunities.
❤️Please, support my work with like, thank you!❤️
I am part of Trade Nation's Influencer program and receive a monthly fee for using their TradingView charts in my analysis.
From Fakeout to Takeoff: How the V-Pattern REALLY WorksEver seen a support level break, only for the price to rocket back up in a V-shape? That’s the V-Pattern in action! In this post, Skeptic from Skeptic Lab breaks down the step-by-step mechanics of this powerful setup. From the fakeout that traps short sellers to the surge of buy orders from liquidations, you’ll learn exactly how buyers flip the script and create explosive reversals. Perfect for traders looking to spot high-probability setups. Join me to decode the markets—check out the steps and level up your trading game!

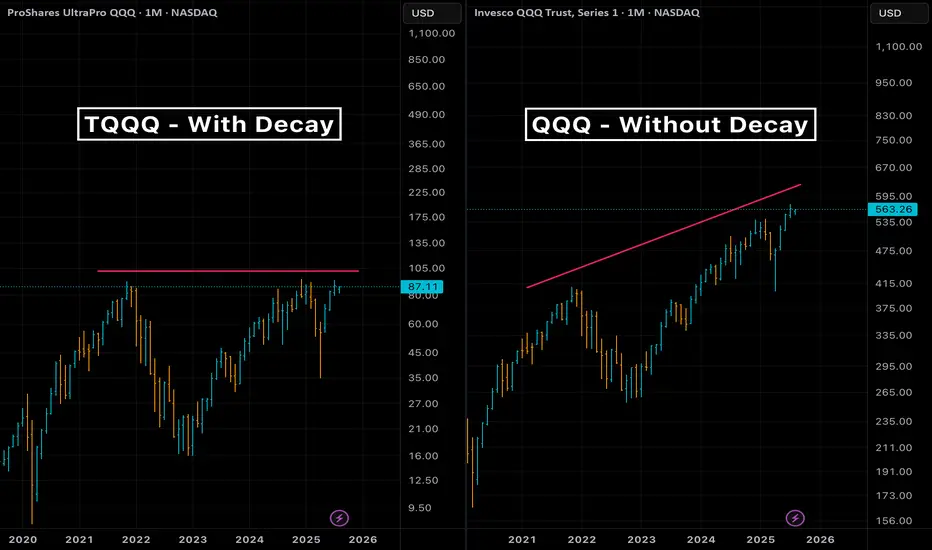
Turning leveraged ETF decay into preyWelcome to this guide on harnessing the natural decay in leveraged ETFs as a strategic edge, rather than fighting against it. We’ll assume you have a basic understanding of options and are comfortable using at-the-money (ATM) strikes as a conservative reference point—advanced users can tailor strike selection to their own edge.
Overview of Leveraged ETFs
What they are and how they reset
• Leveraged ETFs (e.g. NASDAQ:TQQQ , NASDAQ:SQQQ ) aim to deliver a constant multiple (×2 or ×3) of daily returns of an index.
• Inverse ETFs provide –2× or –3× daily exposure without using options.
• Daily reset and compounding create path dependency, leading to “decay” over multi-day holds.
The Decay Mechanism
A quick reminder
• Volatility drag (aka “gamma decay”) causes leveraged ETFs to underperform their stated multiple over longer horizons in sideways or choppy markets.
• The longer you hold beyond one day, the more cumulative leak you face.
Using Decay as a Tailwind
• Rather than avoiding decay, structure trades to benefit from it when your directional bias is robust.
• Combine traditional technical setups with the telescoping of leverage + decay to magnify returns on the correct market view.
• Small notional capital can control large effective exposure via a leveraged ETF + ATM option.
Strategy Execution
• To short the market : buy long puts on a bullish leveraged ETF (e.g. NASDAQ:TQQQ puts).
• To go long the market : buy long puts on an inverse leveraged ETF (e.g. NASDAQ:SQQQ puts).
• Use ATM options for defined risk and to capture both directional move and extra tailwind from ETF decay.
• Position size example: controlling $10k of market exposure might only require $200–$500 in option premium, depending on expiry.
Time Horizon for Decay Tailwind
• Empirically, decay compounds meaningfully over more than one trading day.
• Short-term horizons (2–5 trading days) often capture a useful drift without excessive market risk.
• Back-test your preferred ETF to find the sweet spot for your volatility regime.
High-Volume ETFs to Watch
Bear (inverse) ETFs:
• AMEX:BITI • AMEX:LABD • NASDAQ:SQQQ • AMEX:TZA • AMEX:SOXS • AMEX:SPXS
Bull (long) ETFs:
• AMEX:BITU • AMEX:LABU • NASDAQ:TQQQ • AMEX:TNA • AMEX:SOXL • AMEX:SPXL
Closing Thoughts & Disclaimers
This tutorial highlights how to position decay as a tailwind when your outlook aligns with market direction. Leveraged instruments and options carry amplified risks—only trade with capital you can afford to lose and always define your risk parameters before entry.
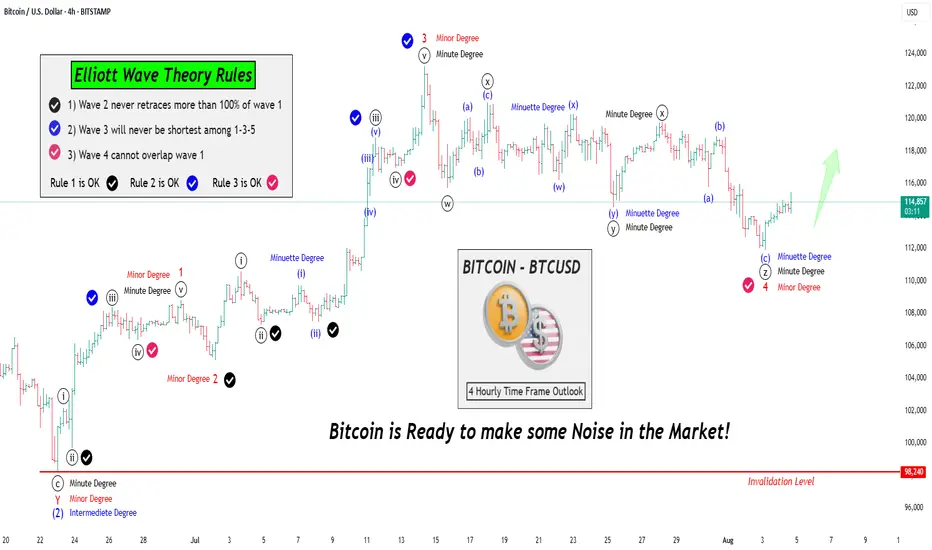
Let's learn & Apply Elliott Wave Rules on chart: BTCUSD BitcoinHello Friends,
Welcome to RK_Chaarts,
Friends, Today we are going to learn 3 Rules of the Elliott Wave theory, there are three principles and some patterns. Impulses move in a 1-2-3-4-5 pattern, either as an impulse or a motive wave. However, within impulses, there are three rules:
Rule No 1:
Wave 2 will never retrace more than 100% of Wave 1.
Rule No 2:
Wave 3 will never be the shortest among Waves 1, 3, and 5; it can be the largest, but never the smallest.
Rule No 3:
Wave 4 cannot overlap Wave 1, except in diagonals or triangles; in impulses, it cannot overlap.
We've checked these three rules and marked them with separate tick marks on the chart with different colors, making them clearly visible. You can review the chart and verify these rules yourself, learning how wave principles are applied and checked.
We've explained all this through a drawing on the chart, so we won't elaborate further here. Moving forward, let's analyze what the wave theory suggests about the current market trend. This entire analysis is shared for Educational purposes only.
I hope you'll consider this educational post as a learning resource, Definitely, I encourage you to review the chart as an image or picture to better understand the concepts we've worked hard to explain.
Our effort will be successful if you gain a deeper understanding and learn something new from this post. If you find this helpful and informative, our hard work will have paid off. Please keep this in mind as you review the material.
Now let's explore how wave counts within wave counts, or lower degrees within higher degrees, unfold through complete wave theory patterns and following theory Rules all the times.
Let's take a closer look at the Bitcoin chart we've analyzed using Elliott Waves. From this perspective, it's clear that the Intermediate Degree Wave (2) concluded around June 23rd.
After this, we observe that the internal wave counts of the lower degree, specifically Wave 1-2-3 (in red) have completed their cycle of Minor degree. Furthermore, Red Wave 4 of same Minor degree has been moving sideways, characterized by a downward trend.
Notably, the fall of Red Wave 4 is classified as a Minor Degree movement. Interestingly, this downward movement appears to have terminated in an even lower degree, namely the Minute Degree, which we've marked in black as ((w))-((x))-((y))-((xx))-((z)) that means Wave 4 of Minor degree (in Red) is complete.
Given that Red Wave 4 Minor has reached its conclusion, it's highly plausible that Wave 5 has initiated. This development suggests that Bitcoin is poised to make a significant move.
Moving on to the analysis, we observe that:
- Rule 1: Wave 2 has not retraced more than 100% of Wave 1, so this rule is intact.
- Rule 2: Wave 3 is not the shortest among Waves 1, 3, and 5, so this rule is also valid.
- Rule 3: Wave 4 does not overlap Wave 1, so this rule is also satisfied.
Bitcoin is all set to shake things up! We eagerly anticipate further rallies in the market.
This post is shared purely for educational purpose & it’s Not a trading advice.
I am not Sebi registered analyst.
My studies are for educational purpose only.
Please Consult your financial advisor before trading or investing.
I am not responsible for any kinds of your profits and your losses.
Most investors treat trading as a hobby because they have a full-time job doing something else.
However, If you treat trading like a business, it will pay you like a business.
If you treat like a hobby, hobbies don't pay, they cost you...!
Hope this post is helpful to community
Thanks
RK💕
Disclaimer and Risk Warning.
The analysis and discussion provided on in.tradingview.com is intended for educational purposes only and should not be relied upon for trading decisions. RK_Chaarts is not an investment adviser and the information provided here should not be taken as professional investment advice. Before buying or selling any investments, securities, or precious metals, it is recommended that you conduct your own due diligence. RK_Chaarts does not share in your profits and will not take responsibility for any losses you may incur. So Please Consult your financial advisor before trading or investing.
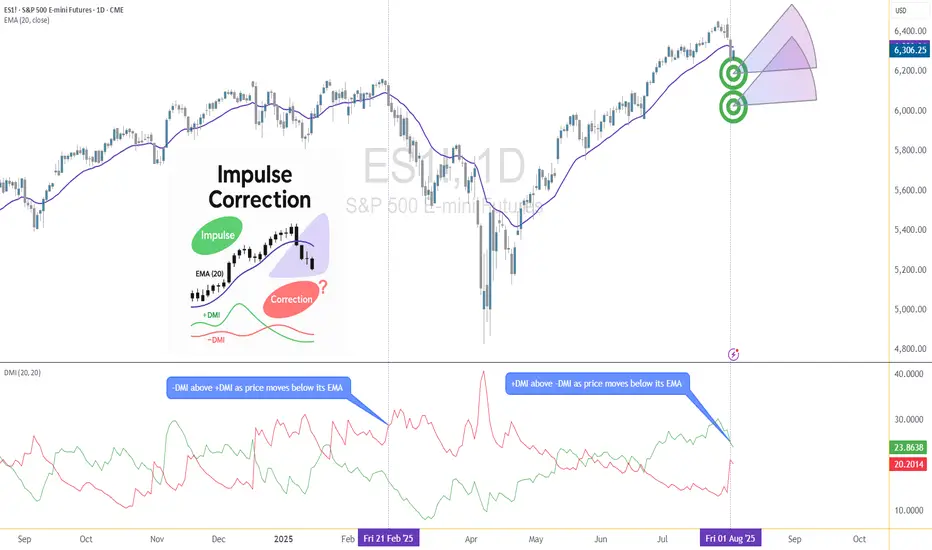
Corrective Dip or New Downtrend on the S&P 500 Futures?🟣 1. Impulses vs. Corrections – The Classical View
When price trends, it doesn't move in a straight line. Instead, it alternates between directional movements called impulses and counter-directional pauses or retracements known as corrections. Most analysts define an impulse as a sharp, dominant move in the direction of the trend—typically accompanied by rising volume and momentum indicators. Corrections, on the other hand, tend to be slower, overlapping, and often occur with declining volume.
Common methods to identify impulses vs. corrections include:
Swing structure: Higher highs and higher lows suggest impulse; overlapping lows suggest correction.
Fibonacci retracements: Corrections often retrace up to 61.8% of a prior impulse.
Moving averages: Price above a rising MA is often viewed as impulse territory.
Volume analysis and oscillators such as RSI or MACD are used to confirm price behavior.
Despite the abundance of methods, the distinction between impulses and corrections often remains subjective. That’s where the Directional Movement Index (DMI) provides an objective lens—especially when paired with price action.
🟣 2. Rethinking Impulses with the DMI Indicator
The Directional Movement Index (DMI), developed by J. Welles Wilder, offers a quantitative way to assess the strength and direction of price movement. It breaks down market activity into three components:
+DMI (Positive Directional Movement Index): Measures the strength of upward movements.
−DMI (Negative Directional Movement Index): Measures the strength of downward movements.
ADX (Average Directional Index): Quantifies overall trend strength but is optional in this discussion.
The key to applying DMI lies in the crossover between +DMI and -DMI:
When +DMI > -DMI, upward price moves dominate—suggesting bullish impulses.
When −DMI > +DMI, downward moves dominate—suggesting bearish impulses.
Calculation is based on a comparison of successive highs and lows over a specific lookback period—commonly set to 14 or 20 periods.
While EMAs track trend direction and momentum, DMI helps dissect who’s in control. This makes it a powerful filter when evaluating whether a breakdown or breakout is likely to become an impulsive trend—or just another correction in disguise.
🟣 3. Case Study – Two Breakdowns, Two Outcomes
Let’s apply this logic to two recent moments on the E-mini S&P 500 Futures (ES) daily chart.
🔹 Feb 21, 2025 Breakdown
Price broke sharply below the 20-period EMA. At first glance, this looked like a potential trend reversal. The DMI confirmed this suspicion: −DMI surged above +DMI, signaling downside impulses were in control. The market followed through with a clear downtrend, confirming the move was not just a pullback—it was a shift in market structure.
🔹 Aug 1, 2025 Breakdown
A similar sharp break below the 20 EMA just occurred again. However, this time +DMI remains above −DMI, despite the bearish price action. This divergence tells a different story: the breakdown may not be impulsive in nature. Instead, it's likely a corrective dip within a broader uptrend, where buyers are still the dominant force.
This is a textbook example of how a moving average crossover without DMI confirmation can mislead traders. By combining these tools, we’re able to make more informed decisions about whether price action is signaling a true shift—or just a pause.
🟣 4. CME Product Specs – ES vs. MES
Traders can express directional views on the S&P 500 using two primary CME futures contracts: the E-mini S&P 500 Futures (ES) and the Micro E-mini S&P 500 Futures (MES). Both track the same underlying index but differ in size, capital requirement, and tick value.
✅ E-mini S&P 500 Futures (ES)
Symbol: ES
Contract Size: $50 x S&P 500 Index
Tick Size: 0.25 index points
Tick Value: $12.50
Initial Margin: Approximately $21,000 (varies by broker and through time)
Market Hours: Nearly 24/6
✅ Micro E-mini S&P 500 Futures (MES)
Symbol: MES
Contract Size: $5 x S&P 500 Index
Tick Size: 0.25 index points
Tick Value: $1.25
Initial Margin: Approximately $2,100 (varies by broker and through time)
The Micro contract provides access to the same market structure, liquidity, and price movement as the E-mini, but with a fraction of the exposure—making it ideal for smaller accounts or more precise position sizing.
🟣 5. Risk Management Matters
Understanding whether a market move is impulsive or corrective isn’t just academic—it’s the difference between positioning with the dominant flow or fighting it. Traders often get trapped by sharp moves that appear trend-defining but are simply noise or temporary pullbacks.
Using tools like DMI to confirm whether directional strength supports price action provides a layer of risk filtration. It prevents overreaction to every EMA crossover or sudden price drop.
Stop-loss orders become vital in both impulsive and corrective conditions. In impulsive environments, stops help lock in profits while protecting from reversals. In corrective phases, they act as circuit breakers against breakouts that fail.
Moreover, knowing the product you're trading is critical:
A single ES contract controls ~$320,000 of notional value.
An MES contract controls ~$32,000.
This disparity means poor sizing on ES can magnify errors, while proper sizing on MES can offer flexibility to test, scale, and hedge with tighter capital control.
Whether you're reacting to price or preparing for continuation, risk management is the only constant. It’s what turns analysis into disciplined execution.
When charting futures, the data provided could be delayed. Traders working with the ticker symbols discussed in this idea may prefer to use CME Group real-time data plan on TradingView: www.tradingview.com - This consideration is particularly important for shorter-term traders, whereas it may be less critical for those focused on longer-term trading strategies.
General Disclaimer:
The trade ideas presented herein are solely for illustrative purposes forming a part of a case study intended to demonstrate key principles in risk management within the context of the specific market scenarios discussed. These ideas are not to be interpreted as investment recommendations or financial advice. They do not endorse or promote any specific trading strategies, financial products, or services. The information provided is based on data believed to be reliable; however, its accuracy or completeness cannot be guaranteed. Trading in financial markets involves risks, including the potential loss of principal. Each individual should conduct their own research and consult with professional financial advisors before making any investment decisions. The author or publisher of this content bears no responsibility for any actions taken based on the information provided or for any resultant financial or other losses.