Meme Coins: Gambling or Genius? The Untold Psychology!Hello Traders!
From Dogecoin to Shiba Inu to PEPE, meme coins have turned ordinary investors into overnight millionaires… and just as quickly, wiped them out.
But behind all the hype, memes, and moonshots, lies a deeper question:
Are meme coins pure gambling, or is there actually a kind of genius hidden inside this madness?
Let’s explore the real psychology that drives the meme coin phenomenon and what it teaches us about market behavior.
1. The Allure of “Quick Rich” Dreams
Meme coins sell emotion, not utility. They trigger the most powerful desire in human nature, the dream of instant wealth.
Traders jump in not because of fundamentals, but because of FOMO (Fear of Missing Out).
When people see others getting rich on Twitter or Telegram, logic disappears, replaced by hope and greed.
Meme coins don’t just trade on charts; they trade on human emotion.
2. The Hidden Genius of Community Psychology
While most treat meme coins as jokes, their creators understand one truth, markets move on attention .
Every meme coin is a masterclass in viral marketing.
They combine humor, belonging, and financial dreams, creating powerful communities that believe, promote, and act together.
It’s not fundamentals, it’s faith.
And when millions believe at the same time, even a joke becomes valuable, at least for a while.
3. The Bubble Psychology – Why It Repeats
Each meme coin cycle starts the same: early adopters accumulate silently.
Then comes the hype wave, influencers, trends, and social media buzz.
Late buyers rush in, liquidity explodes, and eventually, the supply outpaces the demand.
Finally, prices collapse, but the story repeats with a new name next month.
Humans never learn because our emotions never evolve. The pattern stays the same, only the logos change.
4. Genius or Gambling – The Thin Line
If you treat meme coins as “investments,” you’re gambling.
But if you treat them as short-term speculative plays with strict risk limits, you’re being strategic.
The key difference is not in the coin, it’s in your mindset.
Even BNF-level discipline can’t save someone trading emotionally in meme markets.
The real genius is not in predicting the next PEPE, it’s in managing risk when emotions run wild.
Rahul’s Tip:
Meme coins reveal more about human behavior than any economic theory ever will.
If you can understand why people chase hype, and control the urge within yourself, you’ll already be ahead of 90% of traders.
Conclusion:
Meme coins are not just digital jokes, they are mirrors reflecting our collective greed and hope.
They remind us that markets are not rational, they are emotional.
In the end, whether meme coins make you rich or broke depends less on the coin, and more on your ability to stay grounded while everyone else loses control.
If this post gave you a new perspective on meme coins, like it, share your view in comments, and follow for more deep trading psychology insights!
Community ideas

What is Run Gain Potential and how do you use itToday's tutorial is about Run Gain Potential and how to calculate it for daily candles and intraday minute candles. It is a very important part of determining how far a stock can run, whether the run gain has sufficient points for good profits, and whether or not the run gain potential is shrinking over time, a common warning that instead of a minor retracement a correction either sideways or down is over due. Retracements and corrections are normal and necessary to maintain the integrity of the upward trend.
Also Run Gain Potential tells you where to place your stop losses. Using percentage stop losses instead of support appropriate for your trading style is the most common reason why retail traders stop losses are taken too soon.

Understanding Margin & Mechanics in Futures MarketsBefore you trade Futures, it’s essential to understand how these markets operate, especially how margin, leverage, and settlement work. This insight helps you manage risk, stay capital-efficient, and avoid unnecessary surprises.
Margin Basics
Every future position requires margin. It’s important to note margin is not an added cost per contract, margin is a good-faith deposit or can be thought of as a “performance bond” to ensure you can meet your obligations. There are three main types:
Initial Margin: The exchange sets this as a percentage of the contract’s notional value based on a wide variety of factors including volatility, size of the contract, and average market movement.
Maintenance Margin: The minimum balance required to keep your position open. If your balance drops below this, you’ll get a margin call.
Day Trading Margin: Set by your broker, often a fraction of the exchanges Initial Margin. Day Trading margins can provide more leverage, but in turn this comes with more risk.
Leverage in Action
Futures are leveraged products. With just a small amount of capital, you can control a much larger position. For example, with the E-mini S&P 500 trading at 6800, one contract has a notional value of $50 x 6800 = $340,000. We illustrate this below using initial margin and day margins examples.
Leverage using Initial Margin:
Leverage = Notional Value / Initial margin required
Example:
For 1 Long ES contract, with initial margin $23429.
Leverage = 340,000 /23429
Leverage = 14.5x
Leverage using Day Trading Margin:
Leverage = Notional Value / Day margin required
For 1 Long ES contract, with day margin at $1000.
Leverage = 340,000/1000
Leverage = 340x
**As the notional value rises or falls, so does leverage. Leverage is a double-edged sword it can work for you and against you. Higher leverage increases the risk of gains as well as losses.
Depending on your margin, you might only need a few thousand dollars to take that trade. While this enhances your buying power, it also increases risk, as losses could exceed your initial deposit.
Mark-to-Market & Daily Settlements
Futures are marked to market daily. This means your P&L is updated at the end of each session based on the day’s closing price. Gains are credited to your account, and losses are debited, helping to ensure real-time risk management and capital adequacy.
Physical vs. Cash Settlement
When a contract expires, there are two possible outcomes:
Physical Delivery: You receive or deliver the actual commodity.
Example: An oil producer secures a price of $62.00 per barrel through a long futures position. At contract expiration, the producer is obligated to take delivery of 1,000 barrels, which represents $62,000 in total value. If market prices rise to $80.00 per barrel, the producer can sell the physical oil at an $18.00 per barrel gain (before accounting for commissions and futures and other related fees).
Cash Settlement: No goods change hands, and your account is adjusted based on the final settlement price set by the exchange. This is common in financial contracts like the E-mini S&P 500 (ES).
Understanding margin and leverage is fundamental to trading futures effectively. These mechanics define how much risk you’re taking, how your capital is allocated, and how your account is managed daily.
At EdgeClear, our mission is to help traders develop a deeper understanding of the markets and the tools that move them. Follow us on TradingView for more Trade Ideas like this one, or connect with our team to learn how you can trade futures with confidence, precision, and the right guidance.
Generals Charge, Soldiers Stall: Reading Bearish Divergence1. Context: The Battle Line Between Large and Small Caps
This week’s futures landscape paints a striking contrast between leadership and hesitation. In the CME equity index universe, the large caps — ES (E-mini S&P 500), NQ (E-mini NASDAQ 100), and YM (E-mini Dow Jones) — advanced as a united front, all opening above their prior week’s highs. The market generals were charging confidently uphill.
Yet, on the same battlefield, the RTY (E-mini Russell 2000) lagged behind. The small caps failed to take out the prior week’s high and opened below the aggressive gaps that marked their larger counterparts. In trader terms, breadth was narrowing. In storyteller terms, the generals were calling “forward!” — but the soldiers weren’t following.
Such divergences in participation often mark transition zones in market psychology. When large caps push while small caps stall, it doesn’t necessarily mean the campaign is lost — but it does mean confidence among the broader troops is weakening.
2. Reading the Divergence: When Breadth Narrows
The relationship between large-cap and small-cap indices often reveals more than just price action — it exposes the structure of conviction. In sustained bullish environments, small caps tend to lead or at least confirm the move. Their participation signals that risk appetite is healthy across the field, not confined to the biggest names.
When that breadth fades, the advance becomes fragile. A rally driven only by mega-cap components (the generals) can stretch further, but with decreasing participation, it becomes increasingly vulnerable to shocks. Traders who watch intermarket behavior know this phenomenon as bearish divergence — higher highs in the generals, lower or flat highs in the soldiers.
From a practical standpoint, narrowing breadth implies that fewer sectors are carrying the index higher. In other words, the market’s engine is running on fewer cylinders. This is not a timing trigger on its own, but it is a powerful contextual clue suggesting that volatility could expand when the leadership stumbles.
3. Quantifying the Risk: Supports and Market Depth
Looking beneath price, Order Flow (UnFilled Orders) provides a sense of where liquidity may reside once the current rally pauses. Key UFO support zones, acting as potential demand clusters, reveal how far the market might travel before encountering fresh buy interest.
From this week’s open:
ES shows its next support roughly 5.26% below current levels.
NQ sits around 6.25% below.
YM’s cushion lies approximately 9.39% beneath.
RTY, however, faces a much deeper air pocket — the next notable UFO support sits nearly 13.99% lower.
This asymmetry is critical. If markets retreat, small caps have the most unprotected downside terrain before reaching meaningful support. In other words, the generals may fall back a few miles, but the soldiers could tumble down the hill.
These percentages don’t guarantee a move — they outline the potential amplitude of correction if risk-off flows accelerate. The deeper the distance to support, the larger the volatility zone beneath.
4. Strategic View: Large Caps Lead, but Are They Overextended?
The current setup puts traders in a classic tactical dilemma:
Are the generals inspiring a new advance, or are they overextended and exposed?
Two plausible scenarios emerge:
Continuation scenario: If the small caps (RTY) regain strength and take out their prior week’s high, the breadth gap could close. This would validate the generals’ move and reestablish a broad-based advance.
Correction scenario: If RTY continues to stall while ES, NQ, and YM fail to sustain their gaps, it would confirm a divergence-led weakening. A close back below prior week’s highs could trigger a retreat toward the support zones identified earlier.
The idea is not to predict a reversal, but to prepare a framework in case weakness unfolds.
5. Contract Overview: E-mini and Micro Versions
To analyze or engage these markets, traders can study both E-mini and Micro E-mini contracts listed on the CME. These contracts represent standardized ways to participate in U.S. equity index movements, but at different notional sizes.
E-mini contracts (ES, NQ, YM, RTY) are the long-standing institutional benchmark instruments that track major U.S. equity indices with efficient liquidity and tight spreads.
Micro E-mini contracts (MES, MNQ, MYM, M2K) provide the same exposure pattern at one-tenth the size, offering more granularity in risk management and flexibility for smaller accounts or precise hedging.
It’s important to understand that these futures allow directional and hedging applications without requiring ownership of the underlying equities. However, as with any leveraged product, margin requirements can amplify both gains and losses. Traders should familiarize themselves with margin-to-equity ratios and maintenance requirements before participation.
S&P 500 – ES / MES
Minimum tick: 0.25 points
Tick value: $12.50 (E-mini) | $1.25 (Micro)
Typical margin: ≈ $21K (E-mini) | ≈ $2.1K (Micro)
NASDAQ 100 – NQ / MNQ
Minimum tick: 0.25 points
Tick value: $5.00 (E-mini) | $0.50 (Micro)
Typical margin: ≈ $30K (E-mini) | ≈ $3.0K (Micro)
Dow Jones – YM / MYM
Minimum tick: 1 point
Tick value: $5.00 (E-mini) | $0.50 (Micro)
Typical margin: ≈ $13K (E-mini) | ≈ $1.3K (Micro)
Russell 2000 – RTY / M2K
Minimum tick: 0.10 points
Tick value: $5.00 (E-mini) | $0.50 (Micro)
Typical margin: ≈ $9K (E-mini) | ≈ $0.9K (Micro)
Please note that all margin requirements are approximate and may be adjusted.
6. Risk Management Spotlight
Breadth divergences can test patience and positioning discipline. Managing exposure becomes as important as analyzing the signal itself.
Here are three core reminders:
Position Sizing: Adjust to volatility. If the distance to the nearest support is wide, scale down accordingly to maintain a consistent risk percentage per trade.
Stop-Loss Discipline: Predetermine exit points based on technical invalidation, not emotion.
Capital Preservation: Capital is ammunition; running out of it limits participation when true opportunity returns.
In the end, risk management isn’t about avoiding loss; it’s about surviving long enough to thrive when clarity returns. When markets are divided between generals and soldiers, maintaining balance becomes a trader’s greatest edge.
7. Educational Takeaway
The “generals vs. soldiers” analogy reminds us that market structure is not just about price—it’s about participation. When large caps surge but small caps lag, it signals a potential exhaustion point in the broader advance. The healthiest rallies are those in which all troops move in sync.
For traders and investors, breadth divergences serve as an early-warning system, not a countdown clock. They encourage a review of exposure, tighter stop placement, and a shift toward risk-awareness rather than return-chasing.
At this stage, the technical setup across U.S. index futures reads like a fragile truce: ES, NQ, and YM maintain their gains above prior-week highs, while RTY still lingers below. Should the soldiers eventually follow, confidence could rebuild. But if the generals start retreating first, the path toward their UFO supports could unfold quickly.
The core takeaway: breadth divergences don’t predict timing—they illuminate imbalance. Recognizing that imbalance early allows traders to respond intelligently instead of react emotionally when volatility expands.
When charting futures, the data provided could be delayed. Traders working with the ticker symbols discussed in this idea may prefer to use CME Group real-time data plan on TradingView: www.tradingview.com - This consideration is particularly important for shorter-term traders, whereas it may be less critical for those focused on longer-term trading strategies.
General Disclaimer:
The trade ideas presented herein are solely for illustrative purposes forming a part of a case study intended to demonstrate key principles in risk management within the context of the specific market scenarios discussed. These ideas are not to be interpreted as investment recommendations or financial advice. They do not endorse or promote any specific trading strategies, financial products, or services. The information provided is based on data believed to be reliable; however, its accuracy or completeness cannot be guaranteed. Trading in financial markets involves risks, including the potential loss of principal. Each individual should conduct their own research and consult with professional financial advisors before making any investment decisions. The author or publisher of this content bears no responsibility for any actions taken based on the information provided or for any resultant financial or other losses.

Japan’s Nikkei 225 Creates HistoryThe global stock markets are soaring.
- This time, the update comes from Japan
- Japan’s Nikkei 225 surges above 50,000 (50,447.50) for the first time in history.
- Japan’s stock market is now up around 65% since the April 2025 low.
- Japan 225 has remained quite volatile over the past couple of years
- From April 2024 to April 2025, it fell by ~25%
- Then rallied 65% in less than 10 months.

Indicators and Trading Signals — How It WorksWhen you first start trading, indicators feel like the secret sauce.
RSI, MACD, EMA, Volume every line promises to reveal what the market will do next.
You start stacking them like LEGO blocks, thinking more confirmation = more accuracy.
But here’s the hard truth: indicators don’t predict they react.
The real skill isn’t using more of them, it’s knowing when to listen and when to ignore.
The Role of Indicators
Indicators are tools, not magic formulas.
They exist to translate price action into structure. That’s it.
RSI tells you about momentum.
Volume shows commitment.
Moving averages reveal trend direction.
Volatility indicators show risk zones.
The power isn’t in the tool itself, it’s in how consistently you interpret it.
That’s why two traders can look at the same RSI line and do completely opposite things.
The Trap: Signal Hunting
Every trader falls into this phase: jumping from one setup to another, waiting for that “perfect signal.”
The problem?
There isn’t one.
Even the best indicators will fail if your execution and mindset aren’t aligned.
Signals don’t make money! Systems do.
Systems combine momentum, volume, volatility, and trend logic, so signals confirm each other, not contradict.
Signal vs Execution
Let’s be real, getting a signal is the easy part.
Following it correctly is where most traders fall apart.
You get a buy signal… but wait for “one more candle.”
You see a sell alert… but hold, just in case it bounces.
You close early because “it already moved enough.”
That’s why automation matters.
It doesn’t second-guess, it executes.
From Noise to System
If your screen looks like a Christmas tree of indicators, you’re not trading, you’re guessing.
Clean it up.
Pick a few tools that complement each other, build rules around them, and stick to those rules.
That’s how professionals think: less emotion, more structure.
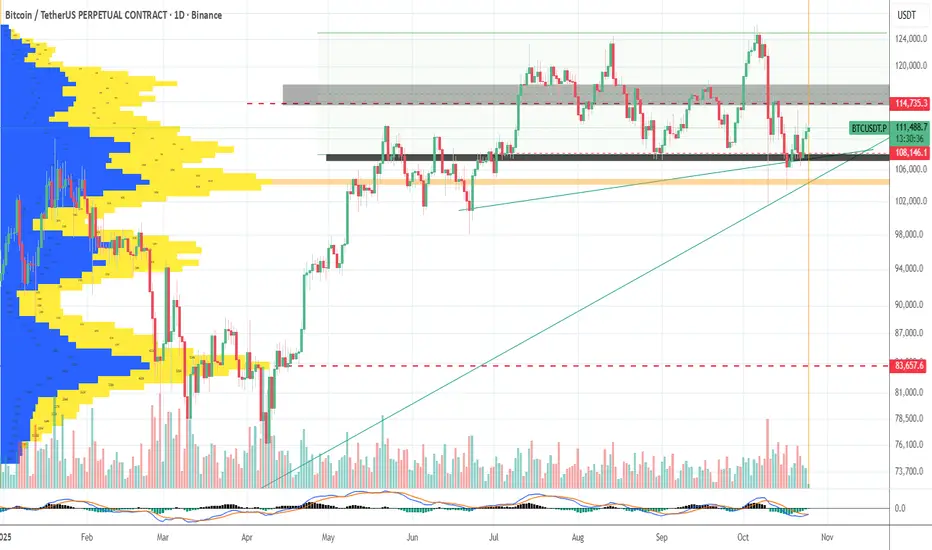
The Next Explosion, Hidden Clues in Price BehaviorCan you really feel the next Bitcoin explosion just by reading the charts?
The market looks calm, but deep down something big is shifting.
When everyone expects a crash, history shows that’s when the biggest moves begin.
Hello✌️
Spend 2 minutes ⏰ reading this educational material.
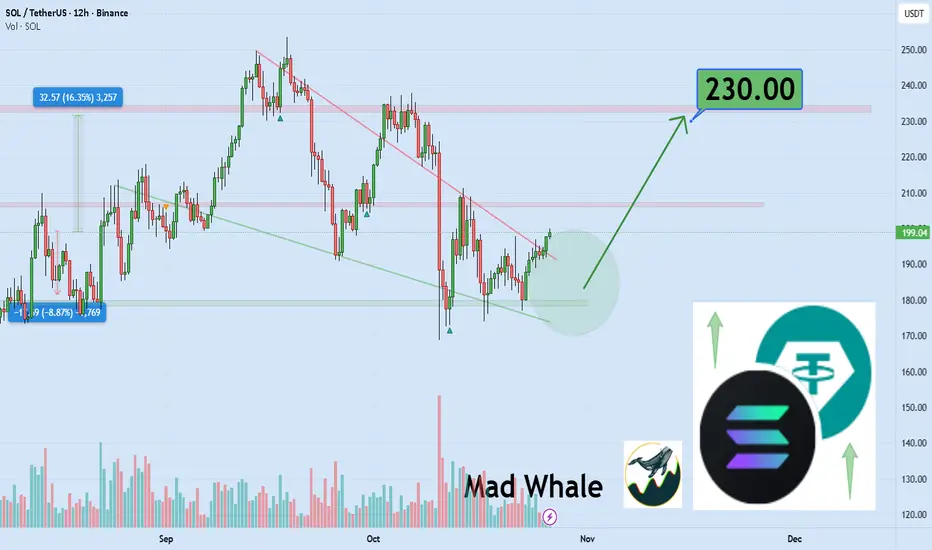
🎯 Analytical Insight on Solana:
BINANCE:SOLUSDT is testing a key daily support; holding this zone could spark a 16% rally, targeting $230. 📈🛡️
Now , let's dive into the educational section,
🌋 The Calm Before the Storm
The crypto market is like the ocean before a tsunami quiet but full of hidden energy. On higher timeframes, candles look small and boring, yet trading volume is rising. That mix of silence on the surface and pressure underneath is exactly what happens before every strong bull run.
💡 Hidden Clues in Price Behavior
Bitcoin’s price has been building quiet support for weeks, while big transactions are slowly increasing in the background. This usually means that smart investors are buying without drawing attention. Rising volume with little price movement is often the first signal that accumulation has started.
🚀 Bitcoin The Engine of the Next Explosion
In every cycle, Bitcoin moves first. Breaking major resistance levels and holding above them is a sign of growing confidence. When Bitcoin dominance starts to drop and altcoin volume goes up at the same time, that’s when the whole crypto market gets ready for a collective takeoff.
🧠 Trader Psychology During Market Silence
Most traders fear a quiet market, but experienced ones see it as the best setup. When the media talks about stagnation and panic, the big players are quietly building long positions. The difference between average and professional traders is simple: one sees silence as danger, the other as opportunity.
🔍 The Path to Spotting the Next Big Move
To catch the move early, start with volume. When volume rises at support levels without breaking previous lows, it usually means smart money is buying. A positive divergence between price and RSI often appears right before momentum flips. Then watch for a bullish MACD cross on the daily chart when all three signals align, the explosion is close.
⚙️ TradingView Tools That Reveal Market Explosions
TradingView offers powerful tools that can help you detect big moves before they happen.
1. Volume Profile
Shows where most buying and selling happened. Heavy zones are usually where whales make their decisions.
2. MACD
Reveals when market momentum is changing direction. A bullish cross in the negative zone often signals the start of a reversal.
3. RSI
Measures the strength of buyers versus sellers. When RSI breaks above 50, a new bullish phase is often beginning.
4. Alert System
Highly underrated! Set alerts for your favorite indicators so when they align, you get notified instantly.
5. Multi-Timeframe Analysis
Use multiple timeframes to avoid fake signals. Comparing daily and 4-hour charts gives a much clearer picture of big moves.
⚡ Summary
All signs point to a massive move ahead. Bitcoin’s calmness is deceiving, but the data doesn’t lie. Stay patient, follow your signals, and you might witness one of the strongest uptrends in years.
🧭Golden Tips for Smart Traders
Patience beats excitement. The biggest profits go to those who wait for confirmation, not those who rush in
Ignore the crowd’s emotions. When the mood is darkest, opportunities are often the brightest.
Trust the chart, not your fear. The market always tells the truth if you take the time to listen.
✨ Need a little love!
We pour love into every post your support keeps us inspired! 💛 Don’t be shy, we’d love to hear from you on comments. Big thanks, Mad Whale 🐋
📜Please make sure to do your own research before investing, and review the disclaimer provided at the end of each post.
+++This issue stems from a very specific issue in TradingView: When you make the chart "view-only" (i.e., viewable via a share link), the chart data can stream live, but the indicators' runtime engine is disabled.
I'll explain in detail below why this happens and how to fix it.

How Takashi Kotegawa (BNF) Turned $15,000 into $160 Million!Hello Traders!
Every trader dreams of freedom, to make money from anywhere, without bosses, without limits.
But very few turn that dream into reality. One man did, quietly, with no show-off, no team, no hype, just discipline.
His name is Takashi Kotegawa , known as BNF , and his journey remains one of the greatest stories in trading history.
He didn’t chase the market. He observed it, studied it, and understood the mind behind every candle.
This is not just the story of how he made millions, it’s the story of how he mastered himself.
1. The Beginning, A Trader With No Mentor, No Plan, and Just a Dream
BNF started with about ¥1.6 million (around $15,000) in early 2000s Japan, when markets were highly volatile after the dot-com crash.
He had no formal financial education, no teacher, no fancy tools, just curiosity and the internet.
His small Tokyo apartment became his world, one desk, one screen, and endless observation.
In interviews, he said he began by watching how prices moved during panic and euphoria.
He wasn’t trying to predict the future, he was trying to understand human behavior.
“People repeat the same mistakes in the market, every single day. Once you understand that, you don’t need predictions.”
2. His Core Belief, Trading Is 80% Psychology, 20% Logic
BNF believed that markets don’t move on information, they move on emotion.
He often said the real skill is not in finding the next big stock, but in controlling your reactions when others lose theirs.
He avoided leverage because he didn’t want fear to control his decisions.
He didn’t follow gurus or predictions, he trusted data and patterns.
He didn’t chase “profit goals”, he focused on protecting his capital and mental stability.
He treated trading as a mental battlefield , not a money machine.
For him, staying emotionally calm was more valuable than catching a big move.
“Once you lose emotional control, the game is over.”
3. His Strategy, Buy Panic, Sell Relief
BNF’s entire strategy was built around human emotion .
He didn’t try to predict, he reacted when the crowd lost balance.
He studied every panic, company news, bad results, crashes, and identified when fear was overdone.
He looked for stocks that fell due to market-wide panic, not because of real problems.
He entered when the crowd had already given up, when fear turned into despair.
He exited when confidence came back, before greed took over again.
This was not just a “buy-the-dip” idea. It was about understanding how emotions cycle, fear, denial, hope, greed, and where to position himself.
He once said, “When people are scared to buy, I buy. When people feel safe, I sell.”
That single sentence explains his entire philosophy.
4. The Livedoor Shock, His Defining Moment
In 2006, Japanese markets were hit by the Livedoor scandal .
Stocks crashed violently, retail traders panicked, and brokers were flooded with sell orders.
But while everyone else was frozen in fear, BNF saw an opportunity.
He noticed fundamentally strong companies dropping for no reason other than panic.
He quietly started buying in small quantities as the market collapsed.
In just a few weeks, as panic faded, his portfolio exploded in value.
That single event turned him from a small trader into a millionaire.
But even after making that money, he didn’t change his routine, same room, same computer, same focus.
“My life doesn’t need luxury. My satisfaction comes from mastering myself.”
5. His Daily Routine, The Discipline Behind the Calm
BNF treated trading like a profession, not a gamble.
He started his day by reviewing past trades, not charts.
He noted where he got emotional, not where he lost money.
He avoided media and noise, no financial TV, no social chatter.
He kept his body healthy and avoided stress, because he believed mental sharpness required physical balance.
His trading was so precise that he could go days without taking a trade.
For him, “No trade is also a trade.”
He believed the market rewards patience, not activity.
6. Why He Never Lost Control, The Philosophy of Detachment
BNF viewed money as a tool, not a goal.
He said that once you start trading “for money,” you lose clarity.
Money was the byproduct of good decision-making, not the purpose of it.
He never celebrated big wins.
He never took revenge trades after losses.
He kept emotions flat, whether profit or loss, his behavior stayed the same.
This is what made him different.
Most traders rise and fall emotionally with every tick, he remained centered, observing the storm instead of becoming part of it.
“If I get too happy or too sad, I stop trading. That means I’ve lost control.”
7. The Lessons BNF Left for Every Trader
Trading is a psychological war, not a mathematical one.
Numbers don’t matter if your emotions control your decisions.
Capital protection is your first profit.
He never let ego force him to risk everything for quick gains.
Patience is the real edge.
He could wait for days for the perfect entry, and strike once without hesitation.
Ignore the noise.
He didn’t care what analysts said or where the market “should” go. He traded what he saw, not what he hoped.
BNF proved that consistency and calmness beat every advanced strategy.
Rahul’s Tip:
You don’t need to trade like BNF to be successful, but you can learn to think like him.
Your biggest goal in trading should be to master your reactions, not predict the market.
Money will follow when you stop chasing it.
Conclusion:
Takashi Kotegawa, the man the world calls BNF, didn’t just make $160 million.
He made something more powerful, he achieved peace in chaos.
He showed that trading is not about defeating others, it’s about defeating your own impulses.
His legacy is proof that in markets, patience is the ultimate power, and silence is the greatest strategy.
If this story inspired you to slow down, think deeper, and trade wiser, like it, comment your thoughts, and follow for more lessons from legends.

My Steps On how To Improve Forex Trading Win / Loss Ratio In this video we talk about the three elements of the new plan that I have designed based on different types of schools and educational sources.
The plan elements consist of SMC (Smart Money Concepts), Classical School (Support & Resistance, Trend Lines, Febonacci Retracement (not all the time)), and the Stochastic Indicator.
The stochastic is of two timeframes, One is weekly and the other is daily but both are shown on the daily timeframe. This is something that I loved here about TradingView; is the ability to show an indicator of a different timeframe.
Last week I opened a couple of positions based on the new plan, but one of them was opened with haste and not totally adhered to my trading Plan rules.
I show the exact trading rules that I am using and how this will affect my risk management plan.

Global Trade and Its Impact on Currency ShiftsIntroduction
In the complex web of global economics, trade and currency movements are inseparably linked. The value of a nation’s currency is not determined in isolation but reflects the balance of its trade relationships, capital flows, and macroeconomic conditions. Global trade—comprising exports, imports, and cross-border investments—plays a crucial role in determining currency demand and supply. When trade flows shift due to policy changes, geopolitical developments, or technological advancements, they often trigger corresponding movements in currency values.
This essay explores how global trade impacts currency shifts by examining trade balances, exchange rate mechanisms, capital flows, commodity cycles, and geopolitical factors. It also delves into how trade-driven currency shifts affect economies, businesses, and global financial stability.
1. The Link Between Trade and Currency Value
At its core, global trade affects currency through demand and supply dynamics. When a country exports goods or services, foreign buyers must purchase its currency to pay for those exports. This increases demand for the exporter’s currency, leading to appreciation. Conversely, when a country imports more than it exports, it must convert its currency to buy foreign goods, increasing the supply of its currency in global markets and potentially leading to depreciation.
For example, when global demand for German automobiles or Japanese electronics rises, the euro and yen often strengthen because international buyers must acquire those currencies to pay for imports. Similarly, when the United States runs persistent trade deficits, the U.S. dollar experiences downward pressure—although it often remains strong due to its status as the world’s reserve currency.
In short, trade balances—exports minus imports—directly influence currency demand and valuation.
2. Trade Balances and Exchange Rates
A nation’s current account balance is a key determinant of long-term exchange rate movements. The current account includes trade in goods and services, net income from abroad, and net transfer payments. A trade surplus indicates more exports than imports, leading to net foreign currency inflows and upward pressure on the domestic currency. A trade deficit has the opposite effect.
Example: The U.S. Dollar and Trade Deficit
Despite running consistent trade deficits, the U.S. dollar remains relatively strong due to high global demand for U.S. assets, Treasury securities, and the dollar’s dominance in international trade settlements. However, persistent deficits can create structural vulnerabilities, particularly if foreign investors lose confidence in U.S. fiscal sustainability.
Example: China’s Trade Surplus and Yuan Stability
China’s consistent trade surpluses, driven by its manufacturing exports, have historically supported the yuan (renminbi). Although China manages its currency through capital controls and intervention, its export-led model generates strong foreign exchange inflows that support currency stability.
Thus, trade balances serve as a key long-term anchor for currency valuation, even as short-term movements may be driven by speculation and interest rate differentials.
3. Exchange Rate Regimes and Trade Impacts
Exchange rate systems also shape how global trade affects currencies. Broadly, exchange rate regimes can be divided into floating, fixed, and managed float systems.
Floating Exchange Rates (e.g., U.S., U.K., Japan): Market forces of supply and demand determine currency value. Trade imbalances quickly translate into currency shifts.
Fixed Exchange Rates (e.g., Gulf nations pegged to USD): Governments or central banks maintain a fixed value against another currency. Trade impacts are mitigated through central bank intervention.
Managed Float (e.g., China, India): Authorities allow market forces some role but intervene periodically to stabilize the currency.
In floating systems, an increase in exports strengthens the currency, which can eventually make exports less competitive—a self-correcting mechanism. In contrast, countries with fixed exchange rates must adjust through monetary or fiscal policy rather than currency depreciation.
4. Capital Flows and Trade-Linked Currency Movements
Global trade and capital flows are two sides of the same coin. A country running a trade surplus typically becomes a net lender to the rest of the world, investing its excess savings abroad. Conversely, a trade-deficit country must borrow or attract capital inflows to finance its deficit.
This dynamic influences currency movements through the financial account of the balance of payments. For instance:
If a country imports more than it exports, but foreign investors purchase its bonds, equities, or real estate, the inflow of foreign capital can offset currency depreciation.
However, if capital inflows dry up due to political or economic instability, the currency can weaken sharply, as seen during the Asian Financial Crisis (1997–1998), when several Southeast Asian currencies collapsed following rapid capital flight.
Therefore, trade imbalances often lead to corresponding capital flow adjustments that can amplify or counteract currency shifts.
5. Commodity Prices and Terms of Trade
Commodity-dependent economies are highly sensitive to global trade trends and price cycles. When the prices of key exports—like oil, metals, or agricultural goods—rise, commodity exporters’ currencies appreciate, while importers’ currencies depreciate.
Case Study: The “Petro-Currency” Effect
Currencies of oil-exporting nations like Saudi Arabia, Russia, and Canada tend to strengthen when oil prices rise because global buyers must purchase their currencies to pay for energy imports. Conversely, when oil prices fall, these currencies often weaken, reflecting reduced export revenues.
Terms of Trade (ToT)
The terms of trade—the ratio of export prices to import prices—also affect currency value. An improvement in ToT means a country can purchase more imports for the same amount of exports, increasing demand for its currency. For instance, Australia’s dollar (AUD) tends to appreciate when global iron ore and coal prices rise, improving its ToT.
6. Trade Policies and Tariffs
Trade policies, tariffs, and trade agreements directly influence currency movements. When countries impose tariffs, restrict imports, or provide export subsidies, they alter trade flows and thereby currency demand.
Protectionist measures can strengthen domestic currency temporarily if they reduce imports, but over time they may harm competitiveness and productivity, leading to depreciation.
Free trade agreements (FTAs) can stimulate exports and foreign investment, strengthening the domestic currency.
For example, the signing of the North American Free Trade Agreement (NAFTA) increased trade between the U.S., Canada, and Mexico, supporting the Mexican peso and Canadian dollar through higher trade inflows.
7. Geopolitical Events and Global Supply Chains
Geopolitical tensions—wars, sanctions, or trade conflicts—often disrupt global trade flows and cause currency volatility. Trade sanctions can restrict export markets, reduce foreign currency inflows, and weaken affected nations’ currencies.
The Russia-Ukraine conflict (2022–) provides a striking example. Western sanctions reduced Russian exports to Europe, weakening the ruble temporarily, though capital controls later stabilized it. Meanwhile, European currencies like the euro were pressured by surging energy import costs.
The COVID-19 pandemic also exposed the fragility of global supply chains. Trade disruptions caused sharp fluctuations in currencies, particularly in emerging markets dependent on exports of manufactured goods or commodities.
8. The Role of Trade Deficits and Surpluses in Global Imbalances
Persistent trade surpluses and deficits create global financial imbalances that can drive long-term currency misalignments. Countries like China, Germany, and Japan often run large surpluses, accumulating foreign reserves and exporting capital. The U.S., on the other hand, runs chronic deficits financed by foreign investment in U.S. assets.
These imbalances influence global currency trends:
Surplus countries accumulate foreign exchange reserves, often investing them in U.S. Treasury bonds, which supports the dollar.
Deficit countries face currency depreciation risks if investor confidence wanes.
Efforts to rebalance global trade, such as by encouraging domestic consumption in surplus countries or reducing dependence on imports in deficit nations, are central to achieving currency equilibrium.
9. Central Bank Intervention and Trade Dynamics
Central banks often intervene in currency markets to stabilize exchange rates and protect trade competitiveness. For example:
The People’s Bank of China (PBoC) actively manages the yuan to maintain export competitiveness.
The Swiss National Bank (SNB) has intervened to prevent excessive appreciation of the Swiss franc, which could hurt exports.
The Bank of Japan (BoJ) frequently monitors the yen’s strength, as a strong yen can undermine Japan’s export-led economy.
Such interventions can take the form of buying/selling foreign currency reserves, adjusting interest rates, or implementing capital controls.
However, excessive intervention can attract criticism of “currency manipulation,” as seen in U.S.-China trade tensions during the 2010s.
10. The Dollar’s Dominance and Global Trade
The U.S. dollar’s dominance in international trade settlements has a unique impact on global currency dynamics. Most commodities, including oil and gold, are priced in dollars, creating constant global demand for USD regardless of America’s trade balance.
This “exorbitant privilege” allows the U.S. to run persistent deficits while maintaining a strong currency. However, as more nations explore de-dollarization—conducting trade in local or regional currencies—the long-term structure of global currency demand could shift.
Emerging blocs like BRICS are actively exploring alternatives to the dollar, which, if realized, could lead to a more multipolar currency system and alter global trade-currency relationships.
11. Technological and Structural Shifts in Trade
Technological advancements, such as digital trade, automation, and supply chain diversification, also influence currency trends. For instance:
Digital trade platforms reduce transaction costs, increasing global capital mobility and influencing forex markets.
Reshoring and nearshoring production—seen after COVID-19—alter traditional trade balances, thereby impacting currencies.
E-commerce exports by small and medium enterprises are increasing foreign exchange inflows in emerging economies.
Moreover, innovations like blockchain and central bank digital currencies (CBDCs) could reshape how global trade is settled, potentially reducing dependence on traditional reserve currencies and changing how trade flows affect exchange rates.
12. Long-Term Implications of Trade-Driven Currency Shifts
Global trade’s influence on currency shifts extends far beyond financial markets—it affects inflation, employment, investment, and overall economic stability.
Currency Appreciation: Makes imports cheaper, reducing inflation but potentially harming export competitiveness.
Currency Depreciation: Boosts exports but raises import costs, potentially fueling inflation.
Volatility: Frequent currency fluctuations can complicate long-term business planning, investment decisions, and government policy-making.
Therefore, nations strive for a balanced trade and exchange rate policy—neither excessive appreciation nor chronic depreciation—to maintain competitiveness and price stability.
Conclusion
Global trade remains one of the most powerful forces shaping currency values. Trade balances, commodity cycles, capital flows, and geopolitical developments all contribute to how currencies move in global markets. A country’s ability to manage these forces—through prudent macroeconomic policies, diversified trade relationships, and stable political governance—determines its currency’s resilience.
As globalization evolves and new trade patterns emerge, currency dynamics will continue to adapt. The rise of regional trade blocs, digital currencies, and de-dollarization movements may gradually reshape how global trade impacts currencies in the 21st century. Yet, the fundamental principle remains unchanged: trade is the lifeblood of currency demand, and currency shifts are the mirror reflection of a nation’s position in the global economic system.
Forex Options TradingIntroduction
Forex options trading is one of the most sophisticated and flexible instruments available in the global foreign exchange (FX) market. It allows traders and institutions to hedge currency exposure, speculate on exchange rate movements, and diversify portfolio risk. Unlike the traditional spot forex market—where currencies are directly exchanged—forex options provide the right but not the obligation to buy or sell a currency pair at a predetermined rate before a specific date.
Forex options trading has gained immense popularity among institutional traders, hedge funds, and advanced retail investors due to its ability to manage risk, amplify returns, and create structured payoff profiles. Understanding how forex options work, their mechanics, strategies, and advantages is crucial to navigate this dynamic part of the financial landscape.
What Are Forex Options?
A forex option (FX option) is a derivative contract that gives its holder the right—but not the obligation—to exchange one currency for another at a fixed exchange rate (called the strike price) on or before a specified date (expiration date).
There are two primary types of options:
Call Option – Gives the trader the right to buy a currency pair at the strike price.
Put Option – Gives the trader the right to sell a currency pair at the strike price.
The buyer of the option pays a premium to the seller (writer) for this right. If the market moves in favor of the holder, the option can be exercised for a profit; if not, the holder can let it expire, losing only the premium paid.
How Forex Options Differ from Spot Forex
In spot forex trading, two currencies are exchanged at the current market price, with profit or loss depending on the movement of the exchange rate. The exposure is direct and continuous.
In forex options trading, however:
Traders are not required to take delivery of the currency.
The potential loss is limited to the option premium.
It offers more flexibility through combinations and strategies.
For example, a trader expecting the EUR/USD to rise may buy a call option instead of buying EUR/USD directly. If the market moves upward, the option gains value; if it falls, the trader’s maximum loss is limited to the premium.
Key Terms in Forex Options Trading
Strike Price: The exchange rate at which the currency pair can be bought or sold.
Expiration Date: The date when the option contract expires.
Premium: The cost paid to purchase the option.
In the Money (ITM): When exercising the option results in profit.
Out of the Money (OTM): When exercising the option would result in a loss.
At the Money (ATM): When the spot rate equals the strike price.
Notional Value: The total value of the underlying currency represented by the option.
Types of Forex Options
1. Vanilla Options
These are the standard call and put options. They have fixed strike prices, expiration dates, and predictable payoff structures. Most retail forex brokers offer these types of options.
Example: A trader buys a EUR/USD call option at 1.1000 expiring in 30 days. If EUR/USD rises to 1.1200 before expiration, the trader profits from the difference minus the premium.
2. Exotic Options
These are more complex instruments that have unique payoff structures and are primarily traded over the counter (OTC) by institutional participants.
Types include:
Barrier Options: Activated or deactivated when the currency hits a certain price level.
Digital (Binary) Options: Pay a fixed amount if the currency closes above/below the strike price.
Asian Options: Payoffs depend on the average exchange rate over a period.
Lookback Options: Payoff depends on the best or worst exchange rate during the life of the option.
Exotic options are useful for customized hedging and speculative strategies.
How Forex Options Work
Forex options operate through an agreement between two parties — the buyer (holder) and seller (writer). The process includes:
Selection of Currency Pair: For instance, EUR/USD or USD/JPY.
Choosing the Type: Call (buy) or Put (sell) option.
Setting Strike Price and Expiration: Determines at what level and for how long the option is valid.
Paying the Premium: The buyer pays an upfront cost to the seller.
Monitoring Market Movement: If the spot rate moves favorably, the option’s value increases.
Expiration or Exercise: The trader either exercises the option or lets it expire.
Example:
A trader buys a 1-month EUR/USD call option at 1.1000 for a premium of $200.
If the spot rate rises to 1.1200, the option is worth 200 pips, giving a profit (minus premium).
If EUR/USD falls below 1.1000, the option expires worthless, and the trader loses only $200.
Determinants of Option Premium
The price (premium) of an option depends on multiple factors:
Spot Price: Current exchange rate of the currency pair.
Strike Price: Difference between strike and spot influences value.
Time to Expiration: More time means higher premium (greater potential movement).
Volatility: Higher volatility increases option value since larger price swings raise potential profits.
Interest Rate Differential: The difference between the interest rates of the two currencies affects pricing.
Market Sentiment: Supply and demand dynamics influence option premiums.
These factors are mathematically modeled using the Garman-Kohlhagen model, an adaptation of the Black-Scholes model for forex options.
Advantages of Forex Options Trading
Limited Risk: Loss is limited to the premium, unlike spot forex where margin calls can occur.
Leverage and Flexibility: High potential returns with smaller capital outlay.
Hedging Tool: Protects against unfavorable currency moves for international investors or businesses.
Profit in Any Market Condition: Traders can profit in bullish, bearish, or neutral markets through strategic combinations.
No Margin Calls: Since the premium is paid upfront, traders are not exposed to margin requirements.
Diversification: Adds a non-linear component to portfolios, balancing risk.
Risks Involved
Premium Cost: Options can be expensive during volatile periods.
Time Decay (Theta): Option value decreases as expiration approaches.
Complexity: Advanced understanding is required to structure profitable trades.
Low Liquidity: Some exotic options or minor pairs may have limited buyers/sellers.
Over-the-Counter (OTC) Risks: Lack of regulation or standardization in OTC markets increases counterparty risk.
Forex Options Trading Strategies
1. Long Call
Objective: Profit from a rise in the currency pair.
Risk: Limited to premium.
Reward: Unlimited upside potential.
2. Long Put
Objective: Profit from a decline in the currency pair.
Risk: Premium only.
Reward: Significant if price drops below strike.
3. Straddle
Buy both a call and a put with the same strike and expiry.
Profits from large volatility in either direction.
4. Strangle
Buy OTM call and OTM put. Cheaper than straddle but needs larger movement.
5. Butterfly Spread
Combines multiple options to profit from low volatility conditions.
6. Protective Put (Hedging)
Used by exporters or importers to lock in currency rates and minimize loss.
For example, a U.S. company expecting payment in euros in three months might buy a EUR/USD put option to hedge against a euro depreciation.
Forex Options in Institutional Use
Large corporations and financial institutions use FX options for risk management and speculation:
Exporters and Importers hedge against unfavorable exchange rate movements.
Hedge Funds exploit volatility and market inefficiencies.
Banks use options to create structured products for clients.
Central Banks may use options for managing foreign reserves.
Institutions often trade exotic options, customized for their unique exposure, such as knock-in/knock-out options or dual-currency deposits.
Market Participants and Platforms
Forex options can be traded on:
Over-the-Counter (OTC) Markets: Customized contracts between banks, corporations, and institutional traders.
Exchange-Traded Platforms: Such as the Chicago Mercantile Exchange (CME) offering standardized options on currency futures.
Major participants include:
Commercial banks
Hedge funds
Corporations
Central banks
Retail traders (through brokers)
Regulations and Market Oversight
Forex options markets are regulated by national authorities to ensure transparency and prevent abuse:
U.S. – Commodity Futures Trading Commission (CFTC) and National Futures Association (NFA)
U.K. – Financial Conduct Authority (FCA)
Europe – European Securities and Markets Authority (ESMA)
India – Reserve Bank of India (RBI) and SEBI
Regulation ensures fair pricing, standardized reporting, and counterparty protection, especially in OTC contracts.
Example of a Real Trade
Suppose a trader expects the USD/JPY to appreciate from 150.00 to 152.00 within two weeks.
Strategy: Buy a USD/JPY call option at strike 150.00
Premium: 0.50 yen
Notional Amount: $100,000
If USD/JPY rises to 152.00, profit = (2.00 - 0.50) × $100,000 = $1,500.
If USD/JPY falls or stays flat, loss = premium paid = $500.
This flexibility illustrates how options protect traders from downside risk while maintaining upside exposure.
Future Trends in Forex Options Trading
Algorithmic and AI-Based Pricing Models: Improving precision in volatility forecasting and premium determination.
Retail Market Expansion: Brokers now offer simplified forex options to retail investors.
Blockchain and Tokenized Derivatives: Potentially increasing transparency and settlement efficiency.
Increased Regulation: Standardization of OTC markets to minimize systemic risk.
Integration with Decentralized Finance (DeFi): Smart contract-based forex options may revolutionize accessibility.
Conclusion
Forex options trading is a powerful instrument that combines elements of flexibility, risk management, and profit potential. By offering the right but not the obligation to execute trades, it enables both speculative and defensive positioning in the volatile global currency market. From multinational corporations hedging against currency risk to retail traders capitalizing on market volatility, forex options cater to a wide spectrum of participants.
However, success in forex options trading requires an understanding of market mechanics, volatility, and pricing dynamics. While the potential for gains is significant, improper use or lack of knowledge can lead to losses through expensive premiums or misjudged strategies.
Ultimately, forex options stand as a cornerstone of modern currency trading—providing unparalleled control over risk and reward in the global financial ecosystem.
Participants Coverage on the Global MarketIntroduction
The global financial market is a vast, interconnected ecosystem where capital flows across borders, industries, and asset classes. Every movement—whether in currencies, equities, bonds, or commodities—is influenced by a diverse set of participants. These market participants include institutional investors, retail traders, corporations, governments, and intermediaries such as brokers, exchanges, and regulators. Each plays a distinct role in ensuring market efficiency, liquidity, and stability. Understanding who these participants are, their objectives, and their impact on global markets is essential for comprehending how financial systems operate today.
1. The Structure of the Global Market
Before exploring the participants themselves, it’s important to understand the composition of the global market. Broadly, it consists of five major segments:
Equity Markets – Platforms where shares of companies are issued and traded. Examples include the New York Stock Exchange (NYSE), London Stock Exchange (LSE), and NSE India.
Fixed Income (Bond) Markets – Where governments and corporations issue debt securities to raise capital.
Foreign Exchange (Forex) Market – The largest and most liquid market globally, facilitating currency conversion for trade and investment.
Commodity Markets – Where raw materials like oil, gold, and agricultural products are traded via spot or futures contracts.
Derivatives Markets – Markets for instruments whose value derives from underlying assets (e.g., options, swaps, futures).
All these markets are influenced by a range of participants, each contributing to the dynamic flow of capital and information.
2. Key Market Participants
A. Institutional Investors
Institutional investors are large organizations that manage vast pools of money on behalf of others. They are the cornerstone of global finance, accounting for the majority of trading volume.
Types include:
Mutual Funds and Exchange-Traded Funds (ETFs): Manage diversified portfolios for retail investors.
Pension Funds: Invest to secure long-term retirement benefits.
Insurance Companies: Allocate premiums into safe or high-yielding assets.
Hedge Funds: Engage in complex strategies, including short selling, arbitrage, and derivatives trading.
Sovereign Wealth Funds (SWFs): State-owned investment funds managing national reserves (e.g., Norway’s Government Pension Fund, Abu Dhabi Investment Authority).
Impact on the market:
Institutional investors bring stability, depth, and liquidity. However, their large-scale movements can also create systemic risk if poorly managed—as seen during the 2008 global financial crisis.
B. Retail Investors
Retail investors are individual participants who invest their personal funds in stocks, bonds, mutual funds, or other assets. Over the last decade, the democratization of finance—driven by mobile trading apps and online brokers—has dramatically increased retail participation.
Characteristics:
Generally invest smaller sums compared to institutions.
Often motivated by personal goals like wealth creation or retirement.
May follow market sentiment, trends, or social media-based movements (e.g., GameStop and AMC “meme stock” rallies).
Influence on the market:
Retail investors contribute to liquidity and diversity of opinion in the market, though they may also introduce volatility due to herd behavior or lack of risk management.
C. Corporations
Corporations participate in financial markets both as issuers and investors. They issue equity (stocks) or debt (bonds) to raise capital for expansion, acquisitions, or working capital. Multinational corporations (MNCs) also engage heavily in foreign exchange markets to hedge currency exposure.
Example:
Apple Inc. issues corporate bonds to finance buybacks or R&D.
Toyota hedges yen-dollar exposure to protect export margins.
Market role:
Corporate actions—like stock buybacks, mergers, or dividend announcements—often trigger major market reactions and influence investor sentiment.
D. Governments and Central Banks
Governments and their monetary authorities play a crucial role as both market participants and regulators.
Key roles:
Issuing Sovereign Debt: Governments raise capital by issuing treasury bonds (e.g., U.S. Treasuries, Indian G-secs).
Regulating Markets: Through agencies like the U.S. SEC or India’s SEBI, governments ensure transparency and investor protection.
Central Bank Interventions: Central banks like the Federal Reserve, European Central Bank (ECB), and Reserve Bank of India (RBI) influence global markets via monetary policy—adjusting interest rates, managing inflation, and stabilizing currencies.
Influence:
Their decisions on rates, liquidity, and currency management directly impact asset prices globally. For example, a rate hike by the Fed strengthens the dollar but often weakens emerging market currencies.
E. Financial Intermediaries
Financial intermediaries bridge the gap between investors and markets. They include:
Brokers and Dealers: Facilitate buying and selling of securities.
Investment Banks: Underwrite new securities issues, assist in mergers and acquisitions, and provide advisory services.
Clearing Houses: Ensure the settlement of trades and reduce counterparty risk.
Custodians: Safeguard assets held by institutional investors.
These intermediaries form the backbone of market operations, ensuring liquidity, transparency, and efficiency.
F. Speculators, Arbitrageurs, and Traders
Speculators and arbitrageurs actively seek short-term profits by exploiting market inefficiencies.
Speculators: Take calculated risks by forecasting price movements.
Arbitrageurs: Profit from price discrepancies across markets or instruments.
High-Frequency Traders (HFTs): Use algorithms to execute trades in milliseconds, contributing to liquidity but sometimes amplifying volatility.
These participants keep markets efficient by correcting mispricings and improving liquidity, though their activities can heighten short-term volatility.
G. Credit Rating Agencies and Analysts
While not direct investors, rating agencies such as Moody’s, S&P Global, and Fitch play a vital role in assessing creditworthiness. Their ratings influence borrowing costs for governments and corporations and guide investor decisions globally. Similarly, financial analysts and research institutions provide data, forecasts, and sentiment analysis that shape investment flows.
H. Regulators and International Institutions
Regulatory bodies ensure the smooth and ethical functioning of markets. They protect investors, enforce transparency, and curb manipulation.
Examples:
SEC (U.S.)
FCA (U.K.)
SEBI (India)
ESMA (Europe)
Internationally, organizations like the IMF, World Bank, and Bank for International Settlements (BIS) coordinate financial stability efforts and monitor systemic risks.
3. Geographic Coverage of Market Participants
Global market participants are distributed across key financial centers:
North America: Dominated by U.S. institutions—Wall Street houses the largest hedge funds, banks, and asset managers like BlackRock and Vanguard.
Europe: London, Frankfurt, and Zurich are major hubs for banking, forex, and insurance.
Asia-Pacific: Hong Kong, Singapore, Tokyo, and Mumbai are leading centers for equity and derivatives trading.
Middle East: Rising influence due to oil wealth and sovereign funds (e.g., Qatar Investment Authority).
Africa and Latin America: Emerging participants with growing stock exchanges and commodity exposure.
This global coverage allows continuous 24-hour trading cycles, connecting markets through technology and capital flows.
4. The Interconnectedness of Global Participants
The modern financial system is highly interconnected. Institutional investors diversify globally; central banks coordinate on policy; and technology ensures real-time market reactions. This interconnection has benefits and risks:
Benefits:
Efficient capital allocation across borders.
Access to international funding and investment opportunities.
Diversification reducing country-specific risk.
Risks:
Contagion effects—financial crises in one country can quickly spread worldwide (as seen in 2008).
Increased volatility due to synchronized trading behavior.
Policy spillovers when major economies adjust monetary or fiscal measures.
5. Technology and the Rise of New Participants
The digital revolution has redefined market participation.
Algorithmic and Quantitative Funds: Use data-driven models and AI to make investment decisions.
Fintech Platforms: Empower retail investors with real-time trading, robo-advisors, and zero-commission brokerage.
Cryptocurrency Participants: A new segment of traders, miners, and blockchain investors now operate in digital asset markets—creating a parallel global market ecosystem.
Data Providers and Tech Firms: Companies like Bloomberg, Refinitiv, and FactSet provide analytics essential for decision-making.
Technology has democratized market access but also introduced cybersecurity and regulatory challenges.
6. Behavioral Dynamics among Market Participants
Each participant operates under different motivations and risk appetites, influencing overall market psychology.
Institutions seek steady, long-term returns.
Retail investors often react emotionally to news or trends.
Governments and central banks act strategically to balance growth and stability.
Speculators and traders thrive on volatility.
These behaviors collectively create market cycles of greed and fear, driving booms, corrections, and recoveries.
7. Challenges Faced by Global Market Participants
Regulatory Divergence: Different countries have varied financial regulations, complicating cross-border operations.
Geopolitical Risks: Wars, trade tensions, and sanctions disrupt capital flows.
Climate and ESG Pressures: Investors increasingly prioritize sustainability, forcing companies and funds to adjust portfolios.
Interest Rate Uncertainty: Central bank policies impact valuation models and investment flows.
Currency Volatility: Multinationals and investors must manage exchange-rate risks amid fluctuating global monetary policies.
8. The Future of Global Market Participation
The future will see a broader and more inclusive set of participants, driven by:
Digital Assets: Wider institutional adoption of cryptocurrencies and tokenized securities.
ESG Integration: Environmental and social governance becoming a standard investment metric.
AI and Automation: Machine learning optimizing portfolio management and risk analytics.
Retail Empowerment: Continued growth of individual participation through education and technology.
Cross-border Integration: Regional cooperation in Asia, Africa, and Latin America expanding investment networks.
The global market is evolving toward inclusivity, transparency, and digital transformation, creating new opportunities and challenges for every participant.
Conclusion
The global market is a living, breathing organism powered by a complex network of participants—each with unique objectives, time horizons, and influences. Institutional investors provide depth and capital; retail investors bring vibrancy and democratization; governments and central banks ensure stability; and intermediaries maintain operational efficiency. Together, they form the backbone of global finance.
In an era of accelerating globalization, technology, and policy interdependence, understanding market participants’ roles is more critical than ever. The health of the global economy ultimately depends on how these diverse actors interact—balancing risk, opportunity, and regulation in pursuit of sustainable financial growth.

Forex Reserves Impact on TradingIntroduction
Foreign exchange reserves, commonly known as forex reserves, are a nation’s holdings of foreign currencies and other reserve assets maintained by its central bank. These reserves play a crucial role in maintaining economic stability, influencing exchange rate movements, and shaping the trading environment for both domestic and international investors. In today’s globalized economy, the magnitude and management of a country’s forex reserves can directly impact trade dynamics, currency valuation, investor confidence, and overall market liquidity.
Forex reserves act as the financial backbone of a nation, providing a buffer against external shocks and ensuring smooth functioning of international trade. Their impact on trading—whether in goods, currencies, or capital markets—is profound and multifaceted. To understand their true significance, one must analyze the composition, functions, and strategic management of forex reserves, and how they shape economic policy and market behavior.
1. Understanding Forex Reserves
Definition:
Forex reserves are assets held by a central bank in foreign currencies, used primarily to back liabilities and influence monetary policy. These reserves usually comprise foreign banknotes, deposits, bonds, treasury bills, gold, and the International Monetary Fund’s (IMF) Special Drawing Rights (SDRs).
Composition of Forex Reserves:
Foreign Currency Assets (FCA): The largest component, often held in USD, EUR, GBP, or JPY.
Gold Reserves: Serve as a hedge against currency depreciation and inflation.
SDRs (Special Drawing Rights): International reserve assets allocated by the IMF.
Reserve Tranche Position (RTP): The portion of a country’s quota in the IMF that it can access without conditions.
For instance, as of 2025, countries like China, India, Japan, and Switzerland hold significant forex reserves, influencing not just their domestic trade stability but also global market trends.
2. Objectives of Maintaining Forex Reserves
Central banks hold forex reserves for several key reasons:
Stabilizing the Currency:
Reserves are used to control excessive volatility in the exchange rate by buying or selling foreign currency in the market.
Meeting Balance of Payments (BoP) Needs:
Reserves ensure that a country can meet its international payment obligations without disrupting trade flows.
Boosting Investor Confidence:
Large reserves signal a country’s ability to handle economic shocks, thereby attracting foreign investment.
Supporting Imports:
Forex reserves cover essential imports like oil, food, and machinery during crises or capital outflows.
Debt Servicing:
Countries use reserves to repay foreign loans and interest, ensuring sovereign creditworthiness.
Crisis Management:
During times of financial or geopolitical stress, reserves act as an insurance mechanism, maintaining trade stability.
3. Link Between Forex Reserves and Trade
Forex reserves influence trade in several direct and indirect ways:
a. Exchange Rate Stability
One of the most immediate impacts of forex reserves on trading is their role in stabilizing the exchange rate. A stable currency enhances export competitiveness and ensures predictability for importers and exporters.
High reserves give the central bank the power to defend its currency against speculative attacks, preventing rapid depreciation.
Low reserves may lead to currency volatility, increasing uncertainty for international traders.
For example, during the 2013 “taper tantrum,” India’s forex reserves helped the Reserve Bank of India (RBI) manage the rupee’s fall against the U.S. dollar, ensuring smoother trade operations.
b. Trade Competitiveness
A country with adequate reserves can maintain favorable exchange rate conditions to support its exporters. By managing currency appreciation, the central bank can ensure that domestic products remain competitive in global markets.
Conversely, countries with low reserves may face currency depreciation, increasing the cost of imports and disrupting supply chains.
c. Import Cover and Payment Security
Forex reserves determine a nation’s ability to pay for imports during economic downturns. The term “import cover” measures how many months of imports can be covered by reserves.
A healthy import cover (usually 8–10 months) ensures uninterrupted trade even during crises. This is especially critical for countries heavily dependent on imported energy or raw materials.
d. Trade Financing and Confidence
Strong reserves improve a country’s creditworthiness, enabling banks and businesses to obtain cheaper foreign financing. This lowers trade financing costs and promotes export-oriented growth.
4. Impact on the Currency and Forex Market
Forex reserves play a dominant role in shaping currency trading and speculation in the forex market.
a. Currency Appreciation or Depreciation
When a country’s central bank sells foreign currency from its reserves to buy domestic currency, it creates upward pressure on the local currency (appreciation).
When it buys foreign currency, it increases supply of local currency, leading to depreciation.
Such interventions are critical in managing the value of the currency to align with trade objectives.
b. Speculative Trading and Market Sentiment
Traders closely monitor changes in forex reserves as an indicator of future policy action.
Increasing reserves often signal capital inflows and strong fundamentals, boosting investor sentiment.
Falling reserves may indicate possible currency weakness or economic stress, leading to speculative short positions in the currency.
Thus, forex reserves indirectly shape forex trading patterns, risk perceptions, and hedging strategies among institutional traders.
c. Volatility Management
High reserves allow a central bank to intervene effectively during extreme volatility in the currency market.
This reassures investors and businesses that the country can maintain market order—reducing panic trading or speculative attacks on the domestic currency.
5. Influence on Domestic and Global Trade Dynamics
a. Domestic Trade and Investment
Forex reserves affect domestic interest rates, inflation, and liquidity—all of which influence local trading conditions. For instance, when central banks accumulate reserves by buying foreign currency, they inject domestic liquidity, which can lower interest rates and stimulate investment.
However, excessive liquidity may cause inflation or asset bubbles if not managed carefully.
b. Global Trade Relationships
Countries with large reserves often gain stronger negotiating positions in global trade forums. They can offer trade credits, fund bilateral projects, or extend currency swap lines, enhancing their influence in international trade relations.
For example, China’s massive forex reserves have allowed it to promote the yuan in global transactions and fund infrastructure projects under the Belt and Road Initiative, indirectly shaping global trade flows.
6. Forex Reserves and Stock Market Trading
The level and trend of forex reserves also affect stock market trading in several ways:
Investor Confidence:
Rising reserves reflect macroeconomic stability, attracting foreign portfolio investment (FPI) into equity markets.
Currency Risk Mitigation:
Stable reserves mean lower currency risk, encouraging foreign investors to hold domestic assets.
Liquidity Flows:
Central bank actions to accumulate or utilize reserves can influence domestic liquidity, impacting stock valuations and trading volumes.
Market Correlation:
Historically, stock market indices in emerging economies like India and Brazil show positive correlation with rising forex reserves, as both signify strong capital inflows and growth prospects.
7. Case Studies
a. China
China holds the world’s largest forex reserves—over $3 trillion—primarily to maintain yuan stability and support export competitiveness. Its large reserves have allowed the People’s Bank of China (PBoC) to manage exchange rates tightly, ensuring predictable trade conditions and global supply chain dominance.
b. India
India’s forex reserves surpassed $650 billion in 2024, providing an import cover of over 10 months. This robust buffer has shielded the Indian rupee from global shocks, such as oil price volatility or geopolitical tensions, supporting steady trade growth and stable investor sentiment.
c. Russia
In 2022, Russia’s large reserves helped it initially resist Western sanctions, but the freezing of reserves held abroad revealed the geopolitical vulnerability of such assets. It underscored the importance of diversification and gold holdings within reserve management.
8. Risks and Challenges in Managing Forex Reserves
While high reserves offer stability, they also come with certain challenges:
Opportunity Cost:
Investing in low-yield foreign assets like U.S. Treasuries offers limited returns compared to potential domestic investments.
Exchange Rate Risk:
Changes in the value of reserve currencies (like the dollar or euro) can cause valuation losses.
Sterilization Costs:
To neutralize inflationary effects of reserve accumulation, central banks often conduct sterilization operations, which can be costly.
Geopolitical Risks:
Holding reserves in foreign countries exposes them to political or sanction risks, as seen in recent global conflicts.
Liquidity vs. Return Trade-off:
Central banks must balance between maintaining highly liquid assets and earning sufficient returns from their reserves.
9. The Future of Forex Reserves and Global Trading
In the evolving digital and geopolitical landscape, the nature and impact of forex reserves are changing rapidly:
Shift Toward Diversification:
Central banks are diversifying away from the U.S. dollar toward the euro, yen, and gold to reduce dependency risks.
Role of Digital Currencies:
The rise of Central Bank Digital Currencies (CBDCs) may alter how countries manage and deploy reserves in cross-border transactions.
Strategic Reserves for Energy and Technology:
Beyond currencies and gold, some nations are considering “strategic reserves” of essential commodities and technologies to ensure trade resilience.
Climate and ESG Considerations:
Reserves may increasingly be managed with environmental, social, and governance (ESG) principles in mind, influencing sustainable investment flows.
Conclusion
Forex reserves serve as the cornerstone of a nation’s economic and financial stability. Their role in influencing trade—both directly through currency stability and indirectly through investor confidence—is undeniable. Adequate reserves not only enable smooth import-export operations but also protect the economy from external shocks, currency crises, and global volatility.
For traders and investors, forex reserves act as a barometer of macroeconomic health. A rising reserve position signals strength, stability, and confidence, while a falling one warns of potential risks in the trade and capital markets.
In a globalized trading environment where currency values, capital flows, and policy decisions are deeply interconnected, the management of forex reserves remains a central pillar of economic strategy. Ultimately, the efficient accumulation, diversification, and utilization of these reserves determine a nation’s ability to sustain trade growth, maintain currency credibility, and foster long-term economic prosperity.

Exotic Options and Structured Products: A Comprehensive Overview1. Introduction
In modern financial markets, investors constantly seek instruments that offer tailored risk–return profiles beyond what standard securities provide. Traditional options and bonds often fail to address specific investor objectives such as capital protection, leveraged exposure, or conditional payoffs. This gap has been bridged by the development of exotic options and structured products — innovative financial instruments engineered to meet diverse investment and hedging needs.
Exotic options are complex derivatives whose payoffs depend on more sophisticated conditions than standard (“plain vanilla”) options. Structured products, on the other hand, are investment vehicles that combine traditional instruments such as bonds or equities with derivatives — often exotic ones — to produce customized returns. Together, they represent the cutting edge of financial engineering, where mathematics, creativity, and market insight intersect.
2. Understanding Exotic Options
Definition
An exotic option is a type of derivative whose structure differs from standard call or put options. While vanilla options derive value solely from the price of an underlying asset at expiration, exotic options may depend on the path of the asset’s price, multiple underlying assets, or certain conditions during the life of the contract.
Exotic options are widely used in corporate risk management, structured finance, and institutional investment strategies because they allow participants to tailor their exposure to specific market scenarios.
3. Types of Exotic Options
There are numerous forms of exotic options, each designed to serve a unique purpose. Below are the main categories:
a. Barrier Options
Barrier options activate or deactivate when the underlying asset’s price crosses a predetermined level (the barrier).
Knock-In Option – Becomes active only if the asset price reaches a specified barrier.
Knock-Out Option – Becomes worthless if the asset price touches a barrier level.
These options are cheaper than vanilla options because the payoff is conditional. For example, a down-and-out call provides protection as long as the price does not fall below a barrier.
b. Asian Options
Also known as average options, these depend on the average price of the underlying asset during a specified period rather than its final price. This reduces exposure to short-term volatility and is often used in commodities or currency markets.
c. Lookback Options
The payoff is based on the maximum or minimum price of the underlying asset during the option’s life. For instance, a lookback call allows the holder to “look back” and choose the lowest price to buy, making it extremely valuable but expensive.
d. Digital (Binary) Options
These options have a fixed payout — either a set amount if the condition is met, or nothing if not. For example, a digital call pays a fixed amount if the asset ends above a strike price. They are often used in speculative or short-term trading strategies.
e. Compound Options
Also called “options on options,” these give the right to buy or sell another option. They are commonly used in corporate financing where uncertainty about future needs justifies layered optionality.
f. Basket and Rainbow Options
These depend on multiple underlying assets, such as a basket of stocks or currencies. A rainbow option might pay based on the best or worst performer among several assets, allowing diversification or correlation plays.
g. Cliquet (Ratchet) Options
These are series of at-the-money options that “lock in” gains periodically. They are popular in structured deposits and capital-protected notes, providing regular profit capture while preserving downside protection.
h. Bermudan Options
These are hybrids between American and European options — they can be exercised only on specific dates before expiration, balancing flexibility and cost.
4. Pricing and Valuation of Exotic Options
Valuing exotic options is significantly more complex than pricing vanilla options. The Black-Scholes model, which works for simple options, must often be extended or replaced by numerical methods.
a. Analytical and Numerical Models
Monte Carlo Simulation – Estimates the option’s value by simulating thousands of random price paths. Useful for path-dependent options like Asians or lookbacks.
Finite Difference Methods – Solve partial differential equations derived from option pricing models.
Binomial and Trinomial Trees – Used for options with discrete events (e.g., barriers or early exercise).
Local and Stochastic Volatility Models – Incorporate changing volatility patterns over time, improving accuracy for complex instruments.
b. Inputs and Sensitivities
Key variables include:
Spot price and strike price
Volatility (often implied)
Risk-free interest rate
Time to maturity
Dividend yield
Correlation (for multi-asset options)
Because exotic options are tailored instruments, market liquidity is limited, and prices often rely on dealer quotes rather than exchange data. Valuation also incorporates model risk, as small assumptions can lead to large pricing differences.
5. Structured Products: Concept and Construction
Definition
A structured product is a pre-packaged investment that combines one or more derivatives (often exotic options) with traditional securities such as bonds or equities. These products are designed to achieve specific outcomes — such as capital protection, enhanced yield, or leveraged participation — under defined market scenarios.
Structured products are typically issued by banks and sold to investors through private placements or public offerings.
6. Components of Structured Products
Most structured products have two primary building blocks:
Fixed-Income Component (Bond or Deposit)
Provides capital protection or guaranteed returns. For example, a zero-coupon bond maturing at face value can ensure that at least part of the principal is preserved.
Derivative Component (Usually an Option or Basket of Options)
Provides market exposure or enhanced upside potential. The derivative could be linked to equities, indices, commodities, currencies, or even interest rates.
For instance, a capital-protected note may invest 90% of the funds in a zero-coupon bond and 10% in a call option on the Nifty 50. If the market rises, the option generates profit; if it falls, the bond ensures capital safety.
7. Types of Structured Products
a. Capital-Protected Notes (CPNs)
Guarantee the return of principal at maturity, while offering upside potential linked to an underlying asset. These are ideal for conservative investors seeking exposure without risking capital.
b. Yield Enhancement Products
These sacrifice downside protection in exchange for higher returns. For example, a reverse convertible bond pays a high coupon but converts into equity if the underlying asset declines.
c. Participation Notes
Allow investors to participate in the performance of an index or asset, often with leverage or caps on returns. They can be structured for bullish or bearish views.
d. Credit-Linked Notes (CLNs)
Combine a bond with a credit default swap, transferring the credit risk of a reference entity to the investor in return for a higher yield.
e. Autocallables and Range Accruals
These include embedded features that trigger automatic redemption or variable coupon payments based on market conditions. For example, an autocallable product may mature early if an index reaches a certain level, locking in profits.
8. Role of Exotic Options in Structured Products
Exotic options are often the hidden engines within structured products. For example:
A capital-protected equity note may include a digital call option to deliver fixed returns if an index ends above a level.
A range-accrual note may embed barrier options determining coupon accrual based on interest rate movements.
A cliquet note uses ratchet options to lock in periodic gains while protecting principal.
Thus, exotic options allow structured product designers to engineer payoffs that are asymmetric, path-dependent, or conditional — catering to virtually any investment outlook.
9. Benefits of Structured Products
Structured products offer a suite of benefits for both institutional and retail investors:
Customization – Tailored to match specific risk tolerance, market outlook, and investment horizon.
Capital Protection – Through fixed-income components and hedging derivatives.
Enhanced Yield – Higher returns via embedded options or credit exposure.
Diversification – Exposure to alternative asset classes or market conditions.
Risk Management – Can hedge against adverse currency, rate, or equity movements.
These features make structured products appealing in low-yield environments or when traditional investments fail to meet portfolio objectives.
10. Risks and Challenges
Despite their appeal, exotic options and structured products carry significant risks:
a. Market Risk
The derivative component’s value is sensitive to changes in the underlying asset. Extreme volatility or unexpected movements can erode returns.
b. Credit Risk
Investors are exposed to the issuer’s creditworthiness. If the issuing bank defaults, even capital-protected notes may lose value.
c. Liquidity Risk
Since most structured products are not exchange-traded, secondary market liquidity is limited. Early redemption may result in losses.
d. Complexity and Transparency
Understanding embedded options requires advanced financial knowledge. Many retail investors underestimate the product’s risk profile.
e. Model Risk
Incorrect pricing assumptions (such as volatility or correlation) can misrepresent true risk or value.
f. Regulatory Risk
Changing regulations may affect taxation, disclosure, or product eligibility, especially in cross-border offerings.
11. Market Trends and Global Outlook
The global market for structured products exceeds trillions of dollars, with strong growth in Asia and Europe. Banks use them to generate fee income, while investors use them to seek alternative returns in low-interest environments.
Recent trends include:
Digitalization and automation of product issuance through fintech platforms.
Sustainability-linked structured products tied to ESG indices.
Tokenized structured notes on blockchain platforms, improving transparency.
Rising use of machine learning models for pricing exotic derivatives.
Regulatory tightening after past mis-selling scandals to protect retail investors.
Post-2020, with volatile markets and fluctuating rates, structured products have regained popularity as flexible tools for yield optimization and risk diversification.
12. Applications in Portfolio Strategy
Institutional investors employ exotic options and structured products for:
Yield enhancement – capturing returns in sideways markets.
Capital protection – maintaining exposure without principal loss.
Hedging – offsetting corporate exposures in currencies, commodities, or rates.
Diversification – achieving non-linear payoffs uncorrelated with standard assets.
Private banks use them to attract affluent investors seeking sophisticated, personalized products that align with their market views.
13. Conclusion
Exotic options and structured products represent the pinnacle of financial innovation, merging mathematical precision with investment creativity. They allow investors and institutions to shape unique payoff profiles — from capital-protected growth to leveraged yield — often unachievable through conventional assets.
However, with this innovation comes complexity. Proper valuation, risk assessment, and transparency are crucial. Investors must understand not only the potential returns but also the embedded risks and the issuer’s credit quality.
In a global financial landscape increasingly characterized by uncertainty, structured products and exotic options serve as versatile instruments for tailored exposure, capital efficiency, and strategic hedging. Yet, they demand expertise, due diligence, and disciplined risk management to harness their full potential responsibly.

Trading Strategies and Index InvestmentsIntroduction
In the modern financial world, investors and traders have access to a wide array of instruments and strategies designed to achieve specific goals — from short-term profit to long-term wealth creation. Two fundamental pillars of market participation are trading strategies and index investments. While trading strategies focus on short-term price movements to generate returns, index investing emphasizes passive, long-term exposure to market performance. Understanding both approaches helps investors diversify their portfolios, manage risk, and align financial decisions with market dynamics.
1. Understanding Trading Strategies
Trading strategies are systematic methods used to determine when to buy or sell securities such as stocks, commodities, forex, or indices. These strategies are based on technical analysis, fundamental analysis, quantitative models, or a combination of these. The goal is to maximize profit while minimizing risk.
1.1 Types of Trading Strategies
a) Day Trading
Day trading involves buying and selling financial instruments within the same trading day. Traders aim to capitalize on small price fluctuations using leverage and high liquidity. It requires constant monitoring of markets, technical charts, and news.
Key tools: Moving averages, RSI (Relative Strength Index), MACD, candlestick patterns.
Example: A trader buys Nifty 50 futures at 22,000 and sells at 22,050 within the day, making profit from intraday volatility.
b) Swing Trading
Swing trading focuses on capturing medium-term price movements lasting from a few days to several weeks. Traders rely on trend analysis and chart patterns to identify potential reversals or continuations.
Example: Buying Reliance Industries stock after a bullish breakout and holding it for two weeks until the trend peaks.
c) Position Trading
Position traders hold assets for weeks or months, relying heavily on macroeconomic trends and company fundamentals rather than daily price swings.
Example: Holding gold futures during a geopolitical crisis anticipating long-term price appreciation.
d) Scalping
Scalping is an ultra-short-term trading strategy where traders make dozens or even hundreds of trades daily, seeking tiny profits per trade.
Example: Buying and selling Bank Nifty options multiple times a day to exploit minute market inefficiencies.
e) Algorithmic and Quantitative Trading
Algorithmic trading uses automated systems and mathematical models to execute trades based on predefined rules. It eliminates human emotion and allows high-frequency transactions.
Example: A quantitative model buys stocks when the 50-day moving average crosses above the 200-day moving average (Golden Cross).
1.2 Technical vs. Fundamental Strategies
Technical Trading
This approach relies on chart patterns, price action, and market indicators. Technical traders assume that all information is already reflected in the price and focus on market psychology and trends.
Popular tools: Fibonacci retracements, Bollinger Bands, trendlines, and support/resistance zones.
Fundamental Trading
Fundamental traders base their decisions on economic data, company earnings, interest rates, and macroeconomic events. They focus on intrinsic value rather than short-term volatility.
Example: Buying undervalued stocks based on P/E ratio, dividend yield, or balance sheet strength.
1.3 Risk Management in Trading
Risk management is the cornerstone of successful trading. Without disciplined control, even the best strategy can fail.
Position Sizing: Limiting exposure per trade (usually 1–2% of capital).
Stop-Loss Orders: Automatically exiting trades when losses reach a certain threshold.
Diversification: Trading across multiple instruments or sectors to reduce correlation risk.
Risk-Reward Ratio: Maintaining a ratio of at least 1:2 ensures that potential profits exceed potential losses.
Psychological Control: Avoiding emotional decisions like revenge trading or over-leveraging.
1.4 Modern Trading Approaches
High-Frequency Trading (HFT)
HFT uses algorithms and ultra-fast computing to exploit microsecond-level inefficiencies in markets. It is popular among institutional players rather than retail investors.
Momentum Trading
This strategy involves buying securities showing upward momentum and selling those losing strength.
Example: Buying Tesla shares after a strong breakout due to earnings surprise.
Contrarian Trading
Contrarians go against the market sentiment — buying when others are fearful and selling when others are greedy.
News-Based Trading
Market prices react quickly to economic announcements, corporate earnings, and geopolitical news. Traders use economic calendars and news scanners to exploit volatility.
2. Index Investments: The Passive Approach
While trading strategies focus on active management and short-term profit, index investing represents the opposite — a long-term, passive, and cost-efficient strategy. Index investments track a specific market index, such as the S&P 500 (USA), Nifty 50 (India), or FTSE 100 (UK).
2.1 What is an Index?
An index is a statistical measure representing the performance of a basket of securities. It reflects the overall health of a market or sector.
Examples:
S&P 500 – Tracks 500 large-cap U.S. companies.
Nifty 50 – Represents 50 leading Indian companies.
Dow Jones Industrial Average (DJIA) – Tracks 30 U.S. blue-chip companies.
2.2 Index Funds and ETFs
Index Funds
Index mutual funds invest in all the components of a specific index, aiming to replicate its returns. They have low management costs since they don’t require active decision-making.
Exchange-Traded Funds (ETFs)
ETFs also track indices but trade like stocks on exchanges. Investors can buy and sell ETF units throughout the day.
Example: Nifty BeES (Nippon India ETF Nifty BeES) mirrors the Nifty 50 index.
Advantages of ETFs and Index Funds:
Low fees and expense ratios.
High transparency (holdings are publicly known).
Diversification across sectors and companies.
Suitable for long-term investors seeking steady growth.
2.3 Benefits of Index Investing
Diversification – Investing in an index spreads risk across multiple companies and industries.
Low Cost – Minimal management fees compared to actively managed funds.
Consistent Returns – Historically, major indices outperform most active traders over the long term.
Simplicity – No need for constant analysis or market timing.
Compounding Growth – Reinvested dividends and long-term market appreciation enhance total returns.
2.4 Index Investing Strategies
a) Buy-and-Hold Strategy
Investors purchase an index fund and hold it for several years, ignoring short-term volatility. This strategy relies on the long-term growth of markets.
b) Dollar-Cost Averaging (DCA)
Investing a fixed amount periodically (monthly or quarterly) regardless of price helps reduce the impact of market timing.
c) Sector Index Investing
Instead of broad indices, investors can choose sectoral indices (e.g., Nifty IT, Nifty Bank) to capitalize on specific industry growth.
d) Thematic Index Investing
Focuses on emerging themes like green energy, artificial intelligence, or ESG (Environmental, Social, Governance) factors.
e) Smart Beta Investing
Combines passive and active investing by weighting stocks in an index based on factors such as value, momentum, or volatility rather than market capitalization.
2.5 Risks in Index Investing
Even though index investing is relatively safer, it is not risk-free:
Market Risk – When the entire market declines, index funds also lose value.
Tracking Error – Slight deviation between the index and fund performance.
Sector Concentration – Some indices may be heavily weighted in certain sectors (e.g., tech in NASDAQ).
Inflation Risk – Returns may not always outpace inflation during stagnant periods.
3. Trading vs. Index Investing: A Comparative Overview
Aspect Trading Strategies Index Investments
Objective Short-term profit Long-term wealth creation
Time Horizon Minutes to weeks Years to decades
Approach Active management Passive management
Risk Level High (depends on leverage) Moderate
Skill Requirement High (technical & analytical) Low to medium
Costs Brokerage, slippage, taxes Low management fees
Emotion Factor High — psychological discipline needed Low — less frequent decisions
Return Pattern Variable, can be volatile Steady, tracks market average
Tools Used Charts, indicators, news Index funds, ETFs
4. Integrating Both Approaches
A balanced investor can combine trading and index investing to benefit from both short-term opportunities and long-term stability.
4.1 Core-Satellite Strategy
Core: 70–80% of portfolio in index funds for stable, market-linked growth.
Satellite: 20–30% allocated to active trading or thematic opportunities for higher alpha.
4.2 Hedging with Index Derivatives
Traders can use index futures and options to hedge portfolios during volatile times.
Example: An investor holding Nifty 50 index funds can short Nifty futures to protect against downside risk.
4.3 Periodic Rebalancing
Regularly reviewing and adjusting portfolio allocations ensures alignment with risk tolerance and market conditions.
5. Global and Indian Market Context
5.1 Global Perspective
In the U.S., index investing has surged in popularity due to consistent outperforming results. The S&P 500 index funds like Vanguard 500 (VFIAX) or SPDR S&P 500 ETF (SPY) have become cornerstones of retirement portfolios.
Algorithmic trading, on the other hand, dominates global markets, with over 70% of equity trades in developed markets being automated.
5.2 Indian Context
In India, index funds and ETFs have seen exponential growth, with retail investors embracing passive investing due to SEBI’s promotion of low-cost instruments. Popular indices include Nifty 50, Sensex, and Nifty Next 50.
Simultaneously, trading culture has expanded, driven by easy digital access, discount brokers, and rising financial literacy.
6. Future Trends
AI-Driven Trading – Artificial intelligence and machine learning are revolutionizing trading strategy optimization.
Smart Beta Indexes – Blending active and passive principles for better returns.
Sustainable Investing – ESG indices gaining global traction.
Fractional ETFs and Global Index Exposure – Enabling small investors to own portions of global markets.
Increased Retail Participation – Technology platforms making markets accessible to millions of small investors.
Conclusion
Trading strategies and index investments represent two contrasting yet complementary philosophies of market participation. Traders thrive on volatility, precision, and short-term opportunities, while index investors rely on patience, discipline, and compounding over time. The real strength lies in understanding one’s goals, risk appetite, and market behavior to strike the right balance.
In an era of algorithmic systems, digital platforms, and globalized finance, both trading and index investing will continue to evolve. For sustained financial success, investors must integrate knowledge, adaptability, and discipline — using active trading to seize opportunities and index investing to build enduring wealth.
Commodity Supercycle in the Global MarketHistorical Context of Commodity Supercycles
1. The 19th-Century Industrial Revolution (1850–1913)
The first recognized commodity supercycle emerged during the Industrial Revolution. Massive infrastructure development in Europe and North America created unprecedented demand for metals such as copper, iron, and coal. Steam engines, railroads, and manufacturing industries relied heavily on these raw materials. Agricultural products such as cotton and wheat also experienced booms due to population growth and urbanization. This cycle lasted nearly six decades and only ended with the onset of World War I, which disrupted global trade and supply chains.
2. The Post-World War II Reconstruction Boom (1945–1973)
The second supercycle began after World War II. Countries ravaged by war, especially in Europe and Asia, undertook large-scale reconstruction efforts. The Marshall Plan in Europe and the industrial rebuilding of Japan led to a surge in demand for steel, aluminum, oil, and other industrial commodities. This era also saw the rise of the automobile industry and massive public infrastructure projects. The 1950s and 1960s witnessed high economic growth and rising living standards, pushing commodity prices to historic highs. The cycle ended with the oil crisis of the 1970s and the global recession that followed.
3. The China-Led Commodity Boom (2000–2011)
The most recent major supercycle occurred in the early 21st century, driven by China’s rapid industrialization and urbanization. As China transitioned from an agrarian economy to a global manufacturing powerhouse, its demand for commodities skyrocketed. Oil, copper, iron ore, coal, and steel saw sustained price increases as China became the world’s largest consumer of many raw materials. Emerging economies like India, Brazil, and Russia also contributed to the boom. Commodity exporters such as Australia, Canada, and countries in Africa benefited from this surge, experiencing robust economic growth. However, this cycle peaked around 2011–2012, followed by a decade of price corrections due to slowing global growth and technological shifts toward renewable energy.
Understanding the Commodity Supercycle Mechanism
Commodity supercycles are influenced by a combination of demand-side, supply-side, and macro-financial factors.
1. Demand-Side Drivers
Industrialization and Urbanization: When nations transition from low-income to middle-income status, infrastructure and construction activities surge. This creates heavy demand for metals, energy, and agricultural products.
Population Growth: Expanding populations, especially in emerging economies, increase the need for food, water, and energy.
Technological Transformation: Innovations such as electric vehicles, renewable energy, and digitization can trigger new waves of commodity consumption—particularly for lithium, cobalt, copper, and rare earth elements.
Fiscal Stimulus and Globalization: Expansionary policies and interconnected supply chains amplify global trade volumes and commodity use.
2. Supply-Side Constraints
Investment Lag: Commodity production is capital-intensive and slow to adjust. Mining, drilling, and refining require years of investment before new supply reaches markets.
Resource Depletion: Declining ore grades, shrinking oil reserves, and environmental restrictions constrain supply growth.
Geopolitical Instability: Conflicts, sanctions, and trade disputes can disrupt production and transportation routes.
Climate Change and Regulation: Environmental policies limit extraction and encourage sustainable alternatives, impacting supply chains and cost structures.
3. Financial and Monetary Influences
Inflation and Currency Fluctuations: Commodities are priced in U.S. dollars. A weak dollar typically drives prices higher, while a strong dollar suppresses them.
Interest Rates and Liquidity: Low interest rates and abundant liquidity encourage speculative investment in commodities as an inflation hedge.
Hedging and Derivatives Markets: Financialization of commodities through futures and ETFs amplifies both upswings and downswings in prices.
Signs of a New Commodity Supercycle (2020s Onward)
In the wake of the COVID-19 pandemic, the global economy has entered a new phase that bears striking similarities to past supercycles. Several interconnected forces are driving speculation about another long-term commodity boom.
1. Energy Transition and Green Revolution
The shift from fossil fuels to renewable energy is transforming the demand structure for commodities. The green transition requires vast quantities of critical minerals such as lithium, nickel, cobalt, graphite, and copper for electric vehicles (EVs), batteries, wind turbines, and solar panels. According to the International Energy Agency (IEA), demand for these minerals could increase four to six times by 2040.
At the same time, investment in traditional oil and gas production has declined sharply due to ESG pressures and carbon-neutral targets, leading to supply shortages and higher prices. The dual forces of green demand and fossil fuel underinvestment are creating structural tightness in the energy complex.
2. Fiscal Stimulus and Infrastructure Spending
Governments worldwide, especially in the U.S., China, and India, are investing heavily in infrastructure to revive growth and create jobs. The U.S. “Infrastructure Investment and Jobs Act,” China’s Belt and Road Initiative, and India’s national infrastructure pipeline collectively promise trillions in spending on roads, ports, housing, and clean energy projects—driving up demand for steel, cement, copper, and aluminum.
3. Deglobalization and Supply Chain Reconfiguration
The pandemic and geopolitical tensions—such as the Russia-Ukraine war and U.S.-China rivalry—have led to a shift from globalization toward regionalization or friend-shoring. This restructuring often results in higher costs and redundancy in supply chains, which tend to push up commodity demand and prices. Countries are now prioritizing resource security and strategic stockpiling, particularly for energy and critical minerals.
4. Demographic and Consumption Shifts
Rising middle-class populations in Asia and Africa are altering consumption patterns. Greater income leads to higher demand for protein, housing, vehicles, and electronics—all of which are commodity-intensive. By 2030, Africa alone will have over 1.7 billion people, many entering urban centers, which could sustain long-term demand for food, metals, and energy.
5. Inflationary Pressures and Currency Dynamics
After years of low inflation, the global economy is witnessing sustained price increases due to supply chain disruptions, energy shortages, and monetary stimulus. Commodities traditionally act as inflation hedges, attracting investment flows. A weakening U.S. dollar, if it occurs due to fiscal deficits or shifting reserve preferences, could further support higher commodity prices.
Key Commodities in the Emerging Supercycle
1. Energy (Oil, Gas, Coal, Renewables)
While renewable energy is the future, fossil fuels remain dominant in the short to medium term. Underinvestment in oil exploration has created supply gaps, pushing crude prices upward. Natural gas, especially LNG, is seeing strong demand as a transition fuel. Simultaneously, renewable energy infrastructure is spurring record demand for metals and minerals.
2. Industrial Metals (Copper, Aluminum, Iron Ore, Nickel)
Copper is often dubbed the “metal of electrification.” Its use in EVs, power grids, and renewable energy technologies makes it central to the new supercycle. Aluminum and nickel are essential for lightweight transport and battery production, while iron ore remains vital for construction and steelmaking.
3. Precious Metals (Gold, Silver, Platinum)
Gold remains a store of value during inflationary or geopolitical uncertainty. Silver and platinum group metals are also gaining importance due to their applications in clean technologies like solar panels and hydrogen fuel cells.
4. Agricultural Commodities (Wheat, Corn, Soybeans, Coffee)
Food commodities are experiencing volatility due to climate change, water scarcity, and disruptions caused by war and trade restrictions. The transition toward biofuels and plant-based diets also influences agricultural dynamics.
5. Critical and Rare Earth Elements
The race for rare earths and critical minerals is intensifying. These elements are indispensable for high-tech applications such as semiconductors, defense systems, and renewable energy. Control over these resources has become a strategic geopolitical priority, with China currently dominating global supply chains.
Implications of a Commodity Supercycle
1. Economic Growth and Inflation
Rising commodity prices can boost exporting economies (like Australia, Canada, Brazil, and many African nations) but strain importers (like India and Japan). Inflationary pressures can erode consumer purchasing power, prompting central banks to tighten monetary policy. The resulting interest rate hikes can affect debt sustainability and investment.
2. Geopolitical Realignment
Access to resources often dictates global alliances. The new energy landscape is reshaping geopolitical power—moving influence from oil-rich Middle Eastern nations toward countries rich in lithium, copper, and rare earths such as Chile, the Democratic Republic of Congo, and Indonesia. Competition for these resources may redefine global trade and diplomacy.
3. Environmental and Social Challenges
While high commodity prices incentivize resource development, they also raise environmental and social concerns. Mining expansion can harm ecosystems, displace communities, and increase carbon emissions if not managed responsibly. Balancing sustainability with economic growth will be a defining challenge of the new cycle.
4. Investment and Financial Markets
Commodity-linked equities, exchange-traded funds (ETFs), and futures markets are likely to attract increased investor attention. Institutional investors may diversify into real assets as protection against inflation and currency devaluation. However, volatility and cyclical downturns remain inherent risks.
Conclusion
The concept of a commodity supercycle captures the profound interconnection between economic growth, technological change, and natural resource utilization. The 21st-century global economy appears to be entering a new supercycle—one fueled not by industrialization alone but by decarbonization, digitalization, and demographic expansion.
Unlike previous cycles driven primarily by fossil fuels and heavy industry, this one is characterized by the quest for sustainability and resource efficiency. It is both a challenge and an opportunity: nations that secure reliable access to key materials and adapt to evolving market structures will emerge as leaders in the new economic order.
For investors, understanding the structural trends behind commodity movements—rather than chasing short-term price fluctuations—is crucial. For policymakers, balancing resource security with environmental stewardship will define long-term prosperity.
Ultimately, the commodity supercycle serves as a mirror of humanity’s progress—each wave reflecting a new era of innovation, ambition, and transformation in the global market.

The Future of Global CurrencyIntroduction
Currency has always been a reflection of economic power, political stability, and technological progress. From gold-backed systems to fiat money and now the age of digital currencies, the global financial landscape is constantly evolving. As the world moves deeper into the 21st century, the concept of “money” itself is undergoing a profound transformation. The future of global currency will not only redefine trade and finance but will also reshape global power dynamics, monetary policy, and international relations.
This essay explores the possible trajectories of global currency in the coming decades, examining the influence of technology, digital innovation, central bank policies, geopolitical shifts, and societal adaptation.
1. Historical Context and Evolution of Global Currency
Understanding the future requires a look into the past. The concept of global currency has evolved through several distinct phases:
The Gold Standard Era (19th – early 20th century):
Nations tied their currencies to gold reserves, ensuring stability but limiting flexibility. International trade was predictable but slow to adjust to shocks like wars and depressions.
The Bretton Woods System (1944–1971):
After World War II, the U.S. dollar became the anchor of the global monetary system, convertible to gold at a fixed rate. This system established the dollar’s dominance and linked other major currencies to it.
Fiat Currency Era (1971–Present):
When the U.S. abandoned the gold standard in 1971, currencies became fiat — backed not by commodities, but by government trust. Exchange rates became flexible, allowing central banks to influence money supply and interest rates.
The Digital Revolution (2009–Present):
The launch of Bitcoin in 2009 marked a new era — decentralized digital currency. Simultaneously, governments and private institutions began exploring blockchain, digital payments, and central bank digital currencies (CBDCs), signaling a paradigm shift.
This evolution shows a clear trend: money is becoming increasingly abstract, technology-driven, and globalized.
2. The Rise of Digital and Cryptocurrencies
Digital currencies represent the most revolutionary shift in the global monetary system since the advent of paper money. Their growing acceptance and technological sophistication have challenged traditional financial models.
2.1 Cryptocurrencies
Bitcoin, Ethereum, and other cryptocurrencies introduced decentralized finance (DeFi), which operates independently of governments or banks. They allow direct peer-to-peer transactions, secured through blockchain technology.
Key features include:
Decentralization: No single authority controls the network.
Transparency: Transactions are recorded on a public ledger.
Scarcity: Limited supply, especially in Bitcoin, mimics gold’s deflationary model.
Borderless Nature: Cryptocurrencies can be traded globally without intermediaries.
However, volatility, regulatory uncertainty, and scalability challenges limit their use as mainstream currencies. Despite this, they have influenced how governments and central banks view money’s future.
2.2 Stablecoins and Tokenization
Stablecoins like USDT (Tether) and USDC have emerged to bridge the gap between crypto volatility and fiat stability. Pegged to traditional currencies or assets, they facilitate smoother digital transactions and are increasingly integrated into global payment systems.
Tokenization — converting real-world assets into digital tokens on blockchain — could redefine how ownership, trade, and investment occur in the global economy.
2.3 Central Bank Digital Currencies (CBDCs)
Governments worldwide are developing CBDCs as secure, state-backed digital alternatives to cash. Unlike cryptocurrencies, CBDCs are centralized and controlled by monetary authorities.
China’s e-CNY is already in pilot phase across major cities.
The European Central Bank is working on the Digital Euro.
India’s Digital Rupee aims to modernize payments and reduce dependency on physical cash.
The U.S. Federal Reserve is exploring a Digital Dollar, though progress is slower due to privacy and regulatory debates.
CBDCs aim to enhance transaction efficiency, combat illicit finance, and strengthen monetary policy transmission. They could become the new global standard if interoperability and trust are achieved.
3. The U.S. Dollar’s Future as the Global Reserve Currency
For over seven decades, the U.S. dollar has been the world’s dominant reserve currency, accounting for over 55–60% of global reserves. However, challenges to its supremacy are emerging.
3.1 Dollar Dominance Today
The dollar’s dominance stems from:
Deep U.S. capital markets
Global trust in American institutions
The petrodollar system (oil traded in USD)
Political and military influence of the U.S.
Yet, excessive sanctions, political polarization, and high debt levels have raised concerns about long-term confidence in the dollar.
3.2 Potential Rivals
The Euro:
The euro remains the second most held reserve currency but struggles with internal fragmentation and economic disparity among EU members.
The Chinese Yuan (Renminbi):
China is pushing for yuan internationalization, particularly through trade settlements and the Belt and Road Initiative. Its digital yuan (e-CNY) could accelerate global usage if trust and transparency improve.
Cryptocurrencies and CBDCs:
A global basket of CBDCs or a universal digital currency could eventually challenge dollar supremacy. The International Monetary Fund (IMF) and Bank for International Settlements (BIS) are already discussing cross-border CBDC interoperability.
4. Technological Transformation in Global Finance
The integration of technology and finance — “FinTech” — is revolutionizing how money is created, stored, and exchanged. Blockchain, artificial intelligence (AI), and quantum computing will play pivotal roles in defining the future of currency.
4.1 Blockchain and Distributed Ledger Technology (DLT)
Blockchain ensures transparency, security, and efficiency in transactions. Governments and corporations are adopting it to track payments, verify identities, and reduce fraud. The future monetary system could be a hybrid of blockchain-based infrastructures managed by regulated entities.
4.2 Artificial Intelligence and Automation
AI-driven algorithms will shape global currency markets by predicting exchange rate movements, automating trades, and optimizing monetary policies. AI-based fraud detection and smart contracts will enhance transaction security.
4.3 Quantum and Cybersecurity Concerns
As digital money grows, so does the threat of cyberattacks. Quantum computing could eventually break existing encryption systems, prompting central banks to develop quantum-resistant digital currencies.
5. Geopolitical Dynamics and Monetary Power Shifts
The future of global currency cannot be separated from global politics. Economic alliances, sanctions, and trade disputes directly affect currency power.
5.1 The Multipolar Currency World
Instead of one dominant currency, the future may see a multipolar system — a mix of regional and digital currencies used for different purposes. For instance:
Dollar for international reserves
Euro for European trade
Yuan for Asian transactions
Bitcoin or CBDCs for cross-border payments
Such diversification reduces dependency on any single currency and could stabilize global trade.
5.2 De-dollarization Trends
Countries like China, Russia, and members of BRICS are promoting de-dollarization — settling trade in local currencies or gold. The BRICS bloc’s discussions on a common digital currency could challenge the dollar’s hegemony if successfully implemented.
5.3 Sanctions and Financial Independence
The weaponization of the U.S. dollar through sanctions has pushed nations to develop alternative payment systems like:
CIPS (China’s Cross-Border Interbank Payment System)
INSTEX (Europe’s Instrument in Support of Trade Exchanges)
These systems aim to bypass SWIFT and reduce dependency on Western-controlled networks.
6. The Role of International Institutions
Organizations like the IMF, World Bank, and BIS will play critical roles in stabilizing this transition. They are already studying frameworks for global digital currency regulation, cross-border payment efficiency, and the management of systemic risks.
The IMF’s Special Drawing Rights (SDRs) could also evolve into a digital asset basket, providing a neutral global reserve instrument that’s not tied to any single nation’s currency.
7. The Future of Cash and Banking Systems
As digital adoption accelerates, the role of physical cash will decline. Cash usage has already dropped significantly in advanced economies due to contactless payments and digital wallets.
7.1 Cashless Societies
Countries like Sweden and South Korea are leading toward cashless economies. In the future, transactions may be entirely digital — conducted through mobile wallets, biometric systems, or embedded chips.
7.2 Financial Inclusion and Challenges
Digital currencies could enhance financial inclusion, especially in developing countries where access to banking is limited. However, they also raise concerns about:
Privacy: State-controlled digital currencies could enable surveillance.
Accessibility: Technological infrastructure gaps may exclude rural populations.
Monetary Control: Governments could impose negative interest rates or programmable money restrictions.
Balancing innovation with human rights will be crucial.
8. Environmental and Ethical Considerations
Cryptocurrency mining consumes vast energy resources, raising environmental concerns. Future currencies must prioritize green finance principles — using renewable energy for blockchain operations and implementing sustainable financial systems.
Central banks are increasingly aligning currency policies with climate goals, promoting green bonds, carbon credits, and eco-friendly payment solutions.
9. Possible Future Scenarios
Scenario 1: The Digital Dollar Dominance
The U.S. successfully launches a digital dollar integrated with blockchain security, maintaining global supremacy while modernizing trade.
Scenario 2: Multipolar Currency Order
The world transitions to regional CBDCs — Digital Euro, e-CNY, Digital Rupee — coexisting through interoperable platforms.
Scenario 3: Global Digital Reserve Currency
An IMF-backed digital SDR or synthetic currency (a basket of major CBDCs) becomes the universal settlement tool.
Scenario 4: Decentralized Financial Ecosystem
Cryptocurrencies and DeFi platforms become mainstream, reducing state control and promoting individual financial sovereignty.
10. Conclusion
The future of global currency is being shaped by technological innovation, geopolitical competition, and societal change. Traditional fiat systems are giving way to a hybrid world — where sovereign digital currencies, cryptocurrencies, and blockchain-based financial networks coexist.
In this evolving landscape:
The U.S. dollar’s dominance may gradually erode, giving rise to a multipolar system.
CBDCs will likely become the foundation of modern economies.
Cryptocurrencies will coexist as speculative assets and alternative stores of value.
Digital integration and regulation will determine the balance between innovation and stability.
Ultimately, the currency of the future will not just be a medium of exchange — it will be a tool of technology, governance, and global cooperation. Whether centralized or decentralized, digital or hybrid, its success will depend on trust, transparency, and equitable access for all.
The transformation underway marks not merely a new chapter in monetary history, but the dawn of a truly digital global economy, redefining how nations trade, how citizens transact, and how value itself is perceived.

How Smart Money Moves Gold (XAUUSD)🟡 Gold never moves randomly — it moves with intention.
Every spike, every fake breakout, every sharp reversal… it’s all part of a bigger plan by smart money (institutions) to trap emotional traders and collect liquidity.
Let’s break it down 👇
⚡ 1️⃣ Liquidity Grab (The Trap Phase)
Before any real move, gold sweeps stop-losses above highs or below lows.
Retail traders think it’s a breakout — but it’s actually a liquidity hunt.
Smart money fills large positions here while emotions run high.
⚡ 2️⃣ Market Structure Shift (The Clue)
After collecting liquidity, watch for a BOS (Break of Structure) or CHoCH (Change of Character) — these reveal when the real move is starting.
⚡ 3️⃣ Smart Money Entry (The Real Move)
Once the trap is set, gold often makes a strong impulsive push.
This is where institutions enter — and where smart traders follow with confirmation, not emotion.
⚡ 4️⃣ Emotional Traders Lose, Logical Traders Win
The market doesn’t hate you — it simply feeds on emotional reactions.
Be patient, wait for liquidity sweep ➜ structure shift ➜ confirmation entry.
🧭 Pro Tip:
👉 Stop chasing candles.
👉 Study liquidity and market structure.
👉 Let the chart show who’s trapped — and then trade against them.
💬 Remember:
“The market rewards patience, not panic.”
💎 Gold (XAUUSD) moves on liquidity — not luck.
#TradeSmart #ThinkLikeInstitutions #XAUUSD

The New Trading Era: From Machine Intelligence to Human EdgeThe Oracle That Doesn’t Think but Mirrors
Everyone’s talking about the “rise of artificial intelligence” in trading, algorithms replacing traders, neural networks predicting the next move, machines that seem to think.
But the most extraordinary thing about machine intelligence isn’t its brilliance. It’s its astonishing ability to mirror, to absorb vast amounts of past data and recreate patterns it has already seen. A gigantic echo chamber of past realities.
In other words, what we call “intelligence” in these systems is not understanding, it’s reproduction. They don’t reason; they recognize. They don’t imagine; they approximate.
And yet, that ability to reflect a million past environments can feel almost magical, especially when it responds with coherence that seems human.
But here’s the quiet paradox: one the industry rarely talks about: What we’re witnessing isn’t a new form of intelligence; it’s a new kind of mirror, one that reveals how little we truly understand about our own decision-making.
When Machines Need to Learn the Market Every Day
For most of us, our first real encounter with AI came through models like ChatGPT, tools that belong to a specific subgroup of machine learning known as Large Language Models (LLMs), designed to simulate human-like conversation. That’s where our perception of AI as “brilliant and almost magical” was born. LLMs seem capable of answering anything, from trivial questions to complex reasoning.
Their power, however, doesn’t come from understanding the world. It comes from an extraordinary ability to predict language, a task that, despite its apparent complexity, is remarkably stable and mathematically manageable. The rest is simply scale: access to a massive database of accumulated knowledge, allowing the model not only to predict the next word but also to recreate an entire response by recognizing and recombining patterns it has already seen a million times before.
To understand this better, think of your phone’s autocomplete as a miniature version of ChatGPT, it guesses your next word based on your previous conversations. In such a stable environment, consistency is easy. That’s why language models achieve such high accuracy: their elevated “win rate” comes from playing a game where the rules rarely change.
They may look brilliant, but it’s better to say they’re simply hard-working machines in a stable world.
Trading, however, exists on the opposite side of the spectrum. It lives in a non-stationary world, one where the rules constantly evolve. Today’s conditions will be different tomorrow. Or in five minutes. Or in five seconds. No one knows when or how the shift will happen.
Here lies the crucial difference: a model that “understands” English doesn’t need to relearn grammar every week. A model that trades must relearn market reality every day.
Machine learning thrives on repetition. Markets thrive on surprise.
The Real Disruption: Human Understanding + Machine Power
By truly understanding the capabilities and limitations of machine learning in trading or more broadly, artificial intelligence, we realize that the future isn’t about removing humans from the equation. It lies in understanding how machine power compounds in the right hands.
The next era of trading won’t be about replacing human judgment but amplifying it.
Human contextual reasoning, our ability to interpret uncertainty, adapt, and make sense of nuance, can be combined with the machine’s immense capacity for data processing and execution.
Machines bring speed, scale, and memory. Humans bring intuition, flexibility, and judgment.
The synergy happens when both play their part: the trader designs the logic; the machine executes it flawlessly.
Machines cannot think, but they can learn, replicate, and act at a scale humans simply can’t compete with. When contextual thinking meets computational power, that’s not artificial intelligence, that’s real intelligence.
The trader who treats AI as a tool builds an edge. The one who treats it as an oracle builds a trap.
A Simple Manual for Thinking Right About AI in Trading
Never delegate understanding.
Let the machine calculate, but you must know why it acts. You can outsource the coding of a model, but never the architecture of your trading logic. The logic, the “why,” must remain human.
The basics still apply.
Machine learning doesn’t replace the foundations of trading, it only amplifies them. Risk management, diversification, position sizing, and discipline remain non-negotiable. A model can process data faster than you ever could, but it can’t understand exposure, capital allocation, or your personal tolerance for risk. Those are still your job.
Stay probabilistic.
The use of ML in trading doesn’t erase the hardest lesson of all: predicting prices is a false premise. The right question isn’t “Where will the market go?” but “How should I respond to what it does?” Now imagine the power of machine intelligence working within that probabilistic framework: a system designed to maximize your account’s expected value, not to guess Bitcoin’s price next month. That’s where the real explosion of potential lies.
Build systems that can evolve.
The future won’t belong to the trader with the smartest model, but to the one with the most adaptive one. And remember, you must be the most adaptive asset in your system. Markets evolve; your models must too. There’s no such thing as “build once and deploy forever.” In trading, anything that stops learning starts dying.
From the Illusion of Machine Intelligence to the Power of Human-Driven ML
Machine intelligence isn’t a new oracle, it’s a new instrument. In the wrong hands, it’s noise. In the right hands, it’s leverage. It can multiply insight, scale execution, and compound returns, but only when driven by an intelligent trader who understands its limits.
The trader understands, the machine executes. The trader teaches the machine; the latter amplifies the former’s reach.
In the end, it’s never the algorithm that wins, it’s the human who knows how to use it. And when both work together, one thinking, one learning, that’s not artificial intelligence anymore.
That’s compounded intelligence.
Using Liquidity and Chart Patterns to Predict Forex MovesHi
📘 Chart Patterns, Liquidity Flow, and Resistance in Forex Trading
In this guide we explore how to use **chart patterns**, **liquidity flow**, and **resistance areas** to enhance Forex trading strategies as defined here.
---
# 🧩 Chart Structure and Key Patterns
* **Liquidity Flow (Momentum):**
*Liquidity* here refers to the flow of price momentum. A **liquidity sweep** happens when price breaks through key levels, absorbing transactional activity and creating momentum. This flow often signals shifts in market direction and potential reversals.
* **Gap Closures:**
Price gaps (sudden candlestick jumps) often “fill” as the market returns to untraded areas. Traders watch for these gaps to provide potential targets or reversal points.
---
# 🧭 Market Structure and Momentum
* **Equal Highs & Lows:**
Equal lows act as **support**; when breached, they trigger liquidity-driven moves. Equal highs act as **resistance**, where repeated failure to break creates a strong seller presence, often leading to a reversal.
* **Momentum (MOM):**
Sharp momentum moves (labelled as “MOM”) signal potential market shifts. These moves often precede **liquidity sweeps** and can help traders anticipate upcoming price action.
---
# 💧 Liquidity and Order Flow
* **Bearish Candle Pressure:**
When price retraces to the **50% midpoint** of a dominant bearish candle, it can act as a resistance zone, where selling pressure resumes and liquidity is absorbed, pushing price lower.
---
#🔶 Harmonic and Fibonacci Relationships
* **Measured Moves:**
The relationship **X–A = B–C** represents harmonic patterns where price swings are proportional, helping traders project potential price extensions or reversals.
---
# 🧱 Resistance and Reversals
* **Equal Highs as Resistance:**
Areas of equal highs show price rejection, signaling a strong **resistance level**. These often precede **bearish corrections** as liquidity and momentum shift.
🎙️ Key Note:
**Liquidity flow** is the key to understanding price movement — it’s not just about where orders are sitting but about how momentum builds and moves through the market. Recognising this flow enhances your ability to trade with the market’s true intent.
Happy Trading,
Khiwe.
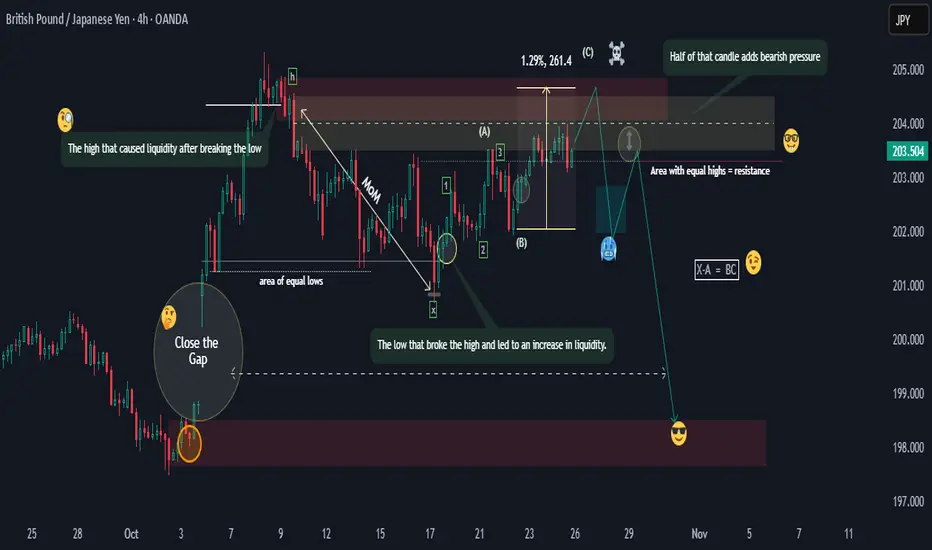
Graham's Formula for Intrinsic Value of a Stock➡ About Benjamin Graham
Benjamin Graham is widely known as the Father of Value Investing. He was a professor, economist, and mentor to great investors like Warren Buffett. Graham’s investment philosophy focused on buying stocks below their intrinsic value to ensure a margin of safety and protecting capital even when markets behave irrationally. His books The Intelligent Investor and Security Analysis remain timeless classics in the world of investing.
➡ His Formula to Calculate the Intrinsic Value of a Stock
Graham designed a simple mathematical model to estimate what a stock is truly worth- its intrinsic value.
Formula:
V=EPS×(8.5+2g)
Later, he modified it to account for changing interest rates:
V= /Y
Meaning of Each Value in the Formula
V: Intrinsic value or the fair value of the stock.
EPS: Earnings per share (trailing twelve months).
8.5: Base P/E ratio for a no-growth company.
g: Expected annual earnings growth rate (for next 7–10 years).
4.4: Average yield on high-grade corporate bonds when Graham proposed the formula.
Y: Current yield on AAA-rated corporate bonds (used to adjust for changing interest rate conditions).
➡ How to Calculate
Let' sunderstand the calculations with the help of an example of NVDA stock:
EPS= 3.5 (TTM)
Growth rate= 32.8 (next 3-5years)
Y= 4.09
All other values remain the same
V= / 4.09
V= 279
So, the intrinsic value of the stock would be around 279
Current price= 186
Difference= 67%
Hence the Formula suggests that the current price is still way below its fair value and hence buyable.
➡ Are these Too Aggressive Valuations?
Yes, it may be too optimistic. The term '2g' gives very high weightage to growth, which can inflate valuations quickly. In a world where corporate earnings growth is less predictable and global interest rates fluctuate, this approach may overvalue companies that appear to have strong growth potential on paper.
➡ Relevance in the Current Market Scenario
While Graham’s formula is historically important and a great conceptual framework for understanding valuation, it should not be used as a standalone tool today. Markets are far more complex and influenced by globalization, technology, inflation, and interest rate cycles.
A more balanced approach is to use Graham’s principles (margin of safety, valuation discipline) but rely on modern valuation models like Discounted Cash Flow (DCF) or Relative Valuation Ratios and treat the formula as a learning foundation rather than a precise valuation tool.
What do you think about this tool for calculating a stock's valuation?
Is it still relevant?
Do 🚀 comment 💬
Disclaimer: I am not a valuation analysis expert so apply your due diligence while investing. The stock example taken in this educational post is just for demonstration purpose and not a buy/sell recommendation.
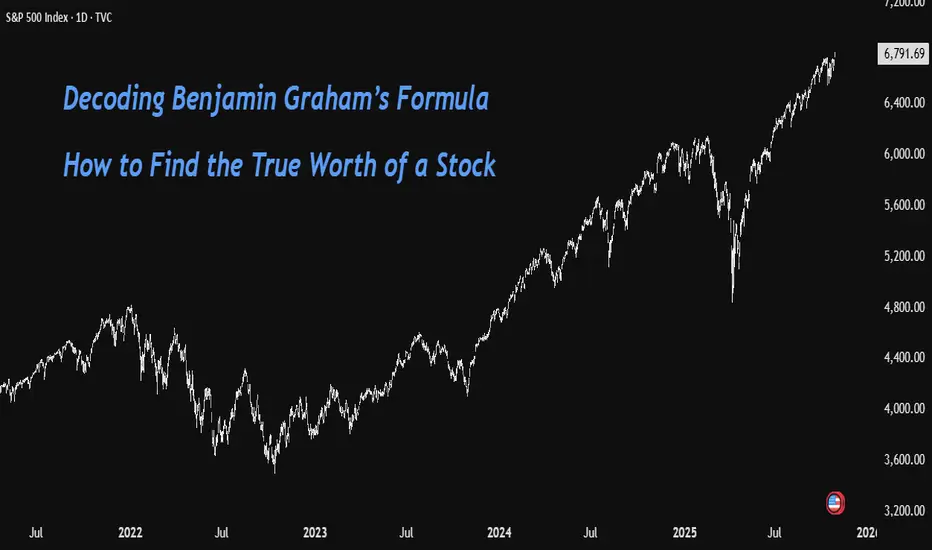
Types of TradersMany beginners confuse trading styles and end up mixing them. Here’s a short guide that helps you understand which approach might suit you best.
The trading world has its own language that can be hard to understand when you’re just getting started. Let’s take a look at the main trading styles and what they mean.
Scalping – active trading with lots of quick trades, often within minutes.
Day trading – dynamic style, a few trades during the day.
Swing trading – calm and patient, 2–5 trades per month.
Position trading – deliberate and steady, about one trade per quarter.
Investing – strategic, holding positions for 3 months or longer — sometimes for years.
With experience, most traders develop a mix of strategies. For example, investing might mean buying stocks or crypto you plan to pass down to your kids, or simply waiting for long-term targets.
Frequent trading gives good practice and helps you understand what style truly fits you. But over time, the number of trades usually goes down.
For me, a combination works best — intraday trading keeps me in tune with the market, while my investment positions stay focused on the bigger picture.
By the way — opening the chart, kicking the market door open with 10x leverage, and clicking buttons just to feel alive, YOLO and pray … that’s not a trading strategy.
That’s called dopamine gambling, and it belongs in a casino, not in your portfolio
And what about you — what’s your style?