Liquidity Sweep + FVG + RSIThis BCH/USDT 2H chart illustrates a textbook example of a liquidity sweep and reversal, backed by RSI confluence. Price repeatedly tested a horizontal resistance level, eventually triggering a breakout trap — enticing late buyers just before reversing.
The false breakout swept buy-side liquidity, trapping retail longs above resistance. Immediately after, price dropped back below the key level and formed a Fair Value Gap (FVG) — a common area where smart money re-enters positions. This signaled distribution rather than continuation.
Adding to the bearish confluence, RSI showed overbought conditions during the sweep, reinforcing that momentum was exhausted. Once liquidity was taken and RSI began dropping, a strong bearish move followed.
📉This setup combines multiple Smart Money Concepts:
🔁Liquidity engineering
🔁Breakout trap
🔁Fair Value Gap re-entry
🔁RSI confirmation
Community ideas

XAUUSD | Flipped Long Too Early – Lessons From a £25k Drawdown 📝 Tutorial Description:
Today I flipped long after catching a clean short from 3,434.
The idea made sense: liquidity sweep, OB reaction, bullish BOS on 5m.
But the entry? Too early. Overleveraged. No HTF confirmation.
Ended up staring at a –£25,605 drawdown 😬
⸻
🔍 What Went Wrong:
• 🧠 Good Idea, Bad Timing:
Price did sweep lows and show signs of a reversal…
…but NY volume hadn’t kicked in yet, and the 5m BOS wasn’t locked in.
• 📉 No Higher Timeframe Confluence:
I didn’t wait for structure to shift on the 15m or 1H — just jumped in on a 5m bounce.
• 💥 Position Size WAY too heavy:
Even with a valid idea, risking £25k on one trade = recipe for disaster. I broke my own risk rules.
⸻
🎯 What I Learned:
1. Wait for full confirmation — not just a reaction wick
2. Scale in small first, add on confirmation
3. Stick to my risk % — don’t size up because I “feel confident”
⸻
🔖 Tags:
#XAUUSD #TradingMistake #SmartMoneyConcepts #Overleveraged #Drawdown #TradingLessons #5mTrap #EmotionalDiscipline
⸻
💬 Closing Note:
Flipping early isn’t the crime — flipping with no plan and too much size is.
This was a humbling one. Sharing so someone else doesn’t repeat it.

Simple Swing Trading Strategy with Smart Money Concept Explained
I will share with you the essential basics of swing trading forex gold with Smart Money Concepts.
You will learn how to do swing trading with the best SMC strategy.
I will teach you to c ombine order blocks, liquidity zones and imbalances to spot accurate entries and confirmation signals.
If you just started learning swing trading Forex with Smart Money Concepts, I strictly recommend trading with the trend only.
The cases and examples that we will discuss will be strictly trend-following ones.
Swing Trading with SMC in Uptrend
For swing buying any forex pair, we will look for the market that is trading in a bullish trend.
To confirm that the market is rising, you will need to execute structure mapping and find a forex pair that updates Higher Highs HH and Higher Lows HL.
Above is the example how I confirmed that GBPUSD is bullish with structure mapping. You can see that the pair consistently updates the highs.
Once you identified a bullish pair, your next step will be to find the zone from where the next swing move will follow.
According to the rules, the market remains in uptrend till the price is staying above or on the level of the last Higher Low HL.
Here is such a zone on GBPUSD.
It is based on the last Higher Low and current price levels.
We will assume that buying orders will concentrate within that area and from that a bullish rally will follow.
The problem is that this area is extremely wide, and we can not just buy randomly within.
Our next step will be to find liquidity zones within.
To buy, we need demand areas.
I found 4 price action based historic demand zones on GBPUSD.
We will need to wait for the test of one of these zones and then wait for an order block - a place where smart money are placing their buy orders.
The problem is that we don't know in which of these areas the order block is, so we will need to wait for tests of these zones and a consequent imbalance to confirm it.
To confirm a bullish imbalance for swing trading Forex, I recommend analyzing a 4H time frame after a test of a demand zone.
According to Smart Money Concepts, a bullish imbalance can be any sign of strength of the buyers : bullish breakout of a vertical/horizontal resistance, change of character, high momentum bullish candle, bullish price action pattern, etc.
An order block on GBPUSD was confirmed with a breakout of a resistance line of a falling channel on a 4H time frame.
That was the signal that Smart Money are buying, and that is your signal to open a swing long trade.
You place a buy position then with a stop loss below the order block and a target - at least a current high.
Swing Trading with SMC in Downtrend
For swing selling any forex pair, you will need to find a market that is trading in a bearish trend.
I suggest applying structure mapping to identify such a pair.
It simply should update Lower Lows LL and Lower Highs consistently.
USDCAD is trading in a bearish trend.
Structure mapping helps to easily confirm that.
Then, we will need to identify the zone from where the next bearish wave will start.
According to Smart Money Concepts structure mapping rules, the market remains bearish till the price is staying below or on the level of the last Lower High LH.
That's such a zone on USDCAD.
It is based on current prices and the last Lower High.
We will assume that selling orders will be distributed along the entire lenth of our zone.
Of course, we can not sell randomly within that zone because it is relatively extended.
Our next task will be to find liquidity supply zones within.
I found 2 price action based supply zones within our underlined area.
Before we sell, we will need to find an order block.
A place from where smart money are selling big.
To spot that, I suggest waiting for a test of one of our supply zones and wait for a bearish imbalance on a 4H time frame.
According to SMC, a bearish imbalance can be a bearish high momentum candle, a bearish CHoCH, a bearish price action pattern, a bearish breakout of a horizontal/vertical support , etc.
You can see that a lower supply zone was tested on USDCAD.
Our bearish order block confirmation is a bearish Change of Character, a formation of a high momentum bearish candle and a breakout of a rising trend line.
After that we can open a swing sell position and expect a bearish movement at least to a current low.
Stop loss should lie strictly above the order block.
TP should be at least a c urrent low.
That is how a trade should be executed on USDCAD pair.
Remember that there is no guarantee that the order block will be within a liquidity zone. You should learn to track the signs of smart money and their operations.
A proper combination of a trend analysis, liquidity zones and order block is the essential basis of a profitable swing trading Forex.
Mastering that, practice recognizing the imbalances and confirmations for spotting the best swing trading entries.
❤️Please, support my work with like, thank you!❤️
I am part of Trade Nation's Influencer program and receive a monthly fee for using their TradingView charts in my analysis.
Look First, Then LeapIn trading, how you prepare matters more than how you react. The phrase “Look first, then leap” reminds traders to avoid impulsive decisions and instead focus on proper analysis, planning, and risk control. Whether you're trading stocks, forex, crypto, or commodities, this principle can save you from painful losses and build a foundation for long-term success.
Let’s break down what it really means to “look first,” and how applying this mindset can improve your trading discipline.
✅Preparation Beats Emotion
Before entering any trade, a trader should ask: What is this trade based on? Logic or emotion?
🔹 Control Impulsive Decisions
Most losing trades happen when people act on gut feelings, FOMO, or after seeing a sudden price spike. But excitement is not a strategy; analysis is.
🔹 Check the Basics First
-What is the market trend? (uptrend, downtrend, or sideways?)
-Are you trading with or against the trend?
-Are there any upcoming news events that might impact the market?
Taking a moment to “look first” gives clarity and filters out low-probability trades.
✅ Trade Only When There’s a Setup
The best trades often come from waiting for the right moment, not forcing entries.
🔹 Identify Clear Patterns
Before jumping in, confirm your strategy setup:
-Is it a breakout or a fakeout?
-Are key support/resistance levels respected?
-Is volume supporting the move?
🔹 Use Confirmation Tools
Indicators like RSI, MACD, and moving averages can support your decision. Price action and patterns like triangle, channel, and flag also provide valuable clues.
Look first means not reacting to the first move; wait for the follow-through.
✅ Always Define Risk and Reward
Entering a trade without a defined stop-loss or target is like jumping into water without checking its depth.
🔹 Use a Risk-Reward Ratio
Before leaping into a trade, ask yourself:
-What am I risking?
-What can I gain?
Aim for a minimum risk-reward ratio of 1:2 or 1:3 to stay profitable even with a lower win rate.
🔹 Position Sizing Matters
Know how much of your capital to allocate. Using 1-2% of your capital per trade helps manage losses and avoid emotional pressure.
✅ Adjust for Market Conditions
Just because you’ve seen success in one type of market doesn’t mean your strategy will always work.
🔹 Trending vs. Ranging Markets
-Trend-following strategies work well in strong trends.
-Mean-reversion or breakout-fade strategies work better in sideways markets.
🔹 Check for Major News or Events
Earnings reports, central bank meetings, or geopolitical events can change everything in seconds. Before entering a trade, look at the calendar.
Adapting to market conditions is part of looking first.
✅ Use a Trading Plan, Not Just a Feeling
Every trade should follow a plan, not just “I think this will go up.”
🔹 What Should Your Plan Include?
Entry and exit rules
-Stop-loss and take-profit levels
-Criteria for valid setups
-Timeframes and trading hours
A plan brings structure and consistency, reducing emotional decisions.
✅ Journaling and Reviewing Trades
Looking first also means learning from the past.
🔹 Keep a Trading Journal
Log every trade entry, exit, reason, emotion, and outcome. This helps you spot mistakes and patterns in your behavior.
🔹 Review Regularly
After a drawdown or losing streak, review your last 10–20 trades. Was your strategy sound? Were you disciplined? Did you look before you leaped?
Improvement comes from reflection and correction.
✅ Be Mentally Ready Before Every Trade
Looking first also means checking your internal state.
🔹 Ask Yourself Before Trading:
-Am I calm and focused?
-Am I trying to recover a loss?
-Am I trading because I’m bored or emotional?
If your mindset is off, step away. A bad state leads to bad decisions—even with a good strategy.
✅Backtest and Practice Before Going Live
Before risking real money, test your setup thoroughly.
🔹 Why Backtesting Helps
It lets you see how your system performs on historical data. This builds confidence and filters out weak strategies.
🔹 Demo Trading Is Smart, Not Weak
Trading in a demo account before going live helps you learn execution, order management, and emotional control—without financial damage.
✅ Protect Capital First, Trade Second
Your first goal isn’t to make money, it’s to stay in the game.
🔹 Survive First, Then Thrive
Big losses can take weeks or months to recover. That’s why looking first is critical—it prevents careless trades that damage your capital.
✅Final Word: Be the Trader Who Waits
The market rewards those who are patient, disciplined, and prepared. Anyone can open a trade, but only those who look first truly understand what they’re doing.
Before your next trade, ask yourself:
“Do I have a clear reason, a defined risk, and the right mindset? Or am I just reacting?”
Because in trading, it’s not how many trades you take, it’s how many good trades you wait for.
In trading, success doesn't come from speed; it comes from clarity, preparation, and discipline. The principle “Look first, then leap” serves as a constant reminder to slow down, observe, analyze, and plan before taking action. It’s a mindset that separates the disciplined trader from the emotional speculator.
Every trade you take should be backed by logic, not impulse. Whether it’s identifying the right setup, managing your risk, or simply being patient enough to wait for confirmation, looking first gives you control in a world that thrives on chaos.
In the end, trading isn’t about making quick money—it’s about making the right decisions consistently. So before your next trade, take a breath, do your research, and ask yourself:
“Am I truly ready to leap, or do I need to look one more time?”
That one extra moment of reflection could be the difference between a lesson and a profit.
Cheers
Hexa🧘♀️
Chart Image Credit: TradingView
Your Technical Analysis Improved, But Your Account Didn't. Why?You're learning more. Your charts look cleaner.
But somehow... your losses just keep getting worse?
If that feels familiar, this breakdown might explain exactly why.
Hello✌️
Spend 3 minutes ⏰ reading this educational material.
🎯 Analytical Insight on Solana:
BINANCE:SOLUSDT is testing a key trendline and daily support that aligns with Fibonacci levels 🔍. A clear break above the psychological resistance at $210 could trigger at least a 16% rally, targeting $230 🚀.
Now, let's dive into the educational section,
🧬 The Precision Trap
The better your analysis gets the narrower your entries become.
You start avoiding trades unless every single box is ticked. But guess what Markets don’t tick boxes. They break them.
Overanalysis creates tighter stops smaller buffers and a mind that’s too afraid to pull the trigger.
💰 The Hidden Greed in Smart Trades
Better analysis often brings a false sense of confidence. You expect more precision more profit.
This turns into silent greed masked as logic. Suddenly you risk bigger positions because this one is obvious.
But pros don't risk more when they’re more confident. They risk consistently.
💭 The Mind That Blocks Your Profits
You didn’t lose because you didn’t know. You lost because you knew too much and became a slave to it.
When your brain seeks confirmation not clarity it sabotages trades that were ready to work.
Don't let analysis chain you to hesitation.
🔄 Analysis or Addiction
Ask yourself honestly
Are you using your analysis to take action or to avoid it
Charts should guide you not paralyze you. If you need six signals to feel safe you’re not analyzing you’re hiding.
🧃 Every Chart Has a Bias
What looks like a sell to you might be a buy to someone else.
Why Perspective. Some buy the bounce others short the breakdown.
So if your top-tier analysis still leads to losses maybe it's time to stop upgrading tools and start upgrading your lens.
🧨 The Overanalysis Spiral
Your brain can’t juggle thirty signals. But most traders try anyway.
This doesn’t make you smarter. It makes you slower more anxious and emotionally drained.
Good trading isn’t about more info. It’s about clearer action.
🧱 The Mind That Won’t Let You Win
The more you lean on your indicators the more you fear breaking their rules.
You skip solid trades just because one tool says maybe not yet.
At that point it’s not risk management. It’s dependency. Let tools guide not dominate you.
🛠️ TradingView Tools That Help Or Hurt Your Mindset
It’s not about what tools you use. It’s how you use them.
Here are a few tools that when used right can actually improve both your decision-making and emotional control:
Session Volume and VWAP
Don’t just chase setups blindly. Check price versus VWAP. Often entries you feel are great are just late reactions to intraday rebalancing.
RSI and Auto Divergence
Don’t focus on RSI values alone. Use divergence indicators that highlight hidden bullish or bearish signals. Many traders miss moves by ignoring the tension RSI reveals.
Long Short Position Tool
Try using this for mental reps. Plot fake trades. Watch how the market behaves without risking capital. Over time you’ll train your brain not just your account.
These tools won’t fix your psychology but they’ll mirror it. And that’s where real change begins
🎯 Final Thoughts
Great analysts don’t trade everything they understand.
They understand what not to trade.
If better charts aren't bringing better results stop upgrading your screen and start rewiring your mindset.
✨ Need a little love!
We pour love into every post your support keeps us inspired! 💛 Don’t be shy, we’d love to hear from you on comments. Big thanks , Mad Whale 🐋
📜Please make sure to do your own research before investing, and review the disclaimer provided at the end of each post.

Protect Capital First, Trade SecondIn the world of trading, mastering technical analysis or finding winning strategies is only part of the equation. One of the most overlooked but essential skills is money management. Even the best trading strategy can fail without a solid risk management plan.
Here’s a simple but powerful money management framework that helps you stay disciplined, protect your capital, and survive long enough to grow.
✅1. Risk Only 2% Per Trade
The 2% rule means you risk no more than 2% of your total capital on a single trade.
-Example: If your trading account has $10,000, your maximum loss per trade should not exceed $200.
-This protects you from large losses and gives you enough room to survive a losing streak without major damage.
A disciplined approach to risk keeps your emotions under control and prevents you from blowing your account.
✅2. Limit to 5 Trades at a Time
Keeping your number of open trades under control is essential to avoid overexposure and panic management.
-A maximum of 5 open trades allows you to monitor each position carefully.
-It also keeps your total account risk within acceptable limits (2% × 5 trades = 10% total exposure).
-This rule encourages you to be selective, focusing only on the highest quality setups.
Less is more. Focus on better trades, not more trades.
✅3. Use Minimum 1:2 or 1:3 Risk-Reward Ratio
Every trade must be worth the risk. The Risk-Reward Ratio (RRR) defines how much you stand to gain compared to how much you’re willing to lose.
-Minimum RRR: 1:2 or 1:3
Risk $100 to make $200 or $300
-This allows you to be profitable even with a win rate below 50%.
Example:
If you take 10 trades risking $100 per trade:
4 wins at $300 = $1,200
6 losses at $100 = $600
→ Net profit = $600, even with only 40% accuracy.
A poor RRR forces you to win frequently just to break even. A strong RRR gives you room for error and long-term consistency.
✅4. Stop and Review After 30% Drawdown
Drawdowns are a part of trading, but a 30% drawdown from your account's peak is a red alert.
When you hit this level:
-Stop trading immediately.
-Conduct a full review of your past trades:
-Were your losses due to poor strategy or poor execution?
-Did you follow your stop-loss and risk rules?
-Were there changes in the market that invalidated your setups?
You must identify the problem before you continue trading. Without review, you risk repeating the same mistakes and losing more.
This is not failure; it’s a checkpoint to reset and rebuild your edge.
Final Thoughts: Survive First, Thrive Later
In trading, capital protection is the first priority. Profits come after you've mastered control over risk. No trader wins all the time, but the ones who respect risk management survive the longest.
Here’s your survival framework:
📉 Risk max 2% per trade
🧠 Limit to 5 trades
⚖️ Maintain minimum 1:2 or 1:3 RRR
🛑 Pause and review after 30% drawdown
🧘 Avoid revenge trading and burnout
Follow these principles and you won't just trade, you'll trade with discipline, confidence, and longevity.
Cheers
Hexa
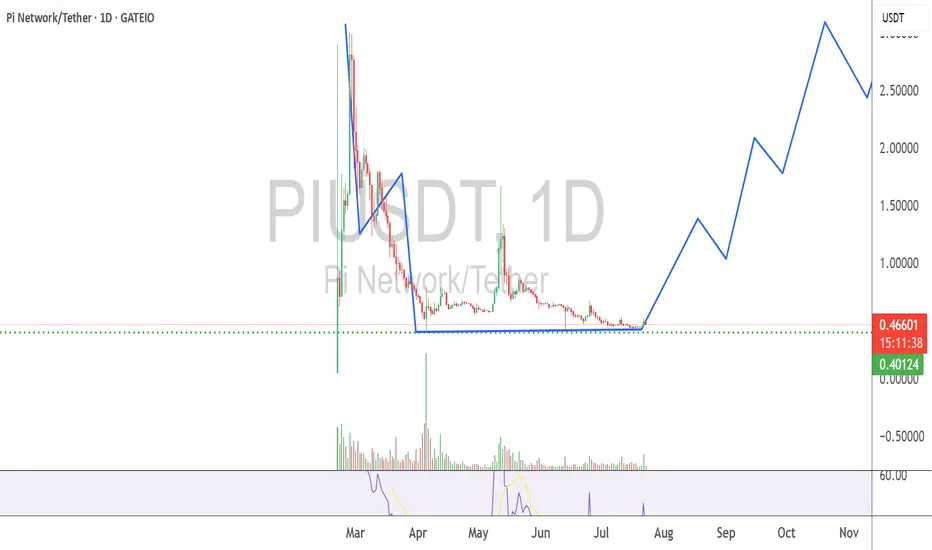
What does the future hold for Pi Network?Pi Network Coin (PI) is the native cryptocurrency of the Pi Network, a decentralized blockchain project designed to make cryptocurrency mining and usage accessible to everyday people via mobile devices. Unlike traditional cryptocurrencies like Bitcoin that rely on energy-intensive mining hardware, Pi Network allows users to mine PI coins on their smartphones using a lightweight, mobile-friendly process that does not drain battery life or require costly equipment.
What Could make Pi Network Grow (Factors affecting price)
Short-term price is highly volatile, influenced by token unlock schedules, exchange trading volumes, and speculative sentiment.
Medium-to-long term potential depends on the speed and success of Mainnet open trading launch, exchange listings on major platforms, and real-world PI ecosystem adoption including DeFi and decentralized applications.
Risks stem from regulatory uncertainties, possible high selling pressure from early miners, and slow token utility development.
Positive catalysts include expanding app ecosystem, mainstream exchange listings, and growing merchant/payment acceptance.
As of late July 2025, the PI price is subject to these dynamic factors, with market price hovering around $0.0006–$0.73 depending on exchange and trading pair, showing both significant upside if adoption accelerates and downside from current bearish technical pressures.
Gold CFD Trading: Practical Steps and Influencing Factors Gold CFD Trading: Practical Steps and Influencing Factors
Gold trading in forex offers a dynamic and potentially rewarding opportunity for traders. This article delves into the essentials of trading gold, from understanding its unique position as both a commodity and a financial asset to its price determinants and how to trade it.
Understanding Gold as a Trading Asset
In international gold trading, gold's role extends beyond being just a precious metal; it is a unique asset class. Its intrinsic value and universal appeal have made gold a cornerstone in financial markets for centuries. Unlike many other commodities, gold maintains its value not just in times of economic stability but also during volatility. This dual nature arises from its status as both a tangible commodity and a symbol of wealth, leading to its classification as a so-called safe-haven asset.
Investors often turn to gold when currencies and other markets face instability. Additionally, gold's relatively limited supply, juxtaposed with its consistent demand across industries and jewellery markets, ensures its lasting relevance in the trading world. Understanding these characteristics of gold is crucial for forex traders, as they form the foundation of its behaviour and pricing in the financial markets.
Fundamentals of Gold Trading
For those looking to learn to trade gold, it's essential to grasp the basics of how gold is traded. Primarily, gold trading is conducted through Contracts for Difference (CFDs), a popular derivative that allows traders to speculate on its price movements without owning the physical metal.
CFDs offer a flexible way to engage in gold trading, providing the ability to trade both rising and falling markets. This versatility is often cited as the best way to trade gold, especially for those who prefer short-term positions. Unlike gold stock trading, where investors buy shares in gold-related companies, gold CFD trading focuses directly on the price movements of the metal itself.
Via CFDs, gold is typically traded against the US dollar, denoted as XAU/USD. Here, XAU represents one troy ounce of gold, a standard unit of measurement in the precious metals market. Traders analyse market trends and use leverage to potentially enhance their opportunities. However, leverage is a double-edged sword, potentially magnifying losses.
Factors Influencing Gold Prices
Understanding the factors that influence gold prices is critical for anyone engaged in trading this precious metal. Here are key elements that traders usually monitor:
1. Economic Indicators: Key economic data such as GDP growth rates, employment figures, and inflation reports can significantly impact prices. Typically, weak economic performance or high inflation rates increase gold's appeal as a hedge against currency devaluation.
2. Monetary Policy: Central banks' decisions on interest rates and quantitative easing play a major role. Lower interest rates can decrease the opportunity cost of holding non-yielding assets like gold, thus boosting its demand.
3. Currency Strength: The strength of the US dollar is inversely related to gold prices. As gold is paired with the US dollar, rising USD will make gold cheaper.
4. Geopolitical Events: Political uncertainties and global crises often drive investors towards gold as a so-called safe-haven asset. Events causing economic instability can lead to a surge in prices.
5. Market Demand: Demand from industries like technology and jewellery and investment demand significantly influence prices.
6. Gold Trading News: News and reports related to mining, supply constraints, or large market transactions can immediately affect prices.
How to Trade Gold
Trading gold effectively requires a combination of well-chosen strategies, relevant indicators, and insights from trading signals. A comprehensive gold trading tutorial is a great starting point for understanding the mechanics of the market.
One of the best strategies to trade gold is following the trend. This involves identifying the direction of the market trend and making trades in alignment with this trend. For instance, if gold is on an upward trend, a trader might take a long position, and vice versa for a downward trend.
Regarding the best indicators for gold trading, traders often rely on tools like Moving Averages to identify trends, the Relative Strength Index (RSI) for overbought or oversold conditions, and MACD for momentum and trend changes.
Additionally, utilising gold trading signals can be effective. These signals, provided by market analysts or automated systems, offer assumptions on when to enter or exit trades based on market analysis. However, traders usually use these signals as a guide rather than a definitive command, combining them with their own research and risk management strategies.
Practical Steps for Gold Trading
Starting your journey in gold trading can be both exciting and challenging. Here are some practical steps to help you navigate this market:
- Educate Yourself: Before diving in, invest time in understanding the gold market. You can read books, watch webinars, and follow gold trading tutorials.
- Start Small: Begin with smaller investments to limit risk as you learn the ropes.
- Use Demo Accounts: Practice with demo accounts to gain experience without financial risk.
- Keep Up with News: Stay updated with global economic news, as they can significantly impact prices.
- Risk Management: Always use stop-loss orders to minimise potential losses.
- Review and Learn: Regularly review your trades to learn from successes and mistakes.
The Bottom Line
Embarking on your gold trading journey can be a transformative experience. With the knowledge and strategies outlined in this article, you can be well-equipped to navigate the market. Happy trading!
This article represents the opinion of the Companies operating under the FXOpen brand only. It is not to be construed as an offer, solicitation, or recommendation with respect to products and services provided by the Companies operating under the FXOpen brand, nor is it to be considered financial advice.
People don't like the truth! Let's be honest, people don't like honesty. They prefer ideas that affirm their own beliefs.
When I read articles and posts from newer traders, it's often from a place of "all in" diamond hands and the notion that things go up forever.
I've been a trader for over 25 years now, and the game isn't about making a quick buck, it's about making money over and over again. This got me thinking, the issue is when you deal with a small account you require leverage, small timeframes and of course the "shit" or bust mindset. If you lose a thousand dollars, $10,000 even $100,000 - what does it matter? That's no different than a game of poker in Vegas.
The idea of being 80% in drawdown, is alien to me. The idea of one trade and one win is also a crazy notion.
Instead of playing with the future, there is an easier way to work. This isn't about slow and boring, it's about psychology and discipline. 10% returns on a million-dollar account isn't all that difficult. Instead of aiming for 300x returns on an alt coin (due to the account size being tiny) You can make less of a percentage gain with a larger account size.
In terms of psychology - the word " HOPE " is used, way too often, it's used when you hope a stock or the price of Bitcoin goes up, it's used when you hope the position comes back in your favour, it's used when you want your 10,000 bucks to double.
This isn't trading, it's gambling.
The truth is, it's not the winners that make you a good trader. It's the way you deal with the losses.
Once you learn proper risk management, a downtrend in a market move is a 1-2% loss coupled with a new opportunity to reverse the bias.
As a disciplined trader, the game is played differently.
Let's assume you don't have $100k spare - prop firms are a great option, OPM = other people's money.
Remove the risk and increase the leverage, all whilst trading with discipline.
The market goes through many phases, cycles and crashes.
You don't always need something as catastrophic to take place, but if you are all in on a position. You need to understand that losses can be severe and long-lasting.
When everyone sees an oasis in the desert, it's often a mirage.
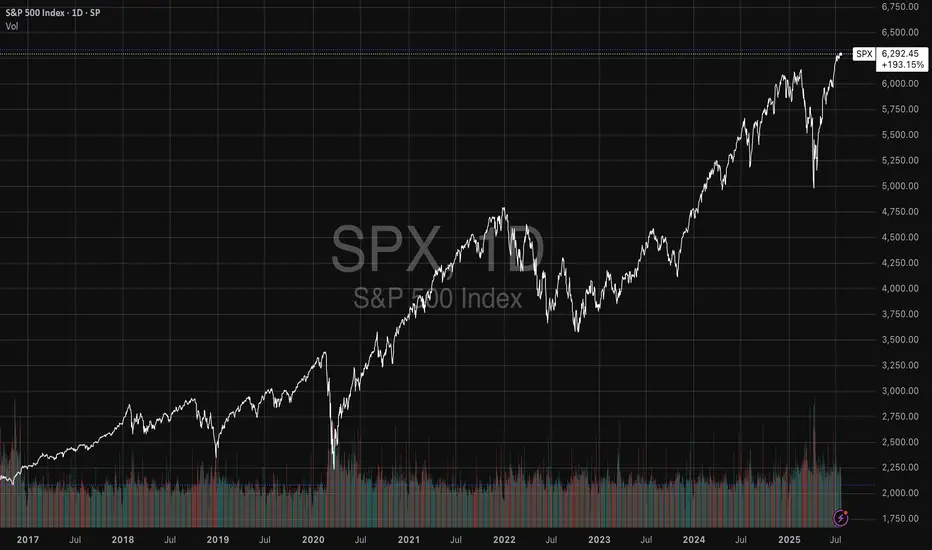
You only have to look at the Japanese lesson in 1989, when the Nikkei was unstoppable-until it wasn't. For that short space in time, everyone was a day trader, housewives to taxi drivers.
Everyone's a genius in a Bull market.
Then comes the crash. The recovery time on that crash?
34-years!!!
I have covered several aspects of psychology here on TradingView;
When it comes to trading, if you are able to keep playing. It's a worthwhile game. If you are gambling, it's a game whereby the house often wins.
Right now, stocks are worth more than their earnings. Gold is up near all-time highs, crypto, indices the same.
All I am saying is if you are all in. Be careful!
Disclaimer
This idea does not constitute as financial advice. It is for educational purposes only, our principal trader has over 25 years' experience in stocks, ETF's, and Forex. Hence each trade setup might have different hold times, entry or exit conditions, and will vary from the post/idea shared here. You can use the information from this post to make your own trading plan for the instrument discussed. Trading carries a risk; a high percentage of retail traders lose money. Please keep this in mind when entering any trade. Stay safe.
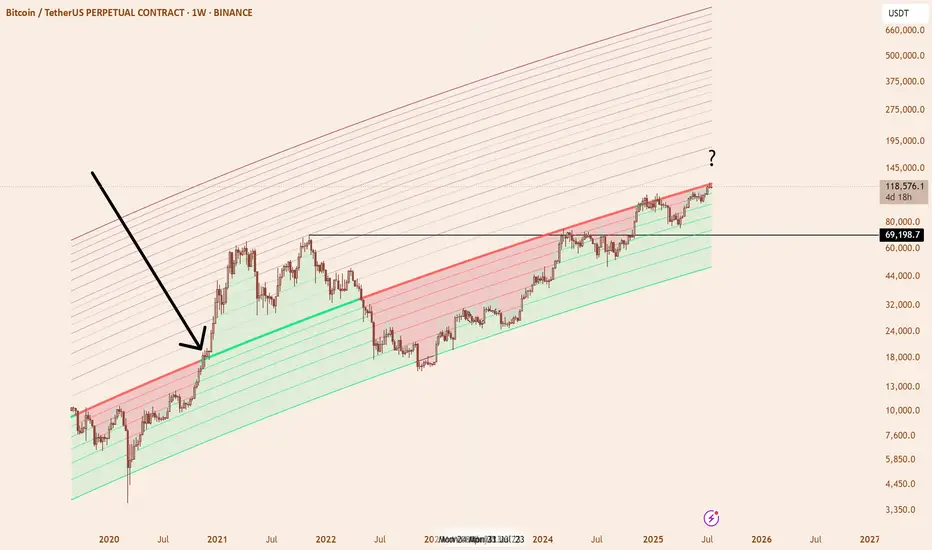
Power Law GrowthWhat you’re seeing is a Power‑Law Growth Corridor plotted over the weekly BTC/USDT price. In essence, it’s a dynamically‑sloped channel built on a power‑law fit of price vs. time, rather than the usual straight‐line
Bitcoin: Forecasting the Cycle ATHBitcoin has set a new all-time high this July, continuing the upward cycle tied to the spring 2024 halving. The decline in bitcoin dominance since early July has sparked a minor altcoin season. On this topic, I invite you to revisit my latest crypto analyses in the Swissquote market analysis archive. You can also subscribe to our account to receive alerts every time I publish a new crypto market analysis for Swissquote.
By clicking on the image below, you can read my latest perspective on Ether’s outperformance, which I now expect to last until the end of the cycle.
In this new article, I’ll address an important subject: the final top price for Bitcoin in this 2025 cycle. I’ll publish a separate article soon regarding timing. Today, I present three tools to combine in order to define a target zone for Bitcoin’s final cycle high by year-end.
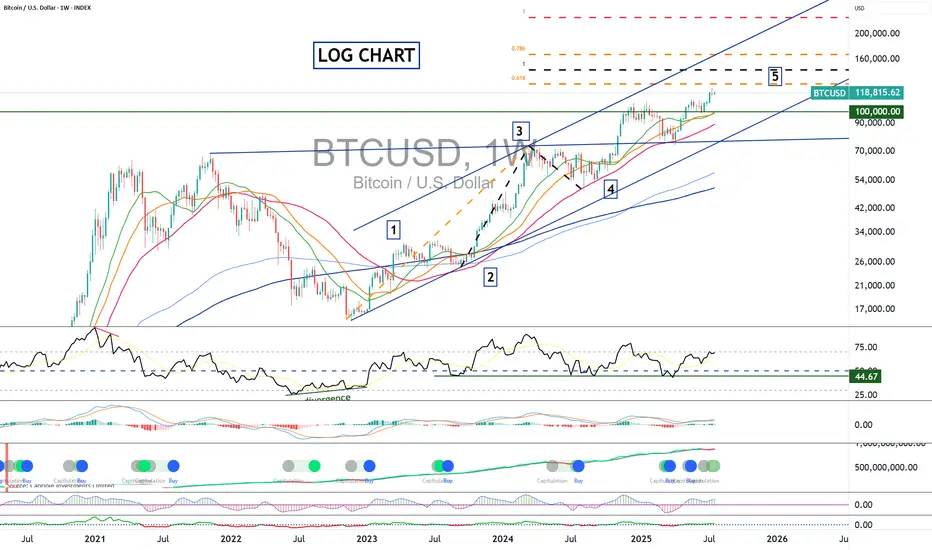
1) Elliott Wave Technical Analysis on a Logarithmic Scale
Bitcoin is currently building wave 5 of the bullish cycle that started in autumn 2022 around $15,000. To calculate theoretical targets for wave 5, we use Fibonacci extensions, particularly projections from wave 3 and from the bottom of wave 1 to the top of wave 3. This gives a target range between $145,000 and $170,000.
2) Pi Cycle Top Prediction Tool
The Pi Cycle Top is based on the interaction of two moving averages: the 111-day MA and the 350-day MA multiplied by 2. Historically, a bullish crossover of the 111 MA above the 2×350 MA preceded the market peaks of 2013, 2017, and 2021 by a few days. This tool captures late-stage bull market speculation but can give false signals when used alone, hence the need for multiple approaches. The current 2×350-day MA stands at $175,000.
3) Terminal Price Tool
Developed by analyst Willy Woo, Terminal Price is an on-chain model based on Bitcoin’s fundamental network data. It combines the Price-to-Thermocap Ratio (market value vs cumulative mining cost) with a logarithmic metric to estimate a theoretical ceiling. Unlike the Pi Cycle Top, it does not rely on price action but on network economic activity, making it complementary. Terminal Price currently trends around $200,000.
Used together, these three approaches can help identify likely cycle top zones. The Pi Cycle Top signals excess momentum through price dynamics, while Terminal Price provides a more fundamental upper bound. Their convergence with Elliott wave analysis and Fibonacci extensions increases the probability that the final cycle top will occur by late 2025 in a range between $145,000 and $200,000.
DISCLAIMER:
This content is intended for individuals who are familiar with financial markets and instruments and is for information purposes only. The presented idea (including market commentary, market data and observations) is not a work product of any research department of Swissquote or its affiliates. This material is intended to highlight market action and does not constitute investment, legal or tax advice. If you are a retail investor or lack experience in trading complex financial products, it is advisable to seek professional advice from licensed advisor before making any financial decisions.
This content is not intended to manipulate the market or encourage any specific financial behavior.
Swissquote makes no representation or warranty as to the quality, completeness, accuracy, comprehensiveness or non-infringement of such content. The views expressed are those of the consultant and are provided for educational purposes only. Any information provided relating to a product or market should not be construed as recommending an investment strategy or transaction. Past performance is not a guarantee of future results.
Swissquote and its employees and representatives shall in no event be held liable for any damages or losses arising directly or indirectly from decisions made on the basis of this content.
The use of any third-party brands or trademarks is for information only and does not imply endorsement by Swissquote, or that the trademark owner has authorised Swissquote to promote its products or services.
Swissquote is the marketing brand for the activities of Swissquote Bank Ltd (Switzerland) regulated by FINMA, Swissquote Capital Markets Limited regulated by CySEC (Cyprus), Swissquote Bank Europe SA (Luxembourg) regulated by the CSSF, Swissquote Ltd (UK) regulated by the FCA, Swissquote Financial Services (Malta) Ltd regulated by the Malta Financial Services Authority, Swissquote MEA Ltd. (UAE) regulated by the Dubai Financial Services Authority, Swissquote Pte Ltd (Singapore) regulated by the Monetary Authority of Singapore, Swissquote Asia Limited (Hong Kong) licensed by the Hong Kong Securities and Futures Commission (SFC) and Swissquote South Africa (Pty) Ltd supervised by the FSCA.
Products and services of Swissquote are only intended for those permitted to receive them under local law.
All investments carry a degree of risk. The risk of loss in trading or holding financial instruments can be substantial. The value of financial instruments, including but not limited to stocks, bonds, cryptocurrencies, and other assets, can fluctuate both upwards and downwards. There is a significant risk of financial loss when buying, selling, holding, staking, or investing in these instruments. SQBE makes no recommendations regarding any specific investment, transaction, or the use of any particular investment strategy.
CFDs are complex instruments and come with a high risk of losing money rapidly due to leverage. The vast majority of retail client accounts suffer capital losses when trading in CFDs. You should consider whether you understand how CFDs work and whether you can afford to take the high risk of losing your money.
Digital Assets are unregulated in most countries and consumer protection rules may not apply. As highly volatile speculative investments, Digital Assets are not suitable for investors without a high-risk tolerance. Make sure you understand each Digital Asset before you trade.
Cryptocurrencies are not considered legal tender in some jurisdictions and are subject to regulatory uncertainties.
The use of Internet-based systems can involve high risks, including, but not limited to, fraud, cyber-attacks, network and communication failures, as well as identity theft and phishing attacks related to crypto-assets.
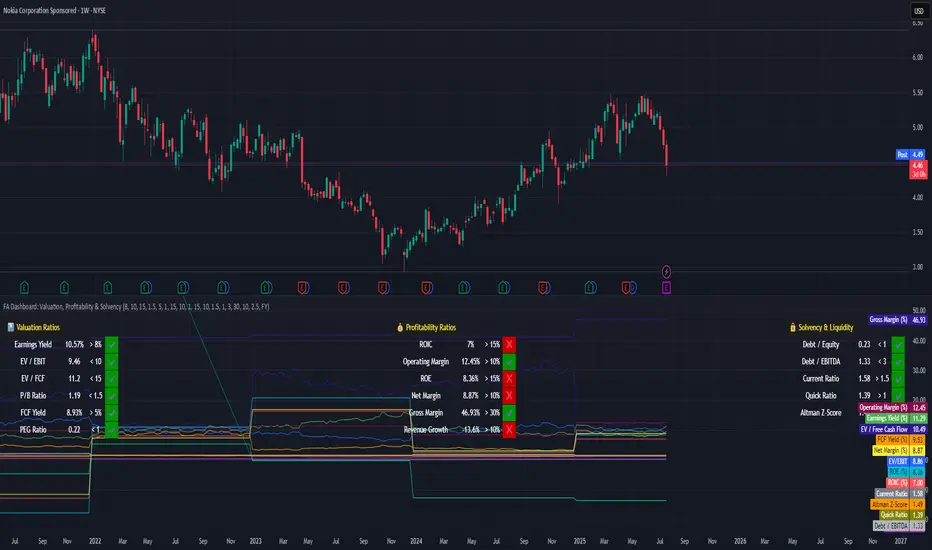
How to Evaluate Companies with a Fundamental Dashboard**Tutorial: How to Evaluate Companies with a Fundamental Dashboard (Example: Nokia)**
This tutorial explains how to use a custom-built dashboard in TradingView to evaluate companies based on key financial dimensions: **Valuation**, **Profitability**, and **Solvency & Liquidity**.
---
🛠 **How to Use This Tool**
This dashboard is meant to be an educational visual filter for fundamental analysis. Here’s how you can use it:
1. Add the script to any stock chart in TradingView.
2. Choose your preferred data period: annual (FY) or quarterly (FQ).
3. Adjust the thresholds in the script settings to reflect your investment approach.
4. The dashboard displays 17 key financial ratios grouped into three categories.
5. Each metric is evaluated visually with ✔️ (meets threshold) or ❌ (falls short).
6. Use this dashboard to identify companies worth deeper analysis — not to make automatic decisions.
---
📊 **Understanding the Dashboard Sections**
### 🔹 Valuation Metrics
Used to assess whether a stock appears undervalued based on price-to-value fundamentals:
- Earnings Yield
- EV/EBIT, EV/FCF
- P/B Ratio
- Free Cash Flow Yield
- PEG Ratio
### 💰 Profitability Metrics
Evaluate how efficiently the company turns revenue into profit:
- ROIC, ROE
- Operating, Net, and Gross Margins
- Revenue Growth
### 🔒 Solvency & Liquidity
Assess financial strength and balance sheet resilience:
- Debt/Equity, Debt/EBITDA
- Current Ratio, Quick Ratio
- Altman Z-Score
---
📍 **Case Study: Nokia (Ticker: NOK)**
This tutorial applies the dashboard to Nokia to demonstrate how to interpret results:
- ✅ **Valuation is strong**: Most metrics meet or exceed typical value thresholds.
- ⚠️ **Profitability shows weaknesses**: ROIC and revenue growth fall below expectations.
- 💪 **Solvency is healthy**: Debt is under control, though Altman Z-Score signals some risk.
This example helps show how the tool highlights strengths and red flags at a glance.
---
🎯 **Key Takeaway**
This dashboard is not a signal generator — it’s a thinking aid.
Its purpose is to help investors explore company fundamentals visually and consistently. The thresholds are customizable, and the tool encourages deeper due diligence.
---
⚠️ **Educational Disclaimer**
This tutorial is for educational purposes only. It does **not** provide investment advice or recommendations.
It is intended to demonstrate how to use a script to organize and interpret fundamental financial data.
Always do your own research and exercise independent judgment before making any financial decisions.
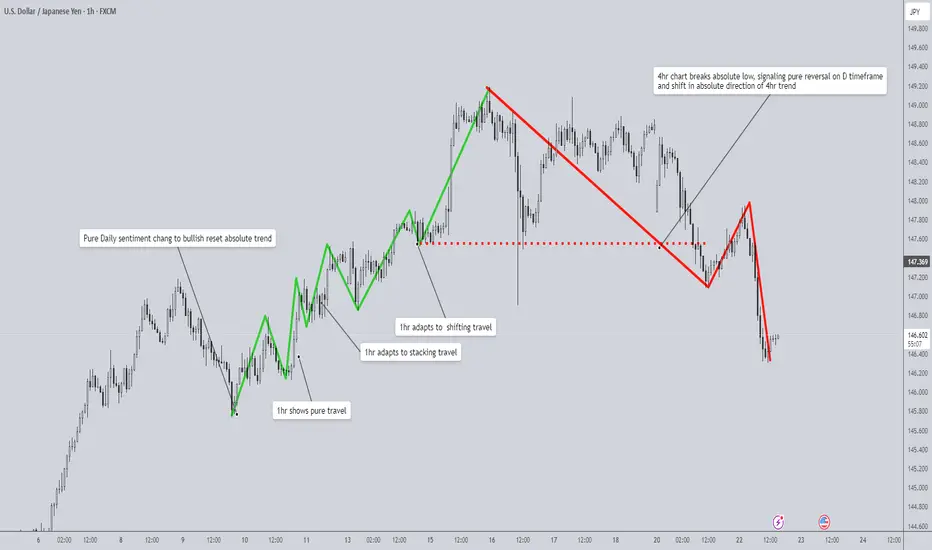
Market Travel: An Adaptive Framework for Tracking Structure🧭 Understanding Market Travel: An Adaptive Framework for Tracking Structure Manually
Market structure can be one of the most challenging patterns to read. There are tools and methods to help interpret it, but none are absolute. As market speed and volatility shift, so does its behavior. That’s why it’s important to move beyond rigid definitions and start understanding how price travels through the market.
What Is Travel?
“Travel” is a concept I developed through personal study and chart work. As price moves, it naturally forms pullbacks—temporary dips toward the weak side—and breaks—moves that close beyond the strong side. These are the two critical phases that form the backbone of market structure.
While most people focus on static patterns, I’ve found more value in learning how price travels through its pullbacks and breaks. These movements aren’t random—they follow clear behavioral patterns. Once you learn to identify these, structure becomes easier to read across timeframes.
The Three Modes of Travel
I've observed three types of travel that occur between the dip and the break:
1. Pure Sentiment Travel
This is the cleanest and most decisive form of travel. Price moves in one dominant direction with little to no opposing candles. For example, in a daily uptrend, the pullback might consist entirely of bearish 4H candles. As soon as a strong bullish candle appears, that typically signals the return toward the trend’s strong high.
2. Stacking Travel
Stacking is more nuanced. Price moves with alternating bullish and bearish candles, but the dominant sentiment stays in control.
Let’s say price is dipping in a daily uptrend. On the 1H chart, you may see a bearish sequence that includes a few bullish candles. These bullish candles don’t invalidate the bearish structure because they fail to close above the pivot high formed between the last bullish leg and the beginning of the bearish move. As long as that high is respected, the bearish stacking is valid.
Once price breaks that high (or, in a bullish stacking case, breaks the pivot low), the stacking order is broken, and that signals a reversal back toward the dominant direction.
3. Shifting Travel
Shifting travel looks similar to stacking but is constantly flipping between bullish and bearish stacking. Each shift creates a new high or low within the shifting structure. These micro-structures form lower lows or higher highs as sentiment switches back and forth.
Once price breaks its own shifting structure (e.g., breaks a bearish sequence with a bullish close), this typically signals the end of that leg of travel and a reversal toward the dominant higher timeframe trend.
How to Apply Travel Across Timeframes
These three types of travel operate in a hierarchy:
- Shifting travel (LTF) respects stacking travel (MTF)
- Stacking travel (MTF) respects pure travel (HTF)
- Pure sentiment travel (HTF) is the master mode that resets the others
When you identify a new pure sentiment shift on the higher timeframe, that becomes your reset point. From that candle forward, you should begin fresh stacking and shifting analysis on your lower timeframes.
Workflow example:
1. Spot a pure sentiment shift on the HTF (e.g., bullish daily candle after a clean bearish pullback)
2. From that pivot low, begin tracking stacking travel on the MTF
3. Use shifting travel on the LTF to navigate inside the stacking structure
If stacking or shifting behavior breaks unexpectedly, that usually means market speed is changing—and you may need to reassign which timeframes serve as HTF, MTF, and LTF.
Why This Works
This framework gives you a fixed point of structure—the dip and the break—but allows you to adapt to the behavior in between. Instead of just reacting to breakouts, you're learning how price moves to get there.
That’s what gives you the edge: not just reading where price is, but how it’s traveling to get there.
Final Thoughts
This adaptive travel model helps break down market structure into something both trackable and flexible. Try observing these travel types in real time and let me know how it works for you.
Tools & Resources
If you’d like to access my Pure Order Flow indicator and more exclusive tools, visit my TradingView profile:
@The_Forex_Steward
I’ve built an arsenal of indicators designed to support this framework across different markets and styles. If this breakdown helped, don’t forget to boost the post so others can benefit from it too!
The Empirical Validity of Technical Indicators and StrategiesThis article critically examines the empirical evidence concerning the effectiveness of technical indicators and trading strategies. While traditional finance theory, notably the Efficient Market Hypothesis (EMH), has long argued that technical analysis should be futile, a large body of academic research both historical and contemporary presents a more nuanced view. We explore key findings, address methodological limitations, assess institutional use cases, and discuss the impact of transaction costs, market efficiency, and adaptive behavior in financial markets.
1. Introduction
Technical analysis (TA) remains one of the most controversial subjects in financial economics. Defined as the study of past market prices and volumes to forecast future price movements, TA is used by a wide spectrum of market participants, from individual retail traders to institutional investors. According to the EMH (Fama, 1970), asset prices reflect all available information, and hence, any predictable pattern should be arbitraged away instantly. Nonetheless, technical analysis remains in widespread use, and empirical evidence suggests that it may offer predictive value under certain conditions.
2. Early Empirical Evidence
The foundational work by Brock, Lakonishok, and LeBaron (1992) demonstrated that simple trading rules such as moving average crossovers could yield statistically significant profits using historical DJIA data spanning from 1897 to 1986. Importantly, the authors employed bootstrapping methods to validate their findings against the null of no serial correlation, thus countering the argument of data mining.
Gencay (1998) employed non-linear models to analyze the forecasting power of technical rules and confirmed that short-term predictive signals exist, particularly in high-frequency data. However, these early works often omitted transaction costs, thus overestimating potential returns.
3. Momentum and Mean Reversion Strategies
Momentum strategies, as formalized by Jegadeesh and Titman (1993), have shown persistent profitability across time and geographies. Their approach—buying stocks that have outperformed in the past 3–12 months and shorting underperformers—challenges the EMH by exploiting behavioral biases and investor herding. Rouwenhorst (1998) confirmed that momentum exists even in emerging markets, suggesting a global phenomenon.
Conversely, mean reversion strategies, including RSI-based systems and Bollinger Bands, often exploit temporary price dislocations. Short-horizon contrarian strategies have been analyzed by Chan et al. (1996), but their profitability is inconsistent and highly sensitive to costs, timing, and liquidity.
4. Institutional Use of Technical Analysis
Contrary to the belief that TA is primarily a retail tool, it is also utilized—though selectively—by institutional investors:
Hedge Funds: Many quantitative hedge funds incorporate technical indicators within multi-factor models or machine learning algorithms. According to research by Neely et al. (2014), trend-following strategies remain a staple among CTAs (Commodity Trading Advisors), particularly in futures markets. These strategies often rely on moving averages, breakout signals, and momentum filters.
Market Makers: Although market makers are primarily driven by order flow and arbitrage opportunities, they may use TA to model liquidity zones and anticipate stop-hunting behavior. Order book analytics and technical levels (e.g., pivot points, Fibonacci retracements) can inform automated liquidity provision.
Pension Funds and Asset Managers: While these institutions rarely rely on TA alone, they may use it as part of tactical asset allocation. For instance, TA may serve as a signal overlay in timing equity exposure or in identifying risk-off regimes. According to a CFA Institute survey (2016), over 20% of institutional investors incorporate some form of technical analysis in their decision-making process.
5. Adaptive Markets and Conditional Validity
Lo (2004) introduced the Adaptive Markets Hypothesis (AMH), arguing that market efficiency is not a binary state but evolves with the learning behavior of market participants. In this framework, technical strategies may work intermittently, depending on the ecological dynamics of the market. Neely, Weller, and Ulrich (2009) found technical rules in the FX market to be periodically profitable, especially during central bank interventions or volatility spikes—conditions under which behavioral biases and structural inefficiencies tend to rise.
More recent studies (e.g., Moskowitz et al., 2012; Baltas & Kosowski, 2020) show that momentum and trend-following strategies continue to deliver long-term Sharpe ratios above 1 in diversified portfolios, particularly when combined with risk-adjusted scaling techniques.
6. The Role of Transaction Costs
Transaction costs represent a critical variable that substantially alters the net profitability of technical strategies. These include:
Explicit Costs: Commissions, fees, and spreads.
Implicit Costs: Market impact, slippage, and opportunity cost.
While early studies often neglected these elements, modern research integrates them through realistic backtesting frameworks. For example, De Prado (2018) emphasizes that naive backtesting without cost modeling and slippage assumptions leads to a high incidence of false positives.
Baltas and Kosowski (2020) show that even after accounting for bid-ask spreads and market impact models, trend-following strategies remain profitable, particularly in futures and FX markets where costs are lower. Conversely, high-frequency mean-reversion strategies often become unprofitable once these frictions are accounted for.
The impact of transaction costs also differs by asset class:
Equities: Higher costs due to wider spreads, especially in small caps.
Futures: Lower costs and higher leverage make them more suitable for technical strategies.
FX: Extremely low spreads, but high competition and adverse selection risks.
7. Meta-Analyses and Recent Surveys
Park and Irwin’s (2007) meta-analysis of 95 studies found that 56% reported significant profitability from technical analysis. However, profitability rates dropped when transaction costs were included. More recent work by Han, Yang, and Zhou (2021) extended this review with data up to 2020 and found that profitability was regime-dependent: TA performed better in volatile or trending environments and worse in stable, low-volatility markets.
Other contributions include behavioral explanations. Barberis and Thaler (2003) suggest that TA may capture collective investor behavior, such as overreaction and underreaction, thereby acting as a proxy for sentiment.
8. Limitations and Challenges
Several methodological issues plague empirical research in technical analysis:
Overfitting: Using too many parameters increases the likelihood of in-sample success but out-of-sample failure.
Survivorship Bias: Excluding delisted or bankrupt stocks leads to inflated backtest performance.
Look-Ahead Bias: Using information not available at the time of trade leads to unrealistic results.
Robust strategy development now mandates walk-forward testing, Monte Carlo simulations, and realistic assumptions on order execution. The growing field of machine learning in finance has heightened these risks, as complex models are more prone to fitting noise rather than signal (Bailey et al., 2014).
9. Conclusion
Technical analysis occupies a contested but persistent role in finance. The empirical evidence is mixed but suggests that technical strategies can be profitable under certain market conditions and when costs are minimized. Institutional investors have increasingly integrated TA within quantitative and hybrid frameworks, reflecting its conditional usefulness.
While TA does not provide a universal arbitrage opportunity, it can serve as a valuable tool when applied adaptively, with sound risk management and rigorous testing. Its success ultimately depends on context, execution discipline, and integration within a broader investment philosophy.
References
Bailey, D. H., Borwein, J. M., Lopez de Prado, M., & Zhu, Q. J. (2014). "The Probability of Backtest Overfitting." *Journal of Computational Finance*, 20(4), 39–69.
Baltas, N., & Kosowski, R. (2020). "Trend-Following, Risk-Parity and the Influence of Correlations." *Journal of Financial Economics*, 138(2), 349–368.
Barberis, N., & Thaler, R. (2003). "A Survey of Behavioral Finance." *Handbook of the Economics of Finance*, 1, 1053–1128.
Brock, W., Lakonishok, J., & LeBaron, B. (1992). "Simple Technical Trading Rules and the Stochastic Properties of Stock Returns." Journal of Finance, 47(5), 1731–1764.
Chan, L. K. C., Jegadeesh, N., & Lakonishok, J. (1996). "Momentum Strategies." Journal of Finance, 51(5), 1681–1713.
De Prado, M. L. (2018). Advances in Financial Machine Learning, Wiley.
Fama, E. F. (1970). "Efficient Capital Markets: A Review of Theory and Empirical Work." Journal of Finance, 25(2), 383–417.
Gencay, R. (1998). "The Predictability of Security Returns with Simple Technical Trading Rules." Journal of Empirical Finance, 5(4), 347–359.
Han, Y., Yang, K., & Zhou, G. (2021). "Technical Analysis in the Era of Big Data." *Review of Financial Studies*, 34(9), 4354–4397.
Jegadeesh, N., & Titman, S. (1993). "Returns to Buying Winners and Selling Losers: Implications for Stock Market Efficiency." *Journal of Finance*, 48(1), 65–91.
Lo, A. W. (2004). "The Adaptive Markets Hypothesis: Market Efficiency from an Evolutionary Perspective." *Journal of Portfolio Management*, 30(5), 15–29.
Moskowitz, T. J., Ooi, Y. H., & Pedersen, L. H. (2012). "Time Series Momentum." *Journal of Financial Economics*, 104(2), 228–250.
Neely, C. J., Weller, P. A., & Ulrich, J. M. (2009). "The Adaptive Markets Hypothesis: Evidence from the Foreign Exchange Market." *Journal of Financial and Quantitative Analysis*, 44(2), 467–488.
Neely, C. J., Rapach, D. E., Tu, J., & Zhou, G. (2014). "Forecasting the Equity Risk Premium: The Role of Technical Indicators." *Management Science*, 60(7), 1772–1791.
Park, C. H., & Irwin, S. H. (2007). "What Do We Know About the Profitability of Technical Analysis?" *Journal of Economic Surveys*, 21(4), 786–826.
Rouwenhorst, K. G. (1998). "International Momentum Strategies." *Journal of Finance*, 53(1), 267–284.
Zhu, Y., & Zhou, G. (2009). "Technical Analysis: An Asset Allocation Perspective on the Use of Moving Averages." *Journal of Financial Economics*, 92(3), 519–544.
What do we need to know before investing?If you are thinking about investing money for the potential returns it offers, you should know that it may go well, but that there are always risks. That’s why we are going to give you some basic tips to bear in mind before making any investment decision.
How much money are you going to invest?
First of all, you need to decide how much money you want to put towards your financial investments.
The markets are subject to change
The financial markets are constantly fluctuating. The term volatility is the most commonused term to describe and measure the uncertainty provided by changes to theprices of financial assets.
Additionally, there are times in the market when the prices are more pronounced and every now and then there are crisis periods and asset prices fall dramatically.
Investing in financial markets means that we have to assume that our investments will always be subject to these types of fluctuations. If you are going to invest in the financial markets the money that you invest must be money that you will not need during the investment term.
That’s why, investing in order to obtain short term gains is inevitably associated with high risk. Furthermore, the larger our intended gains, the larger the associated risk. Always bear in mind that the greater the expected returns, the greater the assumed risk. Once again, be sure that you do not need the money that you are going to invest, as it may have losses.
The opposite can be said of long term investments, where the capacity to wait and overcome falls in the market means that you can assume more risk with your investments. With a long term vision you will avoid having to experience any possible losses with your investment period due to any eventual liquidity needs.
How much risk are you willing to take on?
Before investing it is important to know the risk you can assume. Every investor has their own risk tolerance level that they need to be aware of. Risks and returns go hand in hand, because for more returns you also need to take on more risk, and vice versa.
It is also good to know that just as with normal market conditions, those assets with a higher risk tend to suffer more fluctuations with their prices than those assets with less risk.
Therefore, in general terms:
When the forecasts for the financial markets are favourable and the market goes up, those assets with higher expected returns generally perform excellently.
Whenever the financial markets are going through uncertain times, those assets with higher expected returns, and therefore more risk, tend to perform worse.
You must start from a strong financial position
To invest you need to be at a point where your accounts are well under control, including your debts. We do not mean to say that if you have any outstanding credit you cannot invest, but it is essential that everything is in order and that you are in a situation where you can fulfil your financial obligations.
On the other hand, to build long term wealth, it is important that you assign part of your income to your savings, meaning that you have to invest with the money left over after making your payments while also saving part of what you earn.
It is important to keep a composed outlook
Now we know that investing bears its own risks and that the market is subject to change, it is essential to be composed when investing. When investing it is important to think positively, as if you don’t really believe that things will work out, why invest?
It is one thing to be cautious, and to know how much money to invest and what level of risk tolerance to assume, and another to think negatively each time there is a drop in the market. In reality, investing is a combination of caution and composure.
Diversification is the key to success
Somebody with less investment experience may make the mistake of putting all of their investment budget into just one thing. However, it is much better to have diverse investments, as while some investments may not quite work out as you would have liked them to, some do even better.
Losses are normal, and so are returns
We previously said that when investing it is important to stay calm, and that is true. In this regard, you also have to bear in mind that it is normal for some investments in your portfolio to not perform as well as you had expected.
We cannot predict the behaviour of the financial markets or of certain assets. We can also unexpectedly find ourselves with some assets that don’t perform as well as we had hoped. That is why we recommend, in addition to not risking more than you can invest, to diversify your investments well.
We have already said that investment involves risk, which is why it is good to know that if you are willing to invest, you are also willing to take on risks. If you are prepared to take on this risk, you can be successful in your investments.
Did you like it? Share with your friends
by HollyMontt

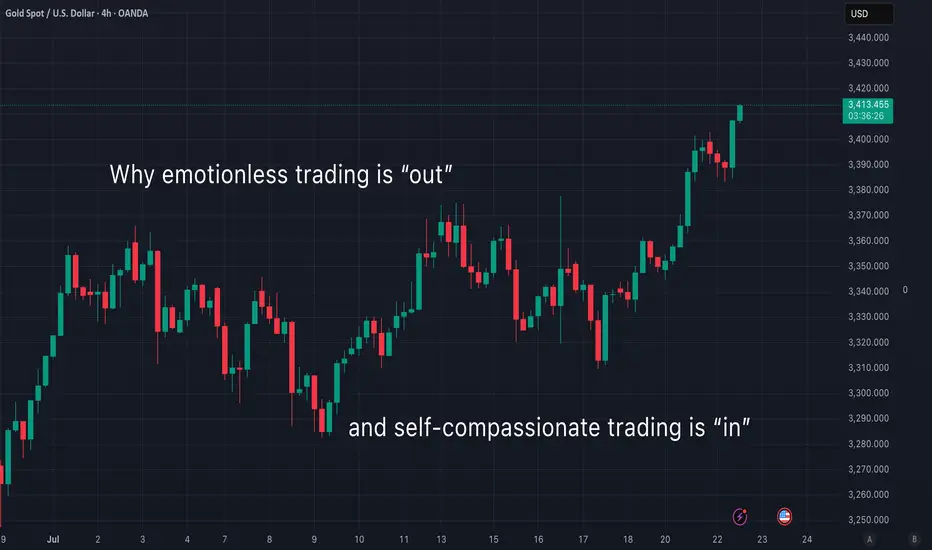
Why emotionless trading is out (and what to do instead)Curious about what self-compassionate trading really means?
Let’s do a little thought experiment together. Imagine you just closed a losing trade. You’re feeling disappointed and unmotivated. You invite two friends over to your home and tell them what happened. Which friend would you rather talk to?
🙋🏽♀️ Friend 1 says:
"What a failure you are. Why were you even stressed out? That’s so silly. Couldn’t you see this trade was going to be a loss? You should just give up—what’s the point of trying? I don’t understand how you could mess up the way you did. Let’s spend the afternoon going through everything you did wrong."
...Or would you prefer:
🙋🏽♀️ Friend 2 who says:
"I can see you’re feeling sad and disappointed about that last trade. I’m really sorry it didn’t go your way. But you know what? Losses are a part of trading—we all go through them. You’ll have another chance tomorrow. I can tell you’re doing your best. Let’s do something kind for ourselves today, and tomorrow you’ll get back to it. Don’t give up—I’m proud of you for chasing your dreams."
🤔 So, who would you choose?
I know this little experiment might sound a bit dramatic—but be honest, wouldn’t we all prefer Friend 2 ? And isn’t Friend 1 sounding suspiciously like that inner critic of yours?
For the longest time, trading advice has told us to "get rid of emotions" and stay completely “stress-free.” I wish it were that simple…
The truth is, trying to trade without emotions is like talking to yourself like Friend 1 . Not only is it impossible —it also builds a harsh, critical inner dialogue that damages both your confidence and motivation.
The reality is: we don’t have full control over our thoughts and emotions. They show up whether we want them to or not. If we could choose our emotional state, we’d all stay calm and focused every time we trade. But that’s not how the human mind works.
Instead of fighting our emotions, we can learn to open up to them—without judgment.
Self-compassionate trading means treating yourself like Friend 2 . It’s about acknowledging when things are tough, and being kind to yourself when stress or anxiety shows up. It’s about replacing harsh self-talk with encouragement, warmth and understanding.
👩🏽🔬 Some people think self-compassion is soft, ”girly”, or even “too emotional.” But guess what? It’s backed by tons of solid research. Studies show that self-compassion helps reduce self-criticism and improve motivation. It’s also an effective tool for managing tough emotions and reducing stress and anxiety.
Self-compassionate trading is a win-win approach—it helps you stay grounded and resilient while building a meaningful trading journey. So why not give it a try? 👇
💡 Pro Tip:
Next time you close a losing trade, find yourself in a losing streak, or just feel anxious about your performance—ask yourself:
“What would I say to a good friend who’s going through the same thing?”
Then offer that same kindness and support to yourself.
Happy (self-compassionate) trading! 💙
/ Tina the Trading Psychologist
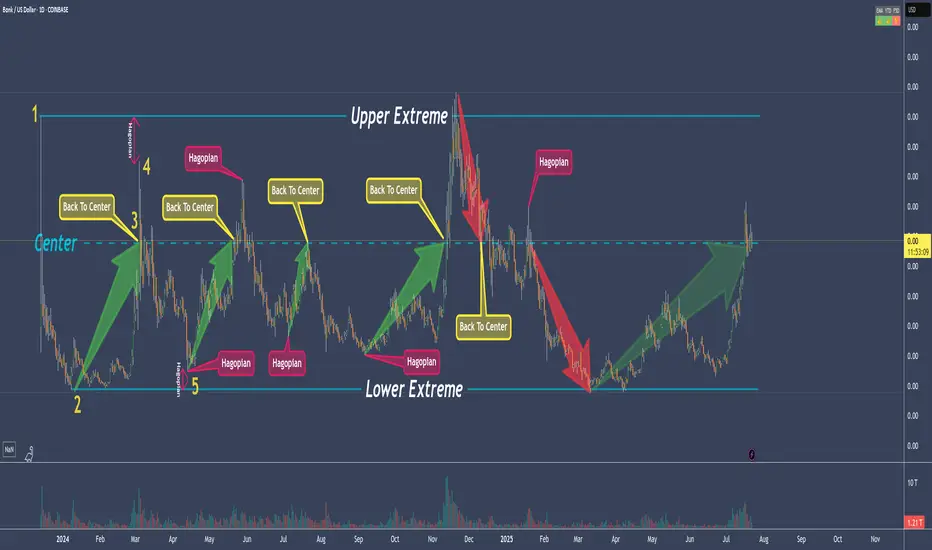
80% Of Time - A Trading Edge You Don't Want To MissDo you want to know why trading with median lines, also known as pitchforks, can be so successful? It’s simple:
Prices swing from one extreme back to the middle.
From the middle, they often swing to the other extreme.
What do we see on the chart?
- The upper extreme
- The center
- The lower extreme
So far, so good.
Now let’s follow the price and learn a few important rules that belong to the rulebook of median lines/pitchforks, and with which you can make great trades.
Point 1
The price starts and is sold off down to…
Point 2
...and from there starts to rise again, up to…
Point 3
...which is the center. And here we have a rule that is very important and one that you need to be aware of in trading to be successful:
THE PRICE RETURNS TO THE CENTER IN ABOUT 80% OF ALL CASES
If we know this, then we can stay in a trade with confidence.
Point 4
The price climbed even higher but missed the upper extreme.
This is the “Hagopian Rule” (named after the man who discovered it).
And the rule goes: If the price does not reach the next line (upper extreme, lower extreme, or center), then the price will continue moving in the opposite direction from where it originally came.
Phew...that’s a mouthful ;-)
But yes, we actually see that the price does exactly this.
From point 4, where the price missed the upper extreme, the price not only goes back to the center but continues and almost reaches the lower extreme!
Now if that isn’t cool, I don’t know what is!
And what do we have at point 5?
A "HAGOPIAN"!
What did we just learn?
The price should go higher than the center line.
Does it do that?
Oh yes!
But wait!
Not only does the Hagopian Rule apply. Remember?
"The price returns to the center line in about 80% of the cases."
HA!
Interesting or interesting?
So, that’s it.
That’s enough for now.
Now follow the price yourself and always consider which rule applies and whether it’s being followed.
How exactly do you trade all this, and what are the setups?
...one step at a time.
Don’t miss the next lesson and follow me here on TradingView.
Wishing you lots of success and fun!
The More You Believe You Know The More You LoseThe moment you see your first green position something changes Suddenly your brain convinces you you’ve got this But the market doesn’t punish bad traders it punishes the ones who think they’re too good to lose
You don’t lose because you’re unskilled
You lose because you believe you’ve mastered the game
Hello✌️
Spend 3 minutes ⏰ reading this educational material.
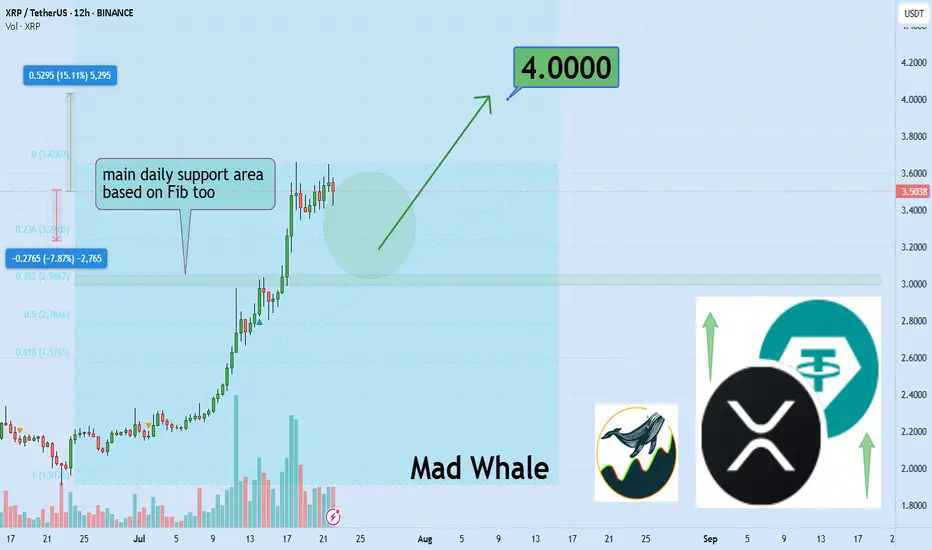
🎯 Analytical Insight on Ripple:
BINANCE:XRPUSDT remains undervalued at current levels, showing strong volume near a key daily support zone that aligns closely with a major Fibonacci retracement. This confluence suggests a potential shift in momentum. If buyers hold this level, a move toward the $4 area is on the table, representing an estimated 15% upside. 📈 Watch for confirmation through sustained volume and price reaction at support. ⚡
Now , let's dive into the educational section,
🎯 The Confidence Trap
One of the most dangerous mental states for a trader is early victory That moment after a couple of green trades when you start feeling like you’ve figured the market out That’s when the market does to you what you used to do to clueless beginners
From that point forward your decisions aren’t based on analysis they’re based on this thought
I already know how this works.
🧠 How Your Mind Tricks You
You win once Your brain says “Told you you’re good”
You win again It says “Go heavier now”
You lose It says “Fix it now You’ve done it before”
This cycle leads to overtrading and emotional revenge You’re no longer trading the market you’re defending the version of yourself you believe you’ve become
🔄 The Market Doesn’t Send Signals It Sends Lessons
When the market moves against you it’s doing the right thing It’s breaking down your ego so you can finally start seeing the chart for what it is not what your confidence wants it to be
🧱 Experience Can Kill Learning
Many failed traders are not beginners they’re the ones with years of bias built up At some point they stop learning Every chart starts looking the same That’s when their final trade shows up
🕳 The Ego Pitfall
If your mind tells you “I know this” it’s time to be extra cautious That means you’re trading with a rigid mindset And in crypto markets the rigid get destroyed
📉 High Leverage = High Confidence = High Risk
Nobody gets reckless on 2x leverage But once you start feeling pro you go 20x 50x or more And when the market flips the same ego that won you your first big gain is the one that wipes out your entire account.
📊 How TradingView Tools Can Save You
In this mental trap three tools from TradingView can seriously help
Replay Bar Tool
Go back in time and relive previous market conditions This tool shows you exactly where your bias failed and where your overconfidence blinded you It helps kill that false feeling of mastery
OBV (On Balance Volume)
A simple yet powerful volume indicator If price rises but OBV is falling the uptrend is fake If price drops but OBV is climbing sellers are weak and a reversal might be near This gives volume context beyond candles
Volume Spike
Watch out for sudden surges in volume If volume explodes but price barely moves someone big is moving in silence It’s often the prelude to fakeouts traps or major directional shifts These spikes scream pay attention
Risk-to-Reward Tool
Don’t let your “confidence” make you forget basic math This tool gives you the true ratio of what you’re risking versus what you’re chasing It doesn’t care how good you feel it shows you if the trade makes sense
🧊 Humility Is the Only Edge That Lasts
Humility means accepting you might always be wrong It means checking yourself with objective tools It means saying “maybe” instead of “definitely”
It means lasting longer than the rest
🔚 Final Words
If you’re sure you’ve mastered the market pause The best traders second-guess themselves often not because they’re weak but because they know confidence fades but risk never does
✨ Need a little love!
We pour love into every post your support keeps us inspired! 💛 Don’t be shy, we’d love to hear from you on comments. Big thanks , Mad Whale 🐋
📜Please make sure to do your own research before investing, and review the disclaimer provided at the end of each post.
Altcoin Season:It All Comes Down to One Thing—Liquidity RotationHello Traders 🐺
Let’s be real—everything about “altcoin season” comes back to one key concept: liquidity rotation. You’ve probably heard that term thrown around, but what does it actually mean ? And more importantly, how do we use it?
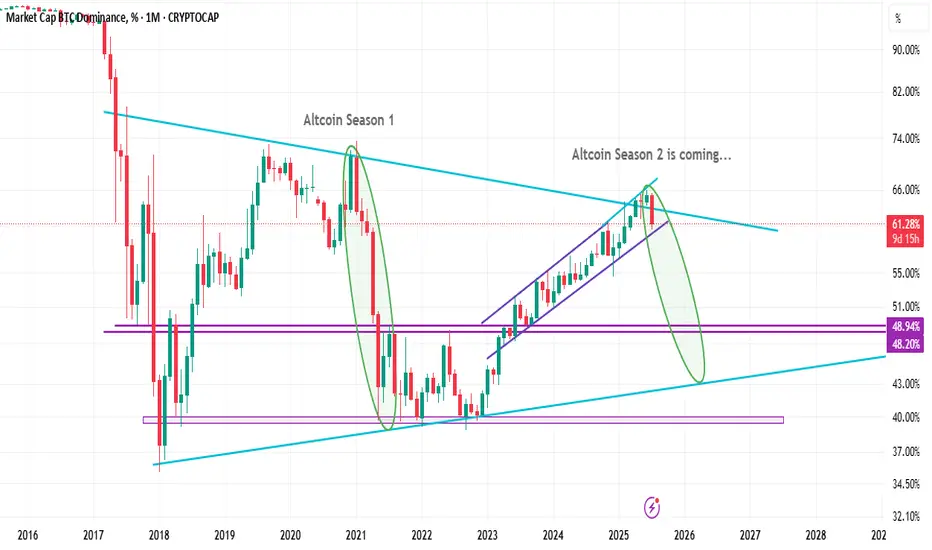
No matter what market cycle we’re in—bullish or bearish—each cycle is made up of several internal phases. And during those phases, tracking where smart money is flowing becomes crucial. But let’s break it down even further.
Take a look at the chart. Before the last altcoin season kicked off, something interesting happened: the Bitcoin Dominance Index (BTC.D) had a significant rally. As the name suggests, this index tracks Bitcoin’s share of the overall crypto market cap. So when CRYPTOCAP:BTC.D is rising, that means Bitcoin is sucking up a larger share of the liquidity—smart money is flowing into BTC first.
This is critical to understand, because Bitcoin Dominance is one of the clearest indicators to tell you which phase of the cycle we're in and where the money is heading next.
Now here’s the key question:
Why do we associate a drop in BTC Dominance with the start of altcoin season?
It all goes back to the literal meaning of Bitcoin Dominance. If BTC.D is approaching 100%, nearly all the money is concentrated in Bitcoin alone. But when this dominance starts dropping, it signals that capital is beginning to rotate out of BTC and into altcoins.
And here's where it gets spicy:
When BTC.D approaches a key resistance level—like it's doing right now—and at the same time we see bearish divergences across multiple timeframes... that’s our cue. Combine that with technical analysis, and suddenly you've got yourself a roadmap most beginners are completely blind to.
That’s why 80% of traders end up feeding the profits of the other 20%. The harsh truth? Markets are wealth transfer mechanisms—from the impatient to the patient. Every bad entry, every panic sell, ends up padding the wallet of someone who planned the rotation in advance.
Let’s not complicate things too much though. Just look at what’s happening right now:
BTC Dominance hit a major resistance level, showed strong bearish divergences (as I mentioned in earlier posts), and what happened next? Boom—altcoins started pumping hard this past week.
To everyone who stayed with me through this phase and positioned themselves early—congrats. You earned this.
But here’s the bigger picture:
We're still at the beginning of the altcoin cycle. Like I explained before, it all happens in phases:
Bitcoin Season – Smart money enters Bitcoin first.
Ethereum Season – Then liquidity flows into ETH.
Large-Cap Altcoins – After that, big-name altcoins start moving.
Altcoin Season (Full Risk-On) – Finally, capital floods into low-cap alts—the wild phase.
And that last phase? That’s when things get crazy. That’s where irrational exuberance lives. That’s where dreams are made—or broken—depending on your timing and plan.
So yeah, buckle up. We're not done yet.
And as always remember :
🐺 Discipline is rarely enjoyable , but almost always profitable. 🐺
🐺 KIU_COIN 🐺
Feed Your Ego or Feed Your Account- Your Choise🧭 From Rookie to Realization
I’ve been trading since 2002. That’s nearly a quarter of a century in the markets.
I’ve lived through it all:
• The early days, when the internet was slow and information was scarce
• The forums, the books, the overanalyzing
• The obsession with finding “the perfect system”
• And later… the dangerous phase: needing to be right, because I have a few years of experience and I KNOW
At one point, I thought that being a good trader meant calling the market in advance — proving I was smarter than the rest.
But the truth is: the market doesn't pay for being right. It pays for managing risk, always adapting and executing cleanly.
________________________________________
😤 The Psychological Trap Most Traders Fall Into
There’s one thing I’ve seen consistently over the last 25 years:
Most traders don’t trade to make money.
They trade to feel right.
And this need — this psychological craving to validate an opinion — is exactly what keeps them from growing.
You’ve seen it too:
• The guy who’s been screaming “altcoin season” for 2 years
• Who first called it when EGLD was at 80, TIA, and others that kept dropping
• But now that something finally moves, he says:
“See? I was right all along, altcoin season is here”
He’s not trading.
He’s rehearsing an ego story, ignoring every failed call, every drawdown, every frozen position.
He doesn’t remember the trades that didn’t work — only the one that eventually did.
This is not strategy.
It’s delusion dressed up as conviction.
________________________________________
📉 The Market Doesn’t Care What You Think
Here’s the reality:
You can be right in your analysis — and still lose money.
You can be wrong — and still come out profitable.
Because the market doesn’t reward your opinion.
It rewards how well you manage risk, entries, exits, expectations, and flexibility
I’ve seen traders who were “right” on direction but blew their accounts by overleveraging.
And I’ve seen others who were wrong on their first two trades — but adjusted quickly, cut losses, and ended green overall in the end.
This is what separates pros from opinionated amateurs.
________________________________________
📍 A Real Example: Today’s Gold Analysis
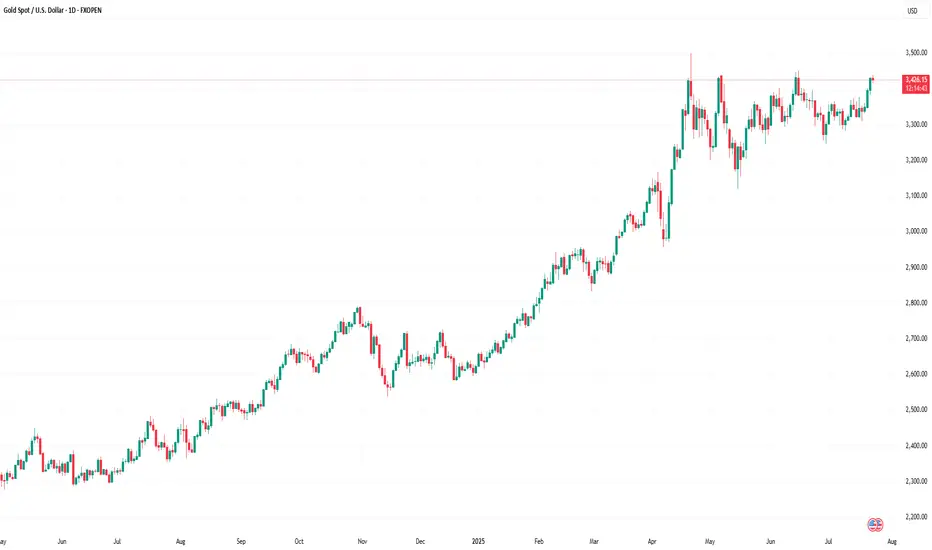
Let’s take a real, current example — my own Gold analysis from this morning.
I said:
• Short-term, Gold could go to 3450
• Long-term, the breakout from the weekly triangle could take us to 3800
Sounds “right,” right? But let’s dissect it:
Short-term:
✅ I identified 3370 as support
If I buy there, I also have a clear invalidation level (below 3350)
If it breaks that and hits my stop?
👉 I reassess — because being “right” means nothing if the trade setup is invalidated
And no, it doesn’t help my PnL if Gold eventually reaches 3450 after taking me out.
Long-term:
✅ The weekly chart shows a symmetrical triangle
Yes — if we break above, the measured move targets 3800
But…
If Gold goes below 3300, that long-term scenario is invalidated too.
And even worse — if Gold trades sideways between 3000 and 3500 for the next 5 years and finally hits 3800 in 2030, that “correct call” is worth nothing.
You can't build a career on "eventually I was right."
You need precision, timing, risk management, and the ability to say:
“This setup is no longer valid. I’m out.”
________________________________________
💡 The Shift That Changed Everything
It took me years to realize this.
The day I stopped needing to be right was the day I started making consistent money.
I stopped arguing with the market.
I stopped holding losers out of pride.
I stopped needing to "prove" anything to anyone — especially not myself.
Now, my job is simple:
• Protect capital
• Execute with discipline
• Let the edge do its job
• And never fall in love with my opinion
________________________________________
✅ Final Thought – Let Go of Being Right
If you’re still stuck in the “I knew it” mindset — let it go.
It’s not helping you. It’s costing you.
The best traders lose small, admit mistakes fast, and stay emotionally neutral.
The worst traders hold on to “being right” while their account burns.
The market doesn’t owe you respect.
It doesn’t care if you called the top, bottom, or middle.
It pays the ones who trade objectively, flexibly, and without ego.
After almost 25 years, this is the one thing I wish I had learned sooner:
Don’t try to win an argument with the market.
Just get paid.
Disclosure: I am part of TradeNation's Influencer program and receive a monthly fee for using their TradingView charts in my analyses and educational articles.

Japanese Candlestick Cheat Sheet – Part Two- 2 candle patternsTwo-Candle Patterns That Signal Shifts in Sentiment
Single candles whisper…
But two candles talk to each other — and when they do, they often reveal the first signs of a reversal or continuation.
In this second part of the series, we go deeper.
From engulfings to haramis, tweezer tops to piercing lines — these patterns don’t just look good on charts… they capture the psychological tug-of-war between buyers and sellers.
Price doesn’t lie.
And two candles in a row can say: “Something just changed.”
Learn to spot them early. Learn to listen when the chart speaks.
This is Part Two of your practical guide to mastering candlestick formations.
BULLISH KICKER
Bias: Bullish
What is the Bullish Kicker pattern?
The Bullish Kicker forms when a strong bullish candle follows a bearish one with no overlap between the two, indicating a sudden shift in sentiment. This pattern is a powerful indicator of a reversal as buyers take control. The sharp contrast between the bearish and bullish candles reflects a dramatic shift in market psychology, where bears are caught off-guard and forced to cover their positions.
Bullish Kickers are rare but extremely telling, providing a clear signal that sentiment is favoring buyers. Recognizing such decisive patterns can be a game-changer.
Meaning:
Found after downtrends or sell-offs; suggests a sudden shift in sentiment, indicating strong buying interest and potential trend reversal.
BULLISH ENGULFING
Bias: Bullish
What is the Bullish Engulfing pattern?
The Bullish Engulfing pattern occurs when a large bullish candle fully engulfs the previous smaller bearish candle, signaling a potential trend reversal. This pattern highlights a moment when buyers overpower sellers, often marking the beginning of upward momentum. Psychologically, it suggests that buyer confidence is returning, and sellers are losing their grip.
For traders, understanding Bullish Engulfing patterns can provide crucial entry points into emerging trends. Learning to identify and trade such patterns is essential for capturing momentum and new trends.
Meaning:
Typically found in downtrends, this pattern signals a potential bullish reversal as buyers overpower sellers, often indicating a shift toward upward momentum.
BULLISH HARAMI
Bias: Bullish
What is the Bullish Harami pattern?
The Bullish Harami consists of a small bullish candle within a preceding larger bearish one, indicating a pause in downward momentum and hinting at a potential reversal. This pattern shows that sellers are beginning to weaken as buyers cautiously test the waters. The Harami reflects a shift in sentiment from bearish to neutral, often marking a transitional phase in the market.
Interpreting the Bullish Harami helps traders spot moments when sentiment is shifting, potentially signaling the start of a trend change.
Meaning:
Seen in downtrends, it suggests indecision, with possible bullish reversal if the following candles confirm buying strength, indicating a weakening bearish trend.
PIERCING LINE
Bias: Bullish
What is the Piercing Line pattern?
The Piercing Line forms when a bullish candle opens below the previous bearish candle’s low but closes over halfway into it. Found in downtrends, this pattern reflects strong buying pressure as buyers step in at lower prices, creating a potential bullish reversal. The Piercing Line pattern suggests that sentiment may be shifting as buyers gain confidence.
This pattern’s strength lies in its psychological impact, revealing moments when buyers are willing to take risks. Recognizing these signs early can provide valuable insights for traders looking to time entries.
Meaning :
Found in downtrends, this pattern suggests a possible bullish reversal if buying continues, as sellers lose control to buyers.
TWEEZER BOTTOM
Bias: Bullish
What is the Tweezer Bottom pattern?
The Tweezer Bottom pattern is characterized by two consecutive candles with nearly identical lows, one bearish and one bullish. This pattern often signals the end of a downtrend, as the matching lows suggest a strong support level where buyers are stepping in. The Tweezer Bottom highlights market psychology at work, with sellers unable to push prices lower, reflecting renewed buying interest.
Tweezer Bottoms are ideal for traders looking to identify support zones and potential reversal points. By understanding this pattern’s significance, traders can make informed decisions.
Meaning:
Found in downtrends, it signals potential reversal, showing strong support at the matching low, suggesting buyers are stepping in.
BEARISH KICKER
Bias: Bearish
What is the Bearish Kicker pattern?
The Bearish Kicker is the inverse of the Bullish Kicker, forming when a strong bearish candle follows a bullish one without overlap, indicating a sharp sentiment shift. This pattern often marks a sudden reversal, with sellers taking control after an initial bullish period. Psychologically, Bearish Kickers are powerful, signaling that buyers are caught off-guard and losing momentum.
Recognizing Bearish Kickers provides traders with insights into sudden shifts in market dynamics, helping them avoid buying into weakening trends.
Meaning:
Found after uptrends; indicates a sudden sentiment shift, signaling potential trend reversal and intensified selling pressure.
BEARISH ENGULFING
Bias: Bearish
What is the Bearish Engulfing pattern?
The Bearish Engulfing pattern forms when a large bearish candle engulfs the previous smaller bullish candle, suggesting a potential reversal in an uptrend. This pattern signals that sellers have regained control, often marking the start of downward momentum. The Bearish Engulfing reveals a psychological shift, as selling pressure overtakes buying interest.
This pattern is a powerful tool for traders who aim to catch trend reversals, allowing them to align with emerging downward momentum.
Meaning:
Typically found in uptrends, this pattern signals a potential bearish reversal as sellers overpower buyers, often indicating a downward momentum shift.
BEARISH HARAMI
Bias: Bearish
What is the Bearish Harami pattern?
The Bearish Harami consists of a small bearish candle contained within a larger preceding bullish one, reflecting indecision and a potential trend reversal. Found in uptrends, it hints that buyers are losing strength, while sellers are cautiously testing the market. This pattern highlights moments when buyer momentum begins to wane, suggesting caution.
Interpreting the Bearish Harami allows traders to spot potential shifts in sentiment, helping them manage risk and time their exits.
Meaning:
Seen in uptrends, it suggests indecision with a potential bearish reversal if following candles confirm, indicating a weakening bullish trend.
DARK CLOUD COVER
Bias: Bearish
What is the Dark Cloud Cover pattern?
The Dark Cloud Cover appears when a bearish candle opens above the previous bullish candle but closes over halfway into it, reflecting a shift in control from buyers to sellers. This pattern suggests that bullish momentum may be fading, hinting at a potential reversal. Dark Cloud Cover patterns reveal moments when sentiment shifts from optimism to caution.
For traders, understanding this pattern helps them anticipate reversals at the top of uptrends.
Meaning:
Found in uptrends; signals potential bearish reversal if selling continues, as buyers lose control to sellers.
TWEEZER TOP
Bias: Bearish
W hat is the Tweezer Top pattern?
The Tweezer Top is formed by two candles with matching or nearly matching highs, typically one bullish and one bearish. This pattern signals potential resistance, as sellers are consistently pushing back against the same level. The Tweezer Top reflects a moment of seller strength, often marking the end of an uptrend.
Recognizing Tweezer Tops helps traders spot resistance zones and potential reversal points, allowing them to avoid buying into weakening trends or even shorting the asset.
Meaning:
Found in uptrends, it signals potential reversal, showing strong resistance at the matching high, suggesting selling pressure.
🧭 Final Thought
Two-candle formations often appear at key turning points — right where most traders hesitate or get trapped.
Learn to read them not just as patterns, but as conversations between candles — one pushing, the other reacting.
And if this is your first time reading the series, don’t miss Part One – where we covered single-candle signals like dojis, hammers, and marubozus — the very foundations of candlestick reading.
How to Trade Doji Candles on TradingViewLearn to identify and trade doji candlestick patterns using TradingView's charting tools in this comprehensive tutorial from Optimus Futures. Doji candles are among the most significant candlestick formations because they signal market indecision and can help you spot potential trend reversal opportunities.
What You'll Learn:
• Understanding doji candlestick patterns and their significance in market analysis
• How to identify valid doji formations
• The psychology behind doji candles: when buyers and sellers fight to a draw
• Using volume analysis to confirm doji pattern validity
• Finding meaningful doji patterns at trend highs and lows for reversal setups
• Timeframe considerations for doji analysis on any chart period
• Step-by-step trading strategy for doji reversal setups
• How to set stop losses and profit targets
• Real example using E-Mini S&P 500 futures on 60-minute charts
This tutorial may help futures traders and technical analysts who want to use candlestick patterns to identify potential trend reversals. The strategies covered could assist you in creating straightforward reversal setups when market indecision appears at key price levels.
Learn more about futures trading with Tradingview: optimusfutures.com
Disclaimer:
There is a substantial risk of loss in futures trading. Past performance is not indicative of future results. Please trade only with risk capital. We are not responsible for any third-party links, comments, or content shared on TradingView. Any opinions, links, or messages posted by users on TradingView do not represent our views or recommendations. Please exercise your own judgment and due diligence when engaging with any external content or user commentary.
This video represents the opinion of Optimus Futures and is intended for educational purposes only. Chart interpretations are presented solely to illustrate objective technical concepts and should not be viewed as predictive of future market behavior. In our opinion, charts are analytical tools—not forecasting instruments. Market conditions are constantly evolving, and all trading decisions should be made independently, with careful consideration of individual risk tolerance and financial objectives.

HOW-TO: Auto Harmonic Screener - UltimateXHello Everyone,
In this video, we have discussed on how to use our new Auto Harmonic Screener - UltimateX. We have covered the following topics.
Difference between Auto Harmonic Screener - UltimateX (Current script) and Auto Harmonic Pattern - UltimateX and how to use both the scripts together
Difference between Auto Harmonic Screener - UltimateX (Current script) and the existing screener Auto Harmonic Pattern - Screener which is built on request.security calls. We have discussed how the limitations of old script and how using the new script with Pine screener utility will help overcome those problems.
We have gone through the indicator settings (which are almost similar to that of Auto Harmonic Pattern UltimateX
Short demo on how to use the script with Pine Screener
Also check our existing video on How to use the new Pine Screener Utility.
