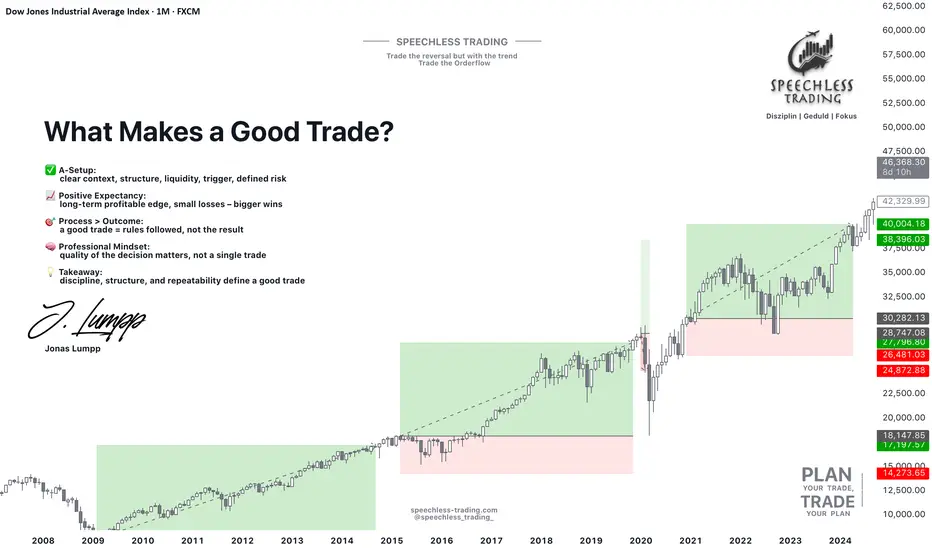
The Anatomy of a Good Trade: Focus on Decisions, Not ResultsLet's find out - what is a good trade?
Most beginners answer: a trade that makes money.
But in professional trading, a good trade has nothing to do with the outcome.
It has everything to do with the quality of the decision.
1️⃣ A good trade starts with an A-Setup:
An A-Setup is not a feeling — it’s a repeatable pattern with structure and logic.
✔ Clear market context
✔ Direction aligned with market structure
✔ Liquidity levels identified
✔ Entry trigger confirmed
✔ Risk defined before the trade
If one of these is missing, it’s no longer an A-Setup — it’s hope.
2️⃣ A good trade has positive expectancy:
Winning one trade means nothing. Winning a sample size of 100 tells you everything.
A positive expectancy means your setup:
loses small - wins bigger - and performs consistently over time
You don’t need to win every trade — you need a system where the average outcome is in your favor.
3️⃣ A good trade follows process, not emotion:
A professional doesn’t judge a trade by profit or loss. They judge it by one question:
“Did I execute my plan without breaking the rules?”
If yes → it was a good trade. Even if it ended in a loss.
Because long-term success comes from repeatable behavior, not from chasing single outcomes.
The Truth:
➡️ A good trade is not defined by green or red.
➡️ A good trade is defined by discipline, structure, and execution.
If beginners understood this idea, half of their frustration would disappear.
Thanks for reading, and have a great start to your trading week!
Let us know in the comments if you found this post valuable - and we might create a full series on applied trading psychology.
Jonas Lumpp
Speechless Trading
Disclaimer: This tutorial is for educational purposes only and does not constitute financial advice. Its goal is to help traders develop a professional mindset, improve risk management, and make more structured trading decisions.
Community ideas
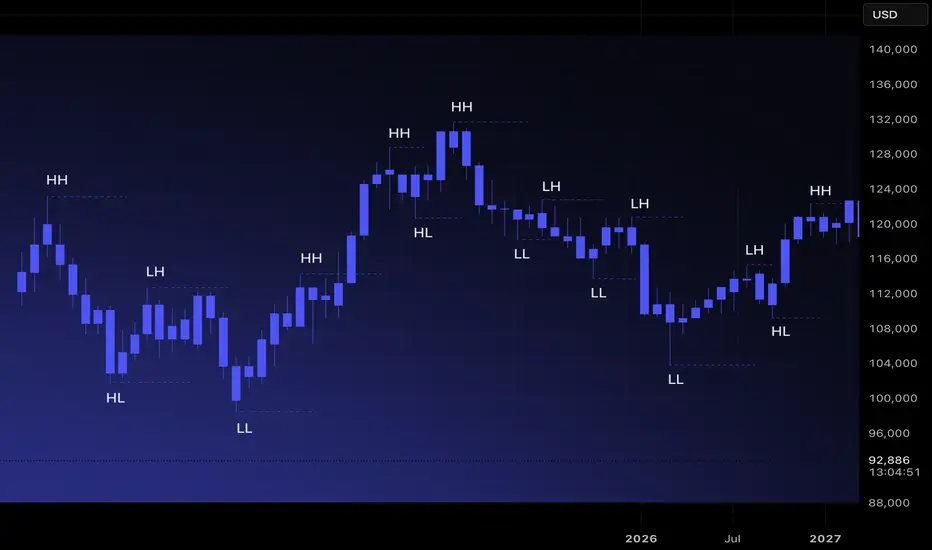
Market Structure 101: Navigating Price ActionMost traders jump directly into indicators, oscillators, or patterns. Yet every chart has a deeper foundation that determines direction long before any tool is applied. Market structure is that foundation. When you understand how price forms highs, lows, and transitions between them, you stop reacting to noise and start reading the market’s intent. It is the base layer that allows you to build a clear, consistent bias.
Price moves because buyers and sellers interact around key levels. Structure highlights where momentum strengthens, weakens, or reverses. By tracking how highs and lows evolve, you can identify trend, consolidation, and shifts in direction with far more clarity than any indicator can offer. Market structure is objective. It gives you a rule-based lens to interpret movement across all timeframes.
Understanding Highs and Lows
There are four structural components every trader must recognize.
Higher High (HH): Price breaks above a previous high, showing buyers in control.
Higher Low (HL): Price pulls back but stays above the prior low, confirming trend continuation.
Lower High (LH): Price rallies but fails to reach previous highs, indicating weakening demand.
Lower Low (LL): Price breaks below the previous low, signaling sellers taking control.
These sequences are the building blocks of trend identification. When mapped correctly, they remove guesswork and reveal underlying momentum.
Identifying Uptrends and Downtrends
Uptrend: A sequence of HHs and HLs. Buyers consistently push price higher and defend higher floors.
Downtrend: A sequence of LHs and LLs. Sellers control direction, rejecting higher prices and driving the market downward.
A trend remains intact until structure breaks. This is why experienced traders avoid predicting reversals and instead follow structural evidence. When the market prints new HHs and HLs, the bias remains long. When LLs and LHs appear, the bias rotates short.
Ranges and Consolidation
Markets do not trend all day. Much of the time, they move sideways. A range occurs when highs and lows stay relatively equal, creating a horizontal zone with equal highs and equal lows. This is where compression happens. Liquidity builds above the range highs and below the range lows, and trend often resumes only after one side of the range is taken.
In ranges, structure becomes neutral. Bias is formed only when price breaks out and retests with confirmation.
Break of Structure(BOS) and Trend Shift
A break of structure occurs when the market violates the pattern of the existing trend. In an uptrend, a break occurs when price prints an LL. In a downtrend, a break occurs when price forms an HH. This signals a potential shift in momentum.
Breaks of structure matter because they identify turning points without relying on subjective signals. They show where one side loses control and the other gains traction. They also create clear invalidation points for risk management.
How to Read Structure Across Timeframes
Market structure becomes even stronger when used across multiple timeframes. The higher timeframe sets the primary bias. The lower timeframe provides entry precision.
Weekly or Daily: Structural trend and major zones.
4H or 1H: Execution windows and key shifts.
15m and 5m: Entry confirmation.
When all levels of structure align, the probability of a clean move increases significantly.
Avoiding Common Mistakes
Many traders misread structure by focusing on every small fluctuation. Structure is defined by meaningful swings, not micro noise. Another common error is assuming a single HH or LL immediately reverses a trend. Context matters. Breaks followed by continuation and retests confirm the shift. A disciplined trader waits for structure to become clear instead of acting on isolated candles.
Turning Structure Into a Bias
Structure simplifies decision-making.
If the market is printing HH and HL formations, you prioritize longs.
If it is printing LH and LL formations, you seek shorts.
If highs and lows are equal, you wait for a breakout.
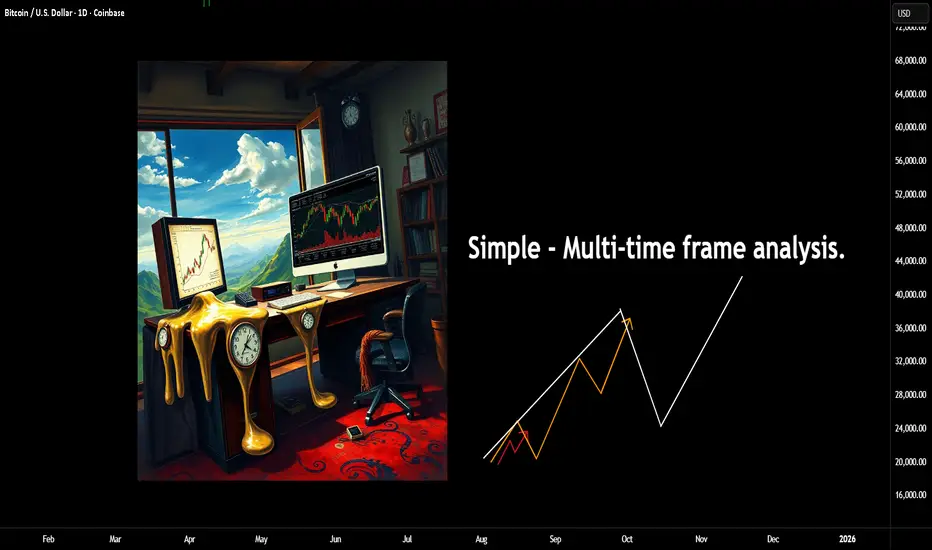
A simple way to view multi time-frame analysisHere's another area many traders struggle with. The real value in using multiple timeframes is to know what to look for and when to look for it!
As I have mentioned in a lot of my posts, all of this comes back to Dow theory; you don't need to make life hard on yourself. instead, simplify your approach and align a small number of timeframes and you will be surprised at the results.
Let me give you an example;
In this image above, you can see a clear push-up and a high, then a pullback.
Why not use this high? It had a clear change of character to the downside.
Well, the answer is - you would view these as separate timeframes. Although they are viewed on the exact same timeframe as my image. One you could call a primary trend and one a secondary.
For a bit more depth, see this post.
If you are already familiar with the idea, then the next thing you want to understand. What phase is the primary trend in?
This becomes important as you drill down to the entry timeframes, as what you are trying to do is to understand a general bias. Once you grasp this, you can even trade the counter-trend moves (if you like).
Ok, so with that being said. Let's add the second timeframe.
As you can see, the orange line represents the primary trend, whilst the internal white path now represents the secondary trend. Why this is key, is because at this stage, the larger trend also could be doing one of two things. Going UP or DOWN.
Up -
Down -
Once you understand the larger trend, the internal will work to facilitate the next leg of that higher degree. Of course, there will be reversals (but that's for another post).
Working with an uptrend for the sake of an example;
Price pushes up and then pulls back.
If we know the ranges, I have covered this in several posts recently (mechanical). We can quickly identify the higher timeframe range.
Once price breaks above this range, at some stage, you will expect to see a lower timeframe change of character, which is simply the start of a pullback on this higher timeframe. There are several ways to take advantage of this (again, another post).
But working with this example. The first move above the range happened overnight or when you were not at your desk. You now have the information to work with the next phase.
Assuming price is in a larger uptrend, you want to start to align these timeframes.
This will be the case regardless of where in the move you are.
These are only examples.
This image above shows the trigger trend in alignment with the higher timeframe. This image below shows the opposite.
Of course, there is more risk involved here as the bigger trend is going the other way, but as long as you acknowledge that, then opportunities will present themselves in both directions.
Here's a few examples on where or how to use this.
The second option is using the higher (secondary) not the trigger, but exactly the same concept.
Finally, the third option is using all three of the timeframes.
Firstly, you know the larger move is up. The second has started to align. Finally, the trigger trend (the minor) has it's change of character and you expect now the move to continue to the upside.
This gives a higher risk-to-reward ratio and often it's a higher probability in terms of the outcome. For the simple reason, the two higher timeframes now agree.
Some of the other posts connected to this one.
Anyways!
Take it easy.
Disclaimer
This idea does not constitute as financial advice. It is for educational purposes only, our principal trader has over 25 years' experience in stocks, ETF's, and Forex. Hence each trade setup might have different hold times, entry or exit conditions, and will vary from the post/idea shared here. You can use the information from this post to make your own trading plan for the instrument discussed. Trading carries a risk; a high percentage of retail traders lose money. Please keep this in mind when entering any trade. Stay safe.
Blockchain Analysis in the Global Trade Market1. Overview of Blockchain in Global Trade
Global trade involves multiple players: exporters, importers, customs authorities, freight forwarders, banks, insurance firms, and suppliers. Each participant maintains separate digital or paper-based records, leading to mismatches, delays, and opportunities for manipulation. Blockchain solves these issues by creating a decentralized, immutable ledger shared among all authorized participants.
By enabling real-time data exchange, blockchain ensures that every transaction—from production to shipment to payment—is recorded transparently and securely. This enhances trust among stakeholders who often do not know each other but rely on shared documents and financial instruments.
Blockchain’s integration in global trade also connects with technologies like IoT, AI, and digital currencies, making it a foundational layer of the future digital economy.
2. Key Components of Blockchain in Global Trade Analysis
A. Distributed Ledger Technology (DLT)
At its core, blockchain is a distributed ledger replicated across many nodes. In global trade, nodes may represent banks, customs, shipping lines, or businesses. Transactions are updated simultaneously across nodes, eliminating data silos and reducing paperwork.
B. Smart Contracts
Smart contracts automate agreements. For example:
A payment is released only when goods reach the destination port.
Insurance claims are triggered automatically when shipment conditions fail (temperature, humidity, etc.).
These contracts reduce disputes and delays.
C. Cryptographic Security
All data is secured through encryption and digital signatures, preventing tampering. This is crucial in trade where document forgery—like fake bills of lading—is a major issue.
D. Permissioned vs. Public Blockchains
Most trade blockchains are permissioned, meaning only verified stakeholders access the system. This protects sensitive commercial data while preserving transparency.
3. Applications of Blockchain in Global Trade
1. Trade Finance
Trade finance involves letters of credit (LCs), bank guarantees, and invoice financing. Traditional LC processes take days due to physical document verification. Blockchain reduces this to minutes by storing and validating documents digitally.
Banks can track every step, minimizing fraud like double financing or fake invoices. Companies such as HSBC, Standard Chartered, and DBS already use blockchain-based trade finance networks like Contour, Marco Polo, and We.Trade.
2. Supply Chain Transparency
Blockchain allows end-to-end visibility of goods as they move across borders. Every step—manufacturing, warehousing, shipping, customs clearance—is recorded on-chain.
This benefits:
Consumers, who can verify product authenticity.
Manufacturers, who can prove ethical sourcing.
Regulators, who can track compliance and taxes.
Businesses, who can monitor performance in real time.
Industries like food, pharmaceuticals, luxury goods, and electronics rely heavily on blockchain-based tracking.
3. Customs and Cross-Border Clearance
Customs clearance is one of the biggest bottlenecks in international trade. Blockchain enables:
Real-time sharing of documents.
Automated verification.
Reduced risk of smuggling and tax evasion.
Countries like Singapore, UAE, and the EU are piloting blockchain-driven customs models.
4. Logistics and Shipping Documentation
The shipping industry still uses paper-based Bills of Lading, which are vulnerable to loss and fraud. Blockchain digitizes these documents (eB/L), making them instantly shareable and verifiable.
Platforms like TradeLens, though discontinued, proved that blockchain could reduce shipping times by 40% through data integration.
5. International Payments and Digital Currencies
Blockchain allows:
Faster cross-border payments.
Lower transaction fees.
Reduced dependency on intermediaries like SWIFT.
Central Bank Digital Currencies (CBDCs) are becoming part of global trade settlements, enabling faster and more transparent payment processes.
4. Benefits of Blockchain in Global Trade
1. Transparency and Traceability
Every transaction is visible to authorized users, building trust in the supply chain. Counterfeit products, illegal trafficking, and misreporting become harder.
2. Reduction of Fraud
Since data cannot be altered once recorded, fraudulent activities involving documents, invoices, or payments are drastically reduced.
3. Faster Processes and Lower Costs
Blockchain eliminates physical paperwork and reduces reconciliation time. Automation through smart contracts speeds up customs, shipments, and payments.
Studies show blockchain can cut trade processing costs by 20–30%.
4. Increased Efficiency in Supply Chains
Real-time tracking helps companies optimize inventory, reduce delays, and improve forecasting.
5. Enhanced Security
Blockchain’s cryptographic structure protects data from cyberattacks and unauthorized access.
5. Challenges of Blockchain Adoption in Global Trade
While the benefits are transformative, several challenges exist:
A. Lack of Standardization
Different countries and companies use different systems, making interoperability difficult. A global trade blockchain standard is still emerging.
B. Regulatory Uncertainty
Many regulators do not fully understand blockchain, leading to inconsistent policies across borders.
C. Integration With Legacy Systems
Most global trade operations still run on outdated technology. Upgrading is expensive and time-consuming.
D. Privacy Concerns
Even in permissioned blockchains, companies fear exposing sensitive pricing, supplier details, or strategic information.
E. Scalability
High volumes of global transactions require powerful blockchain networks that can scale without compromising speed or security.
6. Case Studies and Real-World Adoption
1. Maersk & IBM – TradeLens
Despite shutting down in 2022, TradeLens showed the potential of blockchain in shipping, including:
40% faster document processing
Fraud detection using digital document verification
Global port integration
2. Dubai Blockchain Strategy
Dubai aims to become the first blockchain-powered government, using it for customs, trade, and logistics.
3. Singapore’s Networked Trade Platform (NTP)
A unified blockchain-driven platform used by traders, banks, and customs to streamline documentation.
4. Walmart & Food Traceability
Walmart uses blockchain to track food products, reducing traceability time from 7 days to 2 seconds.
7. The Future of Blockchain in Global Trade
Blockchain will increasingly shape global commerce by enabling:
Fully digital ports and customs checkpoints
AI-powered supply chain forecasting using blockchain data
Widespread use of CBDCs for trade settlements
Tokenization of assets, allowing fractional ownership of ships, cargo, warehouses, and commodities
Interconnected global blockchain networks across continents
Within the next decade, blockchain may eliminate traditional paper-based trade systems completely, creating a fully transparent, automated, and trusted global trading environment.
Conclusion
Blockchain analysis in the global trade market reveals a technology with transformative potential. It addresses the most critical pain points in international commerce: lack of transparency, fraud, delays, high costs, and inefficient documentation. By introducing decentralization, immutability, smart contracts, and secure data sharing, blockchain creates a foundation for faster, safer, and more efficient global trade. Although challenges remain in regulatory acceptance and standardization, the continuous expansion of blockchain pilot programs and digital payment systems signals that blockchain will become a core infrastructure for global trade in the future.
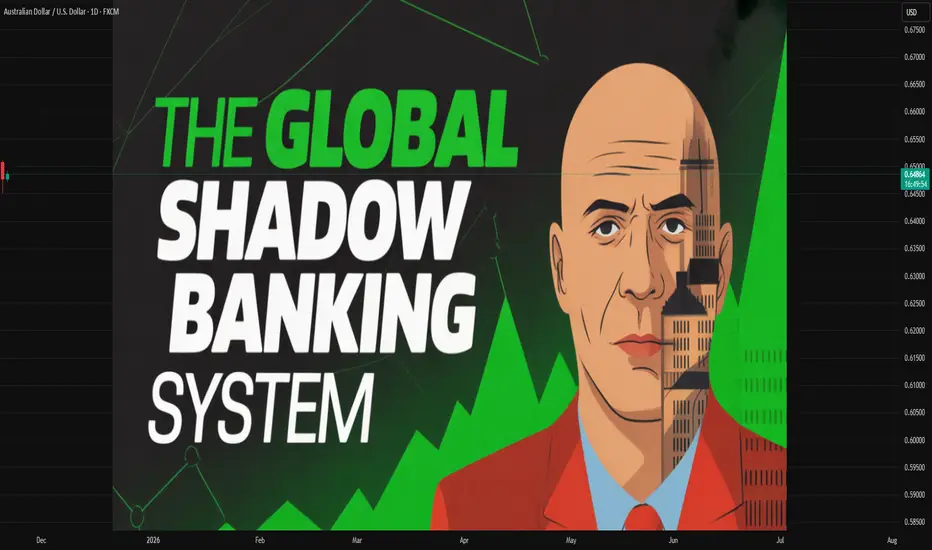
The Global Shadow System1. Foundations of the Global Shadow System
The shadow system emerged alongside globalization. As the movement of capital accelerated in the 20th century, governments liberalized financial markets and reduced restrictions on cross-border flows. While these steps facilitated investment and economic growth, they also opened channels for unmonitored capital movement.
The system rests on four foundations:
1.1 Secrecy
Secrecy is the lifeblood of the shadow world. Whether in offshore financial centres or covert diplomatic channels, secrecy shields actors from accountability. Jurisdictions like the British Virgin Islands, Cayman Islands, Panama, and Luxembourg built industries around confidential structures, shell companies, and trusts.
1.2 Regulatory Fragmentation
Different countries have different laws. Global actors exploit these inconsistencies, creating a patchwork of loopholes and arbitrage opportunities. A company may be headquartered in one country, registered in another, banked in a third, and operational in dozens of others—all to avoid taxes, scrutiny, or liability.
1.3 Financial Innovation
Derivatives, complex securities, and digital assets—while beneficial in many ways—also enable obfuscation. Financial technology often evolves faster than regulation, creating zones where oversight lags behind activity.
1.4 Geopolitical Competition
Nations sometimes encourage secret channels to advance their interests. Intelligence services run covert operations; states use secret funding networks; governments enable their corporations to operate with minimal oversight abroad.
2. The Financial Shadow World
The financial sector contains some of the most sophisticated components of the global shadow system. The most prominent elements include:
2.1 Offshore Tax Havens
These jurisdictions specialize in:
Low or zero taxation
Strict banking secrecy
Minimal reporting requirements
Offshore havens attract corporations, private wealth, and even government officials wanting to move funds discreetly. Research suggests that trillions of dollars of global wealth are parked offshore, depriving nations of tax revenue and hiding ownership structures.
2.2 Shell Companies and Trusts
A shell company exists mainly on paper but can hold assets, open bank accounts, and move funds. Trusts further obscure the true owner by separating legal ownership from beneficiaries. These instruments are commonly used in:
money laundering
tax avoidance
political corruption
global mergers and acquisitions
2.3 Shadow Banking
Shadow banking refers to financial intermediaries that perform bank-like functions but are not regulated like banks. This includes hedge funds, private equity, money market funds, and structured investment vehicles. The 2008 financial crisis exposed how massively interconnected shadow banking is with the formal economy.
2.4 Illicit Financial Flows
Illicit flows encompass illegal money from corruption, trafficking, sanctions evasion, and organized crime. The global shadow system provides channels for these funds to move across borders and integrate into the legal economy.
3. Political and Geopolitical Components
Beyond finance, the global shadow system includes political and geopolitical networks that operate invisibly or unofficially.
3.1 Backdoor Diplomacy
Nations often communicate secretly through back channels:
intelligence services
private envoys
intermediaries in third countries
These channels allow negotiations, coup planning, and geopolitical coordination away from public view.
3.2 Corporate Influence and Lobby Networks
Multinational corporations exert massive influence on global rules. Lobby groups, think tanks, political donations, and policy consultants form a shadow ecosystem that shapes trade agreements, tax policies, and regulations without direct public accountability.
3.3 Intelligence Alliances
Agreements like the Five Eyes network operate partly in secrecy, sharing surveillance, cyber intelligence, and counterterrorism data. Such networks influence global security policies without democratic transparency.
3.4 Private Military and Security Companies
Firms like Wagner (Russia), Blackwater/Academi (US), and other PMCs operate in conflict zones, often without public oversight. They influence wars, resource extraction, and political transitions, forming a covert layer of global warfare.
4. Shadow Economies and Illicit Trade
The shadow economy includes activities that are legal in some contexts but hidden from regulators, as well as outright illegal sectors.
4.1 Black Markets
These markets deal in:
narcotics
arms
counterfeit products
human trafficking
wildlife trade
The shadow system provides the logistics, banking, and distribution channels needed to sustain these markets.
4.2 Crypto and Digital Shadows
Cryptocurrencies and digital assets have added new layers:
privacy coins like Monero
decentralized finance (DeFi)
darknet markets
ransomware payments
Though blockchain is transparent, anonymity tools create shadowed zones of activity.
4.3 Informal Economies
Millions of workers globally operate in informal sectors without legal protections. While not criminal, these activities form part of the grey economy that escapes tax and regulatory systems.
5. How the Shadow System Shapes Global Outcomes
The global shadow system influences the world in several powerful ways:
5.1 Rising Inequality
The wealthy use offshore structures to minimize taxes, while ordinary citizens face stricter rules. This widens the gap between elites and the public.
5.2 Policy Distortion
Governments may appear powerless against corporate tax avoidance or illicit flows, but often they are influenced by the same networks that benefit from secrecy.
5.3 Financial Crises
Unregulated financial products and shadow banking were major contributors to the 2008 crisis and remain potential future risks.
5.4 Undermined Democracy
Opaque funding, influence networks, and secret diplomacy reduce the transparency that democracies require to function.
5.5 Geopolitical Manipulation
Nations use covert financial and intelligence networks to influence elections, destabilize rivals, and secure strategic resources.
6. Efforts to Regulate the Shadow System
International bodies and governments have attempted reforms:
OECD’s BEPS framework targets corporate tax avoidance.
FATF regulations target money laundering and terror financing.
Automatic exchange of financial information reduces secrecy in banking.
Pandora and Panama Papers revelations pressured certain offshore centres.
Despite these efforts, the shadow system persists due to powerful incentives, political protection, and the complexity of global finance.
Conclusion
The global shadow system is an invisible but deeply influential structure shaping our world. It is built on secrecy, financial engineering, regulatory loopholes, and geopolitical backchannels. It affects economies, politics, crime, diplomacy, and global development. Understanding its mechanisms helps explain why inequality persists, why financial crises erupt, and why global governance remains fragmented. The shadow world is not merely a hidden side of globalization—it is its backbone.
Offshore Banking BoomThe Rise, Evolution, and Role of Modern Financial Havens
The global financial landscape has changed dramatically over the past few decades, and one of the most influential transformations has been the rapid expansion of offshore banking. Once viewed as the exclusive domain of wealthy elites, multinational companies, and select institutions, offshore banking has evolved into a vast, interconnected financial ecosystem. Today, it plays an integral role in global capital flows, international investment, cross-border trade, and wealth management. This phenomenon—often referred to as the offshore banking boom—is fueled by globalization, digital finance, low-tax and tax-neutral jurisdictions, and increasingly sophisticated financial structures.
Understanding how offshore banking operates and why financial havens continue to grow helps illuminate broader trends in the world economy, from tax competition and regulatory arbitrage to geopolitical strategy and digital finance.
1. What Is Offshore Banking?
Offshore banking refers to holding financial assets, bank accounts, investment structures, or corporate entities in a foreign country—usually in jurisdictions known for low taxes, secrecy laws, asset protection, and investor-friendly regulations. These jurisdictions are commonly called offshore financial centers (OFCs) or tax havens.
The core features of offshore banking include:
Low or zero taxation on income, capital gains, or corporate profits.
High confidentiality regarding client identities, transactions, and holdings.
Asset protection structures such as trusts, foundations, and offshore companies.
Flexible regulations and business formation laws.
Stable financial and political environments, often reliant on global foreign capital.
Historically, offshore banking catered primarily to wealthy individuals seeking privacy. Today, it has expanded to serve global corporations, fintech investors, hedge funds, cryptocurrency businesses, and digital nomads.
2. Why Offshore Banking Is Booming
The offshore banking industry is experiencing unprecedented growth, driven by several structural forces in the world economy.
A. Globalization of Trade and Capital
As supply chains and investments move across borders, companies increasingly require multi-jurisdictional financial accounts, enabling them to manage global cash flows, hedge currency risks, and optimize taxation.
B. Rise of Digital Finance
Fintech platforms, digital banks, e-residency programs (such as Estonia), and crypto-enabled financial services have made offshore banking more accessible than ever before. Opening an offshore account no longer requires physical travel; it can be done remotely in many jurisdictions.
C. Tax Optimization and Competitive Jurisdictions
Countries like Singapore, Switzerland, the Cayman Islands, and Dubai compete to attract global capital by offering:
near-zero corporate tax
simplified business structures
minimal reporting requirements
This global tax competition continues to push businesses into supportive OFCs.
D. Asset Protection Needs
Families, entrepreneurs, and investors use offshore structures to shield assets from:
litigation
political instability
currency devaluation
regulatory overreach
In unstable regions, offshore banking is considered a financial safety net.
E. Increase in Global Wealth
With the rise of wealth in Asia, the Middle East, and emerging markets, more individuals seek international diversification and privacy, further fueling offshore activity.
3. The World’s Leading Financial Havens
While dozens of jurisdictions offer offshore banking services, some have emerged as global leaders due to their legal frameworks, reputation, and financial infrastructure.
1. Switzerland
Long considered the benchmark for banking secrecy, Switzerland remains a premier haven due to:
strong privacy laws
political neutrality
world-class financial institutions
Although secrecy rules have softened due to international pressure, Switzerland remains dominant for wealth management.
2. Singapore
The fastest-growing Asian financial hub, offering:
low taxes
advanced digital banking
strategic location
strong rule of law
Singapore is especially attractive for Asian HNWIs and global corporations.
3. Cayman Islands
Home to thousands of hedge funds, private equity vehicles, and corporate entities due to:
zero corporate tax
flexible regulatory structure
major financial expertise
It is a preferred destination for fund structuring.
4. Dubai / UAE
Dubai has become a modern financial haven driven by:
0% tax on personal income
business-friendly free zones
no currency controls
strong banking privacy
It is especially attractive for investors in the Middle East, Asia, and Africa.
5. Luxembourg
Known for its sophisticated investment fund industry, stable regulations, and EU membership, Luxembourg is a preferred haven for institutional investors.
4. Economic Impact of Offshore Banking
Offshore finance plays a major role in the global economy. Its impacts can be both positive and negative.
Positive Impacts:
A. Facilitates Global Investment
Offshore centers channel trillions of dollars in global capital, enabling:
cross-border trade
foreign direct investment (FDI)
startup funding
institutional investment
These flows support economic growth in both developed and developing nations.
B. Encourages Regulatory Innovation
To attract capital, financial havens continually modernize:
digital banking platforms
fintech infrastructure
asset protection laws
This pushes global financial systems to innovate as well.
C. Supports International Diversification
Offshore banking provides investors with safer, more stable environments, especially in regions with:
high inflation
political instability
capital controls
Negative Impacts:
A. Tax Base Erosion
Critics argue offshore havens allow corporations to legally reduce tax liability, decreasing government revenues in home countries.
B. Lack of Transparency
Although many havens have improved compliance, secrecy laws can still attract illicit activities, including money laundering or corruption.
C. Wealth Inequality
Offshore structures are more accessible to the wealthy, potentially widening global inequality.
5. Regulatory Pressure and Global Reforms
Because of the influence and sometimes controversial nature of offshore banking, global regulatory bodies have taken steps to increase transparency and curb misuse.
Key reforms include:
A. FATF Regulations
The Financial Action Task Force (FATF) enforces rules against:
money laundering
terror financing
opaque transactions
Member countries must comply with strict reporting obligations.
B. OECD’s Common Reporting Standard (CRS)
CRS requires automatic exchange of financial information among participating countries, reducing secrecy around offshore accounts.
C. BEPS Initiative
The Base Erosion and Profit Shifting (BEPS) project aims to prevent companies from shifting profits to low-tax jurisdictions artificially.
These reforms have not eliminated offshore banking but have changed its nature—pushing it toward legitimacy and compliance.
6. The Future of Offshore Banking
The offshore banking boom is far from over; it is evolving with technological and economic trends.
A. Digital Offshore Banks
Online-only institutions that offer:
multi-currency accounts
crypto custodial services
remote onboarding
Digital nomads and global entrepreneurs increasingly adopt these services.
B. Rise of Crypto Havens
Countries like Malta, UAE, and El Salvador are positioning themselves as crypto-friendly hubs, offering:
favorable digital asset laws
blockchain-based corporate structuring
crypto banking licenses
C. AI-Driven Compliance
AI and machine learning are improving anti-money-laundering (AML) compliance, making offshore systems more transparent.
D. Strengthening of Legitimate Use Cases
Growing global middle class, international entrepreneurs, and remote businesses are likely to drive further demand for legal offshore structures.
Conclusion
The offshore banking boom represents a pivotal shift in global financial dynamics. While financial havens have historically been associated with secrecy and wealth preservation, today they serve a diverse, legitimate, and rapidly expanding international client base. They facilitate global investment, promote financial innovation, and provide stability in an unpredictable world. Although regulatory pressures will continue to shape the industry, offshore banking is poised to remain a powerful component of global finance for decades to come.

WTO’s Role in Global Trade1. Ensuring a Rules-Based Trading System
One of the fundamental roles of the WTO is to provide a structured, predictable, and transparent system of global trade rules. These rules cover goods, services, intellectual property, investment, and dispute settlement.
Key goals of the rules-based system include:
Reducing trade barriers such as tariffs, quotas, and subsidies
Ensuring fairness by preventing discriminatory trade practices
Promoting transparency so countries publish and follow their trade policies
Creating predictable trade conditions so businesses can invest confidently
This rules-based foundation is essential for preventing trade wars, protecting smaller economies, and maintaining stability in international markets.
2. Trade Liberalization Through Negotiations
The WTO is also a major venue for multilateral trade negotiations, known as “rounds.” Countries come together to negotiate agreements to reduce tariffs and non-tariff barriers.
Examples of WTO negotiation achievements include:
Reduction of average global tariffs from 40% (1947) to below 5% today
Agreements on agriculture, textiles, services, and intellectual property (TRIPS)
Commitment to fair competition and market access
Although negotiations such as the Doha Development Round have been slow, the WTO remains the only global platform where 164 member nations negotiate trade norms collectively.
3. Dispute Settlement and Conflict Resolution
One of the most influential functions of the WTO is its Dispute Settlement Body (DSB). It helps countries resolve trade conflicts peacefully through a legal process rather than political or economic retaliation.
Why this matters:
Without the WTO, powerful nations might impose unilateral trade sanctions.
Smaller countries get a fair chance to challenge wrongful trade practices.
Decisions are based on law, not political pressure.
Countries like India, the U.S., the EU, China, and Brazil have all used the WTO dispute settlement system to challenge unfair trade restrictions.
This mechanism creates confidence among nations that the rules they agreed upon will be upheld.
4. Monitoring and Reviewing National Trade Policies
The WTO conducts Trade Policy Reviews (TPRs) to monitor the trade policies of member nations. The frequency depends on the country’s share of global trade—major economies are reviewed every two years.
Benefits of TPRs:
Promotes transparency
Helps identify potential trade barriers
Encourages countries to align policies with WTO rules
Builds trust among trading partners
This monitoring function ensures that the global trade environment remains stable and predictable.
5. Capacity Building and Technical Assistance
The WTO provides training, technical support, and capacity-building programs especially for developing and least-developed countries (LDCs). Many nations lack expertise in trade law, negotiation, or global standards.
These programs help countries:
Strengthen export capabilities
Improve trade infrastructure
Understand complex trade rules
Participate effectively in global negotiations
This contributes to a more inclusive global trading system where poorer nations also benefit from international trade.
6. Promoting Fair Competition
The WTO aims to create a level playing field by ensuring that trade is free from unfair practices such as:
Dumping (selling goods below cost)
Excessive export subsidies
Discriminatory practices
Agreements like the Agreement on Subsidies and Countervailing Measures (SCM) and Anti-Dumping Agreement help in identifying and addressing such distortions.
Fair competition helps protect local industries while enabling healthy global commerce.
7. Facilitating Trade in Services
The General Agreement on Trade in Services (GATS) is part of the WTO framework and expands trade liberalization beyond goods to include services.
Key service sectors covered:
Banking and financial services
Telecommunications
Tourism
Professional services
Transportation
By promoting service-sector openness, the WTO supports the growth of modern economies that rely heavily on digital, financial, and knowledge-based services.
8. Regulating Intellectual Property Rights (TRIPS)
The Agreement on Trade-Related Aspects of Intellectual Property Rights (TRIPS) is one of the most comprehensive international agreements on intellectual property (IP).
TRIPS benefits global trade by:
Protecting patents, copyrights, and trademarks
Encouraging innovation and creativity
Promoting technology transfer
Balancing IP protection with access to essential goods (e.g., medicines)
This agreement is particularly important in sectors like pharmaceuticals, biotechnology, and manufacturing.
9. Supporting Economic Development
The WTO’s role in helping developing countries integrate into the global economy is critical. Special and Differential Treatment (SDT) provisions allow these nations:
Longer timeframes to implement agreements
Flexibility in tariff reductions
Preferential market access
This gradually helps them build competitiveness and industrial capacity.
Moreover, global trade under WTO rules has contributed to:
Job creation
Higher income levels
Technology transfer
Industrial modernization
Many emerging economies, including India, China, Brazil, Vietnam, and South Africa, have benefited significantly from WTO-facilitated trade growth.
10. Addressing Modern Trade Challenges
As global trade evolves, the WTO addresses new-age challenges such as:
E-commerce and digital trade
Climate change and environmental policies
Global supply chain disruptions
Trade-related sustainability issues
Pandemic-era trade restrictions
Although reform is needed, the WTO remains central to shaping the future of global trade governance.
Conclusion
The WTO plays a pivotal role in ensuring stability, predictability, and fairness in global trade. Through its rules-based framework, dispute settlement mechanism, negotiation platform, and capacity-building programs, it fosters an environment where nations—big and small—can engage in international trade transparently and efficiently. Despite facing challenges such as stalled negotiations and geopolitical tensions, the WTO remains the cornerstone of the global trading system. Its continued relevance lies in its ability to adapt to emerging economic realities, promote development, and maintain global cooperation. Ultimately, the WTO's contributions help create a more connected, stable, and prosperous world economy.
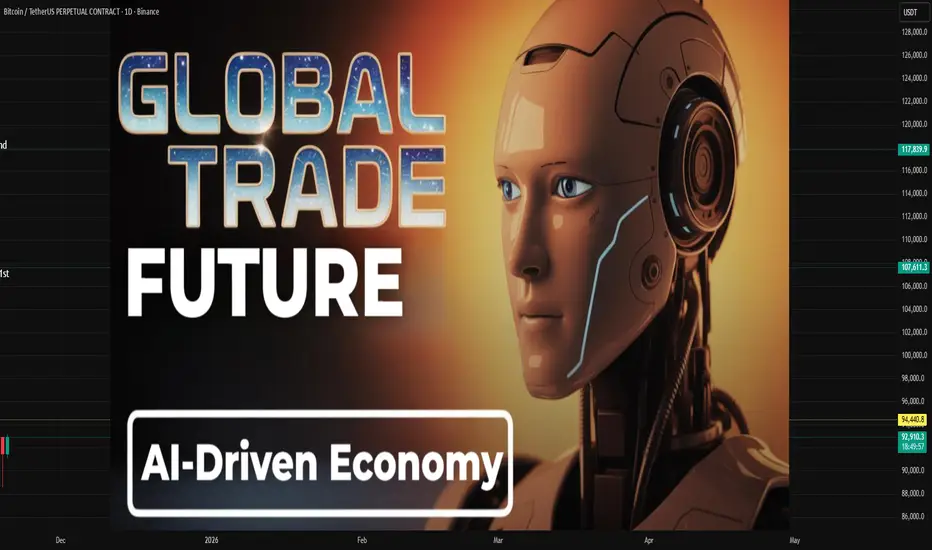
The Future of Global Trade in an AI-Driven Economy1. AI Will Redefine Supply Chains into Intelligent, Self-Optimizing Systems
Traditional supply chains rely on manual forecasting, physical documentation, and human-driven coordination. In contrast, AI-driven supply chains are forecast-based, automated, and self-correcting.
Key Transformations
Predictive demand forecasting
AI models analyze billions of data points—consumer behavior, climate patterns, geopolitical risks, and market trends—to predict demand more accurately than human experts.
Real-time supply chain visibility
AI-powered sensors, IoT devices, and satellite data will track shipments globally, allowing companies to respond instantly to disruptions such as natural disasters, port congestion, or political events.
Autonomous logistics
Self-driving trucks
AI-assisted cargo routing
Automated warehousing and robotic picking systems
These innovations will slash transportation costs, shorten delivery times, and reduce human errors.
Optimization of global trade routes
AI algorithms will determine the most cost-efficient and lowest-risk routes based on weather conditions, fuel prices, geopolitical risks, maritime traffic, and customs regulations.
The result is a global supply chain that behaves almost like a living organism—constantly learning, adapting, and optimizing itself.
2. AI Will Accelerate the Shift Toward Digitally Delivered Trade
Global trade traditionally revolved around physical goods such as oil, textiles, machinery, and electronics. However, AI is boosting the share of digital trade—software, cloud services, algorithms, AI models, digital IP, and data flows.
How AI Expands Digital Trade
AI models and algorithms become exportable products.
Businesses offer AI-as-a-service (AIaaS) across borders.
Data becomes a valuable traded commodity.
Virtual goods, digital design, and generative content enter global markets.
Cloud computing and remote AI processing remove the need for physical shipping.
This means global trade will increasingly rely on data flows instead of cargo flows, reducing logistical barriers and creating new global dependencies based on digital infrastructure rather than physical resources.
3. Countries Will Compete Not for Natural Resources, but for Data and AI Capabilities
Historically, global trade dominance depended on:
Oil reserves
Industrial capacity
Cheap labor
Military power
In an AI-driven economy, data, computing infrastructure, digital talent, and innovation ecosystems become the new sources of competitive advantage.
Winners in the AI Economy Will Be Countries That:
Possess large and clean datasets
Have advanced semiconductor manufacturing
Attract top AI talent
Provide strong digital infrastructure (5G/6G, cloud, quantum computing)
Maintain innovation-friendly regulatory environments
Build strong AI-driven industries like fintech, robotics, and biotech
This shift could widen the gap between AI leaders (such as the US, China, South Korea, Japan, and parts of Europe) and developing countries lacking digital readiness. However, AI also creates new opportunities for emerging economies to leapfrog by integrating AI into agriculture, manufacturing, logistics, and services.
4. AI Will Transform Trade Finance and Cross-Border Transactions
The global trade finance system is traditionally slow, paperwork-heavy, and vulnerable to fraud. AI and digital technologies such as blockchain will modernize this ecosystem.
Transformations in Trade Finance
Automated verification of invoices and shipping documents
AI can verify authenticity and detect irregularities within seconds.
Fraud detection and risk assessment
Machine learning models analyze transaction data to prevent financial crimes and reduce credit risk.
Smart contracts
Trade agreements can automatically execute when conditions are met, improving trust between international partners.
Faster cross-border payments
AI enhances digital payment systems such as UPI cross-border, CBDCs (Central Bank Digital Currencies), and blockchain-based remittances.
The result is a frictionless, error-free, and transparent global financial environment.
5. AI-Driven Manufacturing Will Reshape Global Trade Patterns
As AI and automation become mainstream, manufacturing will be less dependent on low-cost labor. This has major implications for global trade.
Key Impacts
Reshoring of manufacturing
Developed economies may bring back factories because AI-enabled robots can produce goods cheaply without relying on offshore labor.
Customized production
AI and 3D printing allow companies to manufacture goods closer to consumers, reducing the need for long-distance shipping.
Supply chain diversification
Firms will use AI to identify and reduce overdependence on a single country, potentially reducing China’s dominance in some areas.
Rise of “smart factories”
Countries like India, Vietnam, Mexico, and Indonesia could emerge as global manufacturing hubs if they adopt AI-driven robotics and automation rapidly.
Thus, trade flows will shift toward nations that combine digital capabilities with industrial strengths.
6. AI Will Drive New Trade Policies and Digital Regulations
Governments globally are drafting policies around AI governance, data privacy, digital taxation, and ethical AI. These regulations will significantly influence global trade.
Key Policy Areas
Data sovereignty (who owns data?)
Cross-border data flow restrictions
AI safety and ethical standards
Digital services taxes
AI intellectual property rights
Fair access to AI infrastructure
Countries adopting compatible digital regulations will integrate more deeply into global trade networks, while fragmented regulations may create digital barriers.
7. Risks and Challenges in AI-Driven Global Trade
While AI promises huge benefits, it also introduces several challenges.
1. Digital inequality
Countries that lack AI infrastructure may fall behind, widening global inequality.
2. Job displacement
Automation may reduce certain traditional jobs across manufacturing, logistics, and administration.
3. Geopolitical tensions
AI, data, and chips are becoming the new battlegrounds for global power competition.
4. Cybersecurity threats
AI-enhanced cyberattacks could disrupt trade, steal intellectual property, or target critical infrastructure.
5. Dependence on AI systems
Over-reliance on algorithms may lead to systemic failures if AI models malfunction or are manipulated.
Managing these risks is crucial for achieving sustainable, inclusive AI-driven economic growth.
Conclusion: The AI-Driven Future of Global Trade
The future of global trade in an AI-driven economy will be characterized by speed, automation, intelligence, and connectivity. Goods will move more efficiently, digital products will dominate international commerce, and countries with advanced AI ecosystems will shape global economic power.
AI-enabled supply chains, predictive analytics, autonomous logistics, and digitized trade finance will make global trade more seamless and resilient. However, the benefits will not be evenly distributed unless nations invest in digital infrastructure, skills development, ethical AI practices, and international regulatory coordination.
The Global Trade Market Is ShiftingDynamics, Drivers, and the Future of International Commerce
The global trade market is undergoing one of the most significant transitions in modern economic history. For decades, globalisation shaped the world’s economic landscape—reducing trade barriers, integrating economies, and enabling companies to expand across borders with unprecedented ease. However, the world is now witnessing a shift marked by geopolitical tensions, supply chain disruptions, rising protectionism, technological transformation, and new regional economic alliances. This shift does not signal the end of global trade; rather, it marks the evolution of a more complex, diversified, and strategically fragmented global trade system.
This transformation is influencing industries, governments, businesses, investors, and consumers, creating both risks and opportunities. Understanding these shifts is crucial for anyone engaged in global business, financial markets, policymaking, or strategic planning.
1. From Hyper-Globalisation to Strategic Globalisation
Between the 1990s and early 2010s, globalisation accelerated rapidly. Countries pursued free trade agreements, multinational corporations expanded production worldwide, and emerging economies—especially China—became major manufacturing hubs.
However, the model of “hyper-globalisation” began to slow after 2015 due to:
geopolitical conflicts
rising economic nationalism
trade wars (notably U.S.–China)
global pandemic disruptions
technological competition
As a result, economies are shifting from traditional globalisation to strategic globalisation—a system where trade decisions focus on resilience, security, and long-term stability rather than just cost efficiencies.
2. Geopolitical Tensions and the Rise of Fragmented Trade Blocs
One of the most significant forces shaping global trade is geopolitics. Rivalries between major powers—especially the U.S., China, and the EU—are influencing global supply chains and trade flows.
Key geopolitical drivers:
U.S.–China strategic decoupling
Both countries are reducing their dependence on each other in technology, manufacturing, and investment sectors.
Russia–Ukraine conflict
Resulted in major disruptions in energy, grains, and fertilizers, forcing Europe and Asia to diversify suppliers.
Middle East tensions
Affect global oil trade routes and shipping costs.
New alliances and mini-lateral agreements
Nations are forming smaller, strategic partnerships rather than large global agreements.
This geopolitical fragmentation is creating regionalization, where countries prefer trade within trusted or nearby partners.
3. The Reconfiguration of Global Supply Chains
The pandemic revealed the vulnerability of long, complex supply chains. Lockdowns, transport delays, and shortages of critical materials pushed companies to rethink their strategies.
New supply chain trends include:
Near-shoring – Moving production closer to end markets (e.g., U.S. companies shifting from China to Mexico).
Friend-shoring – Outsourcing to politically aligned nations (e.g., India gaining attention due to its stable relations with the West).
China+1 strategy – Businesses diversifying manufacturing to India, Vietnam, Thailand, and Indonesia.
Automation and digital supply chains – Enhanced efficiency using AI, robotics, and data.
This restructuring aims to build resilience, reduce risk, and increase production agility.
4. Technological Power Shifts in Global Trade
Technology has always influenced trade, but today its role is transformational. Countries that dominate critical technologies gain economic and strategic advantage.
Key technological drivers:
Artificial Intelligence (AI)
AI-driven optimisation in logistics, trade forecasting, port automation, and smart manufacturing is reshaping global competitiveness.
Semiconductor industry shifts
To reduce dependency on Asia, the U.S. and Europe are heavily investing in local chip production.
Digital trade and e-commerce
Cross-border digital services trade is growing faster than goods trade.
Blockchain and fintech
Transforming trade finance, supply chain verification, and international payments.
These technologies change not only how goods move but how value is created in the global economy.
5. Growth of Regional Economic Powerhouses
Regional groups are becoming stronger as economies diversify trade partners and reduce reliance on global structures.
Major regional blocs gaining momentum:
RCEP (Regional Comprehensive Economic Partnership)
Now the world’s largest trade bloc, covering East Asia and the Pacific.
EU integration strengthening after supply chain disruptions
USMCA replacing NAFTA, boosting North American regional manufacturing.
African Continental Free Trade Area (AfCFTA)
Creating a unified African market.
These regional arrangements highlight how trade is shifting from global dependence to regional consolidation.
6. Sustainable Trade and Green Globalisation
Climate change regulations are influencing global trade structures. Many economies are adapting by adopting sustainability-focused strategies.
Examples include:
Carbon border taxes (EU’s CBAM) increasing trade costs for carbon-intensive imports.
Demand for clean energy equipment (solar panels, lithium batteries, green hydrogen) reshaping global export flows.
Greener logistics such as electric freight vehicles, sustainable shipping fuels, and greener ports.
Countries that lead in green technologies are becoming new trade leaders.
7. Impact on Emerging Markets and Developing Economies
The shift in global trade is especially important for emerging markets. Nations like India, Vietnam, Indonesia, and Mexico are benefiting from diversification away from China.
Advantages:
Increased FDI in manufacturing
Job creation
Integration into global supply chains
Expansion in exports of electronics, pharmaceuticals, textiles, and automobiles
However, other developing economies may face challenges due to stricter sustainability standards, rising protectionism, and limited access to advanced technologies.
8. Implications for Businesses and Investors
The shifting trade landscape affects corporate strategy, market expansion, production costs, and investment decisions.
Key implications:
Companies must diversify supply chains to reduce geopolitical risks.
Investors are shifting capital into markets benefiting from trade realignments.
Trade-dependent industries like automotive, electronics, chemicals, and energy are re-evaluating global operations.
Currency volatility and commodity price fluctuations will influence global trade profitability.
Businesses that adapt to these changes will gain competitive advantage.
9. The Future of the Global Trade Market
The global trade market is not shrinking—it is being reshaped. The future will involve:
More regional trade partnerships
Strategic, secure, and technology-driven supply chains
Increased role of AI and automation
Competition in green and digital technologies
More balanced trade flows across Asia, Europe, and the Americas
A shift toward economic security over low cost
Instead of a single global market led by one dominant nation, the future may feature multiple global trade hubs, interconnected but competitive.
Conclusion
The shifting global trade market reflects a world adjusting to new realities—geopolitical tensions, technological advances, environmental demands, and the need for resilient supply chains. This transition marks the evolution from old-style globalisation to a smarter, more secure, and strategically diversified trading system. Countries and businesses that adapt proactively to this new trade order will be best positioned to benefit from future opportunities.

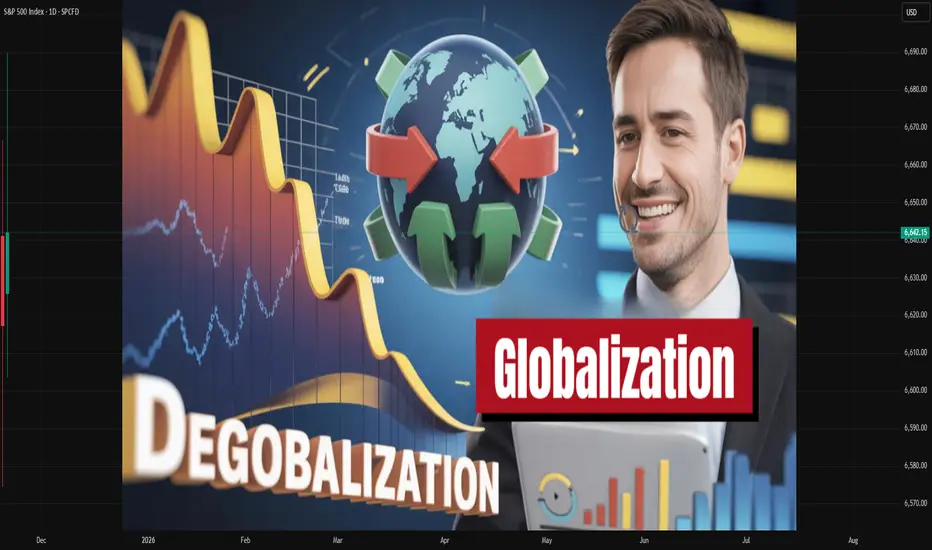
De-Globalization and Globalization: Role in the Trade Market1. What Is Globalization?
Globalization refers to the increasing interconnectedness of countries through trade, capital flows, technology, labor mobility, and communication networks. It removes barriers between nations by promoting:
Free trade agreements
Cross-border investments
Multinational corporations expanding globally
Technology transfer and innovation diffusion
Movement of goods, services, and people
Key Drivers of Globalization
Trade Liberalization: Reduction of tariffs and quotas by organizations like WTO.
Advances in Technology: Internet, logistics, digital payments, AI.
Global Supply Chains: Production spread across multiple countries.
Capital Mobility: Foreign direct investment (FDI), foreign portfolio investment (FPI).
Transportation Efficiency: Low-cost shipping, aviation growth.
Benefits of Globalization
Lower cost of goods and services.
Higher economic growth for emerging markets.
Access to global markets for domestic producers.
Innovation through global competition.
Greater consumer choices.
Challenges of Globalization
Job losses in industries exposed to global competition.
Income inequality within countries.
Over-dependence on global supply chains.
Faster transmission of economic crises.
Despite these challenges, globalization dominated world trade through the 1990s and early 2000s, shaping a highly interconnected economic landscape.
2. What Is De-Globalization?
De-globalization refers to the process of reducing global interdependence. It involves countries restricting trade, limiting foreign investments, reshoring manufacturing, and prioritizing domestic production over global integration.
The shift began with economic nationalism and strengthened due to several global events:
Key Causes of De-Globalization
Geopolitical Tensions:
US–China trade war, Russia-Ukraine conflict, Middle-East instability.
Supply-Chain Vulnerabilities:
COVID-19 exposed heavy reliance on foreign manufacturing.
Protectionism:
Rising tariffs, import bans, and industrial subsidies.
National Security Concerns:
Restrictions on semiconductor exports, defense technologies, and data.
Energy and Food Security Risks:
Nations prioritize domestic reserves to avoid shortages.
Characteristics of De-Globalization
Regionalization of trade (Asia-centric, EU-centric, US-centric blocs).
Friend-shoring and near-shoring instead of global sourcing.
Declining share of global trade in GDP.
Stricter FDI regulations.
Rise of self-reliance policies—e.g., India’s Atmanirbhar Bharat.
Impact of De-Globalization
Higher manufacturing costs.
Slower global GDP growth.
Volatile commodity and currency markets.
Strategic competition between major economies.
De-globalization does not mean an end to global trade—it indicates a restructuring toward secure and region-based trade networks.
3. Role of Globalization in the Trade Market
Globalization has been the backbone of the modern trade market for 30+ years. Its influence can be identified in multiple areas:
(a) Expansion of International Trade
Countries specialized based on comparative advantage:
China in manufacturing
India in IT services
Middle East in oil
USA in technology and finance
This specialization increased global efficiency and lowered production costs.
(b) Growth of Multinational Corporations (MNCs)
Companies like Apple, Toyota, Samsung, and Unilever built supply chains across continents, boosting cross-border trade and investments.
(c) Deep Supply Chains
Products became globally integrated.
Example: A smartphone may involve design in the US, chips from Taiwan, assembly in China, and software from India.
Such supply-chain integration increased trade volume significantly.
(d) Increased Capital Flows
Globalization enabled investors to diversify by investing in foreign stocks, bonds, and real estate. It boosted foreign direct investment (FDI) and global liquidity.
(e) Boost to Emerging Markets
Countries like India, China, Vietnam, and Indonesia benefitted from export-led growth, attracting foreign companies and creating millions of jobs.
(f) Lower Prices & Higher Consumer Choice
Global competition reduced product costs, giving consumers access to global brands at affordable prices.
4. Role of De-Globalization in the Trade Market
De-globalization has introduced new dynamics that reshape how global trade functions.
(a) Rise of Protectionism
Countries impose tariffs to protect local industries.
Examples:
US tariffs on Chinese steel and electronics
India’s import restrictions on certain electronics to promote local manufacturing
This reduces global trade flows and pushes countries toward self-reliance.
(b) Reshoring Manufacturing
Companies move factories closer to home markets to avoid supply disruptions.
This impacts trade routes and reduces dependency on distant suppliers.
(c) Regional Trade Blocs
ASEAN, EU, USMCA, and African Continental Free Trade Area (AfCFTA) are forming tighter regional trading networks.
Trade becomes more regionalized rather than global.
(d) Geopolitical Trade Wars
Strategic competition, especially US–China, impacts:
Semiconductor exports
Technology transfer
Patents and IP laws
Digital trade regulations
Such restrictions create uncertainty in global trade.
(e) Commodity & Energy Security
Nations stockpile oil, gas, and minerals to ensure autonomy.
This leads to price volatility and new trade corridors like India importing discounted oil from Russia.
5. Combined Impact on Global Trade Markets
The world is entering a hybrid phase—neither fully globalized nor fully de-globalized.
Key Trends Shaping the Future
Shift from globalization to regionalization but not complete isolation.
Digital globalization continues through data, software, AI, and digital payments.
Supply-chain diversification reduces over-reliance on any single country.
Strategic industries (chips, defense, energy) remain highly protected.
Developing countries like India, Vietnam, and Mexico gain new manufacturing opportunities.
Winners in This Transition
Countries offering supply-chain stability
Nations with strong digital and technology ecosystems
Economies able to balance both global and domestic trade strategies
Losers
Countries dependent on single-market exports
Economies heavily reliant on cheap manufacturing
Nations vulnerable to geopolitical conflicts
Conclusion
Globalization and de-globalization are not absolute states but two ends of a spectrum continually shaping the world economy. Globalization promoted trade expansion, innovation, economic growth, and international cooperation. De-globalization emerged as a corrective phase to address vulnerabilities exposed by global tensions, supply-chain crises, pandemics, and national security threats.
The modern trade market is now characterized by a blend of globalization’s connectivity and de-globalization’s strategic caution. Countries are trading more selectively, focusing on trusted partners, secure supply chains, and balanced economic policies. Going ahead, the world is likely to embrace “smart globalization,” where nations seek benefits of global trade while protecting their strategic interests.
Forex Major Pairs Trading (EUR/USD, USD/JPY, GBP/USD)1. EUR/USD – The Euro vs. the US Dollar
The EUR/USD is the most traded currency pair globally, representing the economies of the Eurozone and the United States. Its daily trading volume is massive, providing excellent liquidity and tight spreads.
Key Characteristics
High liquidity and low transaction cost
Moderate volatility, making it suitable for beginners and professionals
Strongly influenced by monetary policy divergence between the European Central Bank (ECB) and the Federal Reserve (Fed)
Factors Influencing EUR/USD
Interest Rate Decisions
When the Federal Reserve increases interest rates, USD strengthens, causing EUR/USD to fall, and vice versa. The same logic applies to ECB policy moves.
Economic Data Releases
Important indicators include:
US Non-Farm Payrolls (NFP)
Eurozone CPI (Inflation)
US GDP, PMIs, and Retail Sales
These reports can cause sharp intraday movements.
Risk Sentiment
In risk-off scenarios (fear in markets), USD strengthens as a safe-haven asset.
In risk-on environments (market optimism), EUR may strengthen.
Geopolitical events
Political instability in Europe, US policy changes, or global crises can greatly influence the pair.
Trading Strategies for EUR/USD
Trend following using moving averages
Breakout trading during major economic announcements
Range trading during low-volatility sessions (especially Asian session)
EUR/USD typically reacts cleanly to technical levels due to its high liquidity.
2. USD/JPY – The US Dollar vs. the Japanese Yen
The USD/JPY pair is the second most traded major pair. It is known for its sensitivity to interest rates, risk sentiment, and carry trade strategies.
Key Characteristics
Yen is considered a safe-haven currency
USD/JPY reacts strongly to bond market movements, especially US Treasury yields
Volatile during risk events (war, market crash, recession fears)
Factors Influencing USD/JPY
US Treasury Yield Movements
The Japanese Yen is highly sensitive to bond yields.
Rising US yields → USD strengthens → USD/JPY rises
Falling yields → JPY strengthens → USD/JPY falls
Bank of Japan (BOJ) Policies
Historically, the BOJ has maintained ultra-loose monetary policy, causing long-term yen weakness. When BOJ hints at tightening, the pair may fall sharply.
Global Risk Sentiment
In risk-off situations, investors shift to JPY, leading to USD/JPY decline.
In risk-on environments, JPY weakens, and the pair rises.
Government Intervention
Japan sometimes intervenes directly in forex markets when the yen becomes extremely weak or volatile. Such interventions cause sudden, sharp movements.
Trading Strategies for USD/JPY
Yield-driven trading: following bond yield trends
Safe-haven trading: buying JPY during risk-off events
Breakout strategies during Tokyo and London overlap
Carry trade strategy (borrowing yen at low rates to invest in higher-yield currencies)
USD/JPY often moves in clear directional waves, making trend trading effective.
3. GBP/USD – The British Pound vs. the US Dollar (‘Cable’)
Known as Cable, the GBP/USD pair is one of the most volatile major pairs. It represents the economies of the United Kingdom and the United States.
Key Characteristics
Higher volatility compared to EUR/USD
Influenced heavily by UK political events, BOE policy, and economic data
Provides good opportunities for short-term traders due to fast movements
Factors Influencing GBP/USD
Bank of England (BOE) Monetary Policy
Changes in interest rates, forward guidance, and inflation control measures significantly affect GBP.
UK Economic Data
High-impact indicators include:
CPI inflation
Wage growth
GDP data
Manufacturing & Services PMIs
Political Events
GBP/USD is sensitive to political developments such as:
Brexit negotiations
UK general elections
Government budget announcements
Risk Sentiment and Global Flows
During global uncertainty, USD strengthens, causing GBP/USD to fall.
Trading Strategies for GBP/USD
Volatility-based strategies (like Bollinger Bands)
News trading, especially during UK economic releases
Breakout strategies due to frequent sharp movements
Swing trading because the pair forms strong medium-term trends
GBP/USD is ideal for traders who can handle higher volatility and sharp reversals.
General Tips for Trading Major Currency Pairs
Follow Central Banks Closely
Policies from Fed, ECB, BOE, and BOJ shape the market direction.
Use Proper Risk Management
Volatility varies by pair; set stop-loss levels accordingly.
Watch Global Risk Sentiment
Safe-haven currencies like JPY behave differently from risk-on currencies like GBP.
Monitor Economic Calendars
High-impact events such as NFP, CPI, interest rate decisions, and geopolitical news greatly influence major pairs.
Combine Technical and Fundamental Analysis
Major pairs respond strongly to both analysis methods.
Conclusion
Trading major currency pairs like EUR/USD, USD/JPY, and GBP/USD provides opportunities for traders of all levels due to their high liquidity, consistent volatility, and predictable responses to economic data and central bank policies. Each pair has unique characteristics: EUR/USD is stable and technically clean, USD/JPY reacts strongly to yields and risk sentiment, and GBP/USD offers high volatility with rich trading opportunities for experienced traders. Understanding the factors driving these pairs and applying disciplined risk management is essential for long-term success in the forex market.

Monk Mode for Traders: The Discipline That Changes EverythingHey whats up guys, everything is about focus. If you feel stuck its might because you are just consuming trade ideas on the Trading view, scrolling Trading instagram or watching another YouTube trading videos. It feels good like working on yourself but it's not real self-development.
When I need to improve I something. Im using extreme Monk Mode to fully focus on project. Trading is mine and I hope also your lifetime project. As a trader you must master multiple aspects and elements in this area to succeed.
In the recent post I introduce schedule for the disciplined trader. This is for those who already made it and are full time traders. Today Im going to give you tips how to go extreme to acquire new skills or exit 9 - 5 slavery.
⁉️ What Monk Mode Actually Means
You don't need to wear a robe, incense, or sitting in silence for hours. Monk mode is less people, more focus. You are not running away from the world. You are simply closing the doors for a while so you can build in peace. Isolation helps you to focus only on that project and yourself. It's a bit extreme and you can do it only for some period of the time but you will come back unrecognized.
📌 I would describe it as:
• A temporary period of extreme simplicity
• Removing everything not aligned with your goals
• Working on ONE main mission. Not three. ONE !
• Mastering your mind through fewer choices and fewer distractions
📌 How long you isolate yourself and focus decides how you improve
• 30 days → reset
• 60–90 days → transformation
• 6 months → new identity
📌 Always tie it to a goal:
• Finish and Deeply understand One Trading strategy
• Pass Specific Prop Challenge
• Improve my Risk to reward ratio
• Backtest my strategy on 500 traders
📌 Come Out from Monk Mode When:
• Your mission is complete
• Your routines click
• Your discipline feels natural
• Your system is built
Then you return to normal life. Celebrate a bit. Spend time with people you love.
Take a break, but keep the strongest 50–70% of the habits, thats how you permanently update. You will might not be perfect on first time, thats normal no one is. But you will see such improvements, you will start thinking about next round. But don't go extreme, social life is important always take breaks between monk modes.
🧪 Running Monk Mode has 2 phases
• Cutting distractions and cheap dopamine
• Adding a traction and increasion focus (obsession on project)
1️⃣ Lets Cut Distraction's
❌ 1. Adjust your phone - Social media and set Do not disturb permanently
Delete the apps or block them during your work window. I know it can feel hard, but harder it feels more you need it. Social media and short term content is distraction loop. During the monk mode Im cutting it completely. In normal life ( I have 30 minutes planned window) Social media are not bad if you visit them with intention. Just for curiosity put phone usage timer on your main desktop you will see how much time you waste daily if its more then 90 minutes, you got it. Thats whats holding you back.
❌ 2. Reduce Social Activity
When I am in Monk mode, I say no to most social stuff for a short period of time. No parties, Bar meetings and Alcohol. Not even meeting for coffee. As Im father then family duties must stay. That is non negotiable. But outside of that, I shrink my interactions down to almost zero unless the meeting clearly helps my Monk mode goal.
Example
If I am focused on passing a prop challenge or backtesting some element I want to add to my strategy and someone invites me to a weekend full of drinking and late nights, it is a hard no.
If a trader that also trades same strategy invites me to a serious work session to review data or refine something, I will go. That supports the mission.
❌ 3. Cut porn and junk dopamine completely.
This is the uncomfortable part almost nobody wants to talk about, but it matters.If you are constantly stimulating yourself with porn and random adult content, your brain is fried with dopamine. Your focus span goes to zero. Your discipline collapses.
• No porn
• No “thirst trap” scrolling
• No mindless sexual content
• No dating apps
This should not be only for a monk mode. Porn is cancer for your focus cut it out from your life completely. After a few days without this junk, your energy levels change. You wake up more driven. You sit at the charts and you actually want to work. You start feeling like a hunter again, not a zombie.
❌ 4) Cancel Netflix and stop Watching news
Netflix is waste of time. Same is for the news. It doesn't matter knowing what orange mans says or how some sport results ended. You need to focus on your project
2️⃣ Lets put some Traction
✅ 1. One Project — Your Core Mission 🎯
This is your main quest, for traders, Monk Mode is powerful, because it removes decision fatigue.it could be:
• Backtesting 500+ trades of one model
• Building your strategy framework properly
• Creating your full trading plan
• Passing a prop challenge with discipline
• Fixing your routine and sticking to it
Rules:
• Choose ONE project / Mission
• Work on it daily
• Don’t switch
• Clear finish line
✅ 2. One book 📖
School didn’t prepare you for trading. You have to learn the parts nobody teaches:
• Mindset
• Psychology
• Discipline
• Focus
• Execution
• Stoicism
• Peak performance
30 minutes a day is enough.
Books give you depth. Unlike social media gives you shallow noise of social feeds. I suggest you Atomic Habits - from James clear if never read it. Also FLOW from Mihaly Csikszentmihalyi
✅ 3.One meditation - to reset your mind 🧘♂️
Monk mode without meditation is like a gym without weights. I keep it simple. Twenty minutes every day, but you can start with 10 minutes if you didn't meditate ever.
You can find some guided meditations on YouTube. But, dont let yourself catch in to a trap by scrolling and finding meditation. Prepare one in advance and put It to the playlist or just:
• Sit down
• Close your eyes
• Focus on your breath
• Let thoughts pass without judging or chasing them
Meditation help you regain control over your attention
✅ 4..One workout 💪
You can do either gym or calisthenic training. But not hard cardio, rather resistance training that builds strength. Instead of cardio you got walks. When Im in the monk mode I do Powerlifters training. Its simple, it increases your strength and I do not have to think about training complexity to much. I just come to the gym and finish my session in 45 minutes.
Measure you max weights and add 10%. Then start with 60% of the weight and add 5% every week. You can do more complex weight progression after 4 weeks but that would be for whole article. Search for Stefan Corte Powerlifting training. But dont overthink it. In Monk mode you want stupid repetitive routine.
Squats 6 x 6 - 60% - 65% - 70% - 75%
Bench 6 x 6 - 60% - 65% - 70% - 75%
Deadlift 6 x 6 - 60% - 65% - 70% - 75%
👉 Train hard 3 times a week - Mo / We / FR .. take a break on the weekends.
👉 Other 3 days focus on mobility training and stretching
👉 Take a break one day
Don't forget for 10 minutes warm
Do proper stretching after the training session.
✅ 5. Long walks (No phone , No music) 🚶♂️🌲
Long walks for clarity and aha moments. I go out for around 60 minutes, ideally in nature, with no phone and no music. Just walking, being present and thinking on my project
TIP - if you go for walk on the mornings and fasted, you body will take energy from fats.
As you are in the mode when focusing on project. Ideas begin to connect. You ll start seeing patterns, solutions, better rules. Many parts of my strategies, my routines, even my lifestyle changes were born on these walks.
✅ 6. Eat like an athlete, not a garbage bin 🥦
Food is another big lever. In Monk mode I prefer to work in a light, fasted state during the main focus hours. I have my first real meal after I finish my most important work for the day. Before that I of course drink water, but nothing that spikes blood sugar. Because when you are full, heavy and bloated, your brain slows down. That is the last thing you want when you need to do deep work.
Keep it simple
1. Protein
2. Good carbs
3. Healthy fats
4. Minimal junk
Obviously in normal life I sometimes eat in Mc Donald or have Popcorn when taking daughter to the cinema. But No pizza and chips, No such a things in Monk mode. You are trying to become sharp, not sleepy.
🎯 Thats all easy said but how to do it if I got 9 - 5 job?
Simple you need to adjust your schedule, when you remove Netflix, Social media and contacts you gain new time, but you will have to put it somewhere in a day. I highly suggest to make it on the morning because after work you will be tired and your focus will not be so sharp.
📅 Plan for people those who has 9 - 5 job Every days start with good sleep so go sleep early and always at the same time. If you start practicing walks without distracting you brain with phone, you will sleep better.
⏰ Wake at 4:00 win the morning
Always follow your morning routine - Meditation, Backtesting, Book, Workout
Do this every days even on weekends. Don't overtrain have 2 types of training heavy one and one lighter focused on mobility and stretching. These 4 hours is how you win the day. Before it even started.
Once you are back from job if you have kids you must give them your time. If you dont have kids do some more intentional work on Project - backtesting , analyzing the charts etc... But be careful with starting to hard burning yourself. 90 minutes a day on the project is maximum. No hard work in one day beats consistency of smaller daily consistent work. So dont overshoot the start.
📝 Then Journal your day, write down what you learned and selfreflect on progress in each parts of monk mode - Meditation, Project - Backtesting, Notes from book, Work out.
✍️ Make plan for the next day and go for walk without phone or music. You will see what happens on that walk. Then just come home have a shower and go sleep
🔁 Next day repeat. On the Saturdays and Sundays add one more bigger window for work on the project to summarize what did you learn during the week. Then you do some relax activities as sauna, massage, visit family members, spend time with kids, give more time to reading.
If you do this consistently for 3 months. You will see miracle happen, not only in your trading career but in your life will change go for 6 months and you will come back as different person.
Are you in to upgrade yourself for 2026 ? Let me know
David Perk
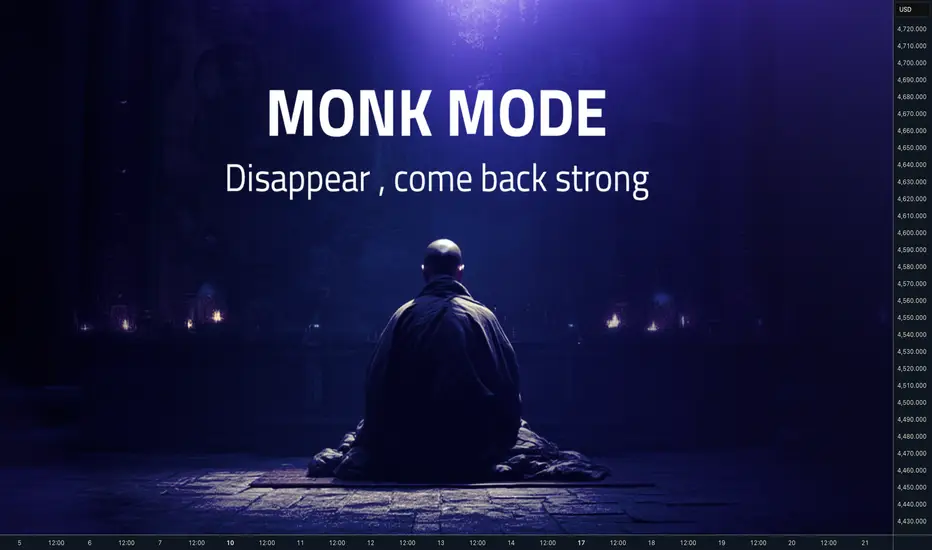
Advanced Supply and Demand (HORC Trend + SnD StructureAfter studying the charts for some time, I’ve realized that candlesticks are all we need to make money in the market. The question is: can you read the story of market participants — where they showed their hand and revealed their intentions before a break of structure or a change of character, creating imbalances as they seek balance?
A concept called HORC is what I follow. It’s an advanced supply-and-demand framework that incorporates knowledge of participant behavior. In this series I will share what I’m looking at and my intentions.
Warning
Nothing shared here is financial advice; I am not an expert. I am still learning and figuring this out.
The Truth About Timeframe Analysis (No One Wants to Tell You)*You’re not confused because the market is chaotic.
You’re confused because your framework is garbage.*
🔥 Timeframes Don’t Lie — But Traders Do
Let’s be real:
You jump between timeframes looking for “confirmation,”
but all you’re really doing is collecting excuses.
1H looks bullish
15M looks like a breakout
4H is pulling back
5M is breaking structure in the opposite direction
Now you have five different opinions in your head
and exactly zero conviction.
You hesitate.
You enter late.
You get trapped.
You flip bias like a rookie.
This isn’t “market randomness.”
It’s simply a lack of hierarchy.
⚡ The Market Isn’t Messy. YOUR PROCESS Is Messy.
Every timeframe gives you a “mini truth.”
Without structure, you mix them together into something that feels like analysis…
but is actually noise dressed as logic.
That’s why you keep:
❌ trading micro signals against macro structure
❌ believing every candle is a reversal
❌ ignoring invalidations because you “like the setup”
❌ frying your brain before you’ve even risked a dollar
You don’t need another indicator.
You need a logic system that crushes noise and exposes REAL probabilities.
🔥 The 3 Variables (The Part Traders Think They Understand… But Don’t)
Most traders “kind of” know what trend, zones, and candles are.
And “kind of” is exactly why they lose.
In this model, each variable has a precise definition, variations, and probability weights that change depending on the context.
You’re not reacting emotionally — you’re measuring.
That’s what makes the system mechanical.
1️⃣ Trend — The Market’s Actual Intent (Not Your Guess)
Definition:
The structural direction defined by higher timeframes — not the last 3 candles on 5M.
Variations:
Strong trend
Weak/aging trend
Neutral compression
Context impact:
A strong trend entering a strong zone with a confirming candle = high probability.
A tired trend hitting a counter zone = danger.
👉 Trend isn’t “up or down.”
It’s how mature and healthy that direction is.
2️⃣ Zone — Where the Real Decisions Are Made
Definition:
Price areas that actually matter: supply, demand, break/retests, major SR.
Variations:
Fresh zone (strongest)
Retested zone (usable)
Overused zone (dead)
Context impact:
Zones inside dominant trend → continuation setups
Zones against dominant trend → only valid with strong multi-timeframe alignment
Zones broken on mid-timeframes → bias must be re-evaluated
👉 Zones aren’t lines.
They’re probability clusters.
3️⃣ Candle — The Signal That Confirms… or Invalidates Everything
Definition:
The micro-expression of intent: rejection, displacement, absorption, continuation.
Variations:
Rejection wick
Displacement/imbalance
Compression
Fake strength traps
Context impact:
A “strong candle” in a weak zone means NOTHING.
A clean rejection + structure shift inside a strong zone + aligned trend = top-tier entry.
👉 Candles are not signals by themselves.
They’re filters.
💥 The Edge Isn’t the Variables — It’s Their Alignment
Anyone can draw zones and identify candles.
Losing traders do it every day.
The real edge comes from understanding:
how each variable shifts with context
how its probability weight changes
how alignment creates high-probability setups
how misalignment warns you to STOP IMMEDIATELY
Once each variable has a precise meaning
and precise behavior inside each context…
The system becomes mechanical.
No more emotional gambling.
No more “I think this is a reversal.”
No more overthinking.
Just one rule:
If the variables align → execute.
If they don’t → wait.
📶 The Only Timeframe Hierarchy That Makes Sense
📌 High Timeframes (4H / 1H)
→ Define true market bias
→ Only overridden by strong opposite confluence
📌 Mid Timeframes (30M / 15M)
→ Confirm or challenge the bias
→ Can create valid setups if rules align
📌 Entry Timeframes (10M / 5M / 2M)
→ Execution only
→ No bias allowed here
This structure kills FOMO, kills hesitation, and kills the “I changed my mind” syndrome.
🚀 The Two Setups That Actually Pay
1️⃣ Precision Setups (Low-Risk / High-Accuracy)
1:1 to 1:2
Clean, frequent, reliable.
2️⃣ Momentum Setups (When Everything Aligns)
1:3+
Rare — but violent and highly profitable.
If you’ve ever seen the market move exactly as you forecasted…
That was confluence.
You just didn’t know how to replicate it.
💀 Stop Trading Noise. Start Trading Probability.
This model does NOT eliminate all losses.
It eliminates the avoidable, stupid ones caused by emotional reactions and inconsistent bias.
Give me 10 trades executed under true confluence,
and the results explain everything.
📣 Want Chapter 2?
I’ll break down the full confluence model and the exact rules that make it repeatable.
Follow me here on TradingView,
save this idea,
and comment “CH2” if you want the next release.
More coming soon —
but only for the people actually paying attention.
This is a very tough market/ a look at gold and silver and dxyOctober 19th I'm sure most people listening to this are also listening to their favorite show that helps them make a decision about the markets and the more services you start to look at the more confused you will be. Personally I'm spending very little time looking at the market but I try to take a quick glance of it either at the middle or beginning of the current day and then I can determine whether the market looks interesting or not. However the pattern on Bitcoin which I do not trade is the setup I would be looking for the markets that I would be looking to trade. Bitcoin is taking a little bit of a drawdown and there's a lot of information out there saying that Bitcoin is in trouble.... Probably from people who trade gold and silver///so you have to be careful of other people's biases.... But it will probably be tradable tomorrow on Bitcoin defined a reversal pattern going higher.... And you should be able to take a trade with a very small stop but you want to let the market come to you if you don't see a 2 bar reversal indicating that Bitcoin is going to go higher you can't take the trade.

The market isn’t random. It’s driven by algorithms.The market is not arbitrary. It is powered by algorithms that essentially accomplish just two tasks:
either push the price in the direction of the next liquidity pool or pull it back to fill the orders they missed en route, such as leftover blocks, imbalances, and unfulfilled orders.
Understanding that basic behavior is the foundation of everything I trade.
Since it indicates where the algorithm is attempting to go next, I begin with the higher-timeframe trend.
Then, in order to determine which side is in control, I wait for a powerful push, a distinct, quick displacement.
The algorithm nearly always retraces slowly after that push because it must return to correct imbalances and complete the orders it overlooked.
Additionally, that gradual decline indicates that the trend is still going strong.
A quick or forceful pullback indicates that the algorithm is probably changing course because it is creating new imbalances rather than going back to correct the previous ones.
I therefore only accept trades when the price gradually returns to my order blocks, imbalances, or prior liquidity areas before moving on to the next pool of liquidity.
I don't forecast highs or lows.
I do not oppose the market.
All I'm doing is following the algorithm as it shifts from one liquidity pool to the next, making any necessary corrections before moving on.
Continuing Triangle PatternHello friends
we are here with a simple strategy tutorial that is a model, but it also requires practice.
Well, whenever we have a structure, whether it is bullish or bearish, it doesn't matter. Now in this example, our structure is bearish and you can see how sharp the spikes that the sellers make are and at one point the price compresses and forms a triangle. Here, considering the bearish structure we have and the strength of the sellers that you see, we expect a decline if the triangle breaks.
Which is the continuation of our downward trend or structure, which we call a continuation triangle, meaning the price continues its previous structure.
The way to trade it is also simple. Just wait for a strong break of the triangle, and when the break is valid and the bottom of the triangle closes, we can enter with a stop loss above the ceiling and a target equal to the previous drop of the triangle, which is the trend move.
Be sure to follow risk and capital management.
*Trade safely with us*
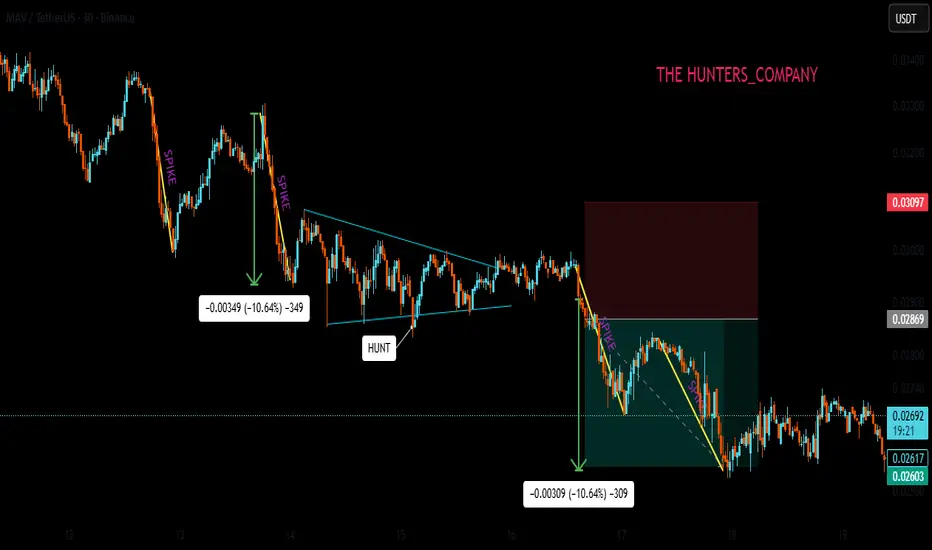
Haunt training levelsHello friends
We are back with another tutorial.
This time we are going to tell you a more advanced strategy.
Well, when a trend or structure forms, it doesn't matter whether it's bullish or bearish. In our example, it's an bullish structure. You should be careful that every structure eventually ends, and this ending has a series of signs. In this strategy, we'll teach you what those signs are and how to enter a trade and make a profit.
Well, as you can see, the buyers raised the price, and considering the higher ceilings and floors, we can tell that our structure is bullish and the buyers' hand is strong...
Here we are waiting for buyers to weaken, which is the important moment when, after hitting a ceiling, sellers push the price down, and you think that the structure has changed and enter a sell trade, placing your stop loss above the spike and waiting for the structure to change.
This is where the buyers come in and make their final move, hunting the previous high and your stop loss is triggered.
What to do now?
So, as we said, when you see the weakness of the structure, draw a resistance level like the level we have specified for you.
Now the price is falling from the ceiling and we are just waiting and when the price reaches the level again and cannot stabilize above our level and does not have the strength, so to speak, our level is hunted and the price falls, we do not expect to be able to enter the trade right there Because we need more confirmations.
So the price comes back and reaches our level, which we call a pullback. At this point, we must be very careful that the price weakens before our level or weakens at the level and cannot stabilize higher prices. This is where we enter the trade and our stop loss is placed exactly behind the hunted ceiling.
The target can also be the first price bottom and then, if the sellers are strong, lower bottoms...
Be careful that the win rate of this strategy is 70.
Be sure to observe risk and capital management.
*Trade safely with us*

Structure trainingHello friends
Well, you see that a spike has been made by the sellers and a bearish structure has formed.
So, be careful that after each spike, the price needs to take a break, so it either suffers or pullbacks, spikes again, and continues.
Now the question is, how do we know when our downtrend is over?
You need to be careful and wait for the weakness of sellers and the strength of buyers, the important signs of which I will tell you.
The first sign is the last spike, which requires our bottom to be broken by sharp sellers and the price to be reversed by sharp buyers. Here it is important that we set a higher ceiling and break this spike formed by sellers, which is also called CHOCH in a correction, which means the same change in structure.
Our second sign is the lower lows, which is also very important and of great importance because it shows the advantage of buyers and helps a lot.
And in the price pullback we can enter the trade with risk and capital management.
Our stop loss is placed below the last low or the last spike that you said and the target is double that R/R=2
*The win rate of this strategy is also 60*
*Trade safely with us*

Why Liquidity Is the Real King of Crypto ?🧨 The $1.1 Trillion Lesson: Why Liquidity Is the Real King of Crypto 🧨
A deep dive into how macro headlines and liquidity shifts shape every chart you trade.
Hello Traders 🐺
In this idea, I want to take you on a journey through one of the most brutal and eye-opening moments in crypto history — a $1.1 trillion wipeout in just 42 days.
But this isn’t just about the numbers. It’s about the lesson behind the crash.
Because if you truly understand what caused this — you’ll unlock a superpower most traders never develop:
Reading liquidity like a pro.
So stick with me till the end — because this is more than a chart.
It’s a masterclass in macro awareness.
And it all comes down to one brutal truth:
📈 The Setup: Euphoria at $4.3 Trillion
It was October 2025.
Crypto was booming.
Altcoins were flying.
Influencers were screaming “new ATHs.”
And the total market cap hit a jaw-dropping $4.3 trillion.
Everyone thought the bull run had no brakes.
But then came the headline that changed everything...
🗞️ The Shock: “TRUMP ANNOUNCES 100% TARIFF ON CHINA”
This wasn’t just politics.
It was a liquidity shock.
Global markets flinched.
Risk assets trembled.
And crypto?
It got hit harder than anyone expected.
Why?
Because tariffs = tension = uncertainty = capital flight.
And when capital flees, liquidity dries up.
And when liquidity dries up…
💥 The Fallout: Largest Liquidation Event in Crypto History
Billions wiped in hours.
Leverage nuked.
Altcoins collapsed.
And the total market cap began its brutal descent — erasing over $1.1 trillion in just 42 days.
Let that sink in.
$1.1 trillion.
Gone.
Not because of a chart pattern.
Not because of RSI.
Not because of your favorite altcoin’s roadmap.
But because of liquidity.
📢 The Bounce: “America Will Be #1 in Crypto”
A bold statement from Trump gave the market a short-lived bounce.
But sentiment was already broken.
And without real liquidity support, the bounce was just a trap.
A classic dead-cat.
Because words don’t move markets — money does.
📉 The Aftermath: Crypto Erases $1.1T
From peak to trough, the market bled.
And here’s the lesson:
It wasn’t technicals.
It wasn’t fundamentals.
It was macro.
It was policy.
It was liquidity.
💡 What Can We Learn From This?
✅ Macro headlines move markets faster than any chart pattern
✅ Political shocks = volatility spikes
✅ Liquidity is king — and when it dries up, even the strongest coins fall
✅ Your edge as a trader is not just in TA — it’s in understanding the invisible forces behind price
🎯 Why This Post Matters
This isn’t just a recap.
It’s a wake-up call.
Because most traders are blind to macro.
They chase candles.
They follow influencers.
But they ignore the one thing that truly drives the market:
Liquidity.
If you understand this — you stop reacting.
You start anticipating.
You stop getting liquidated.
You start positioning early.
That’s why this post matters.
Because it teaches you the $1.1 trillion lesson —
A lesson paid for by millions of traders who didn’t see it coming.
🐺 Final Words
If you found this helpful, follow for more deep dives.
Because the next trillion-dollar move might already be loading…
And when it hits, you’ll want to be on the right side of liquidity.
🐺 Discipline is rarely enjoyable, but almost always profitable 🐺
🐺 KIU_COIN 🐺
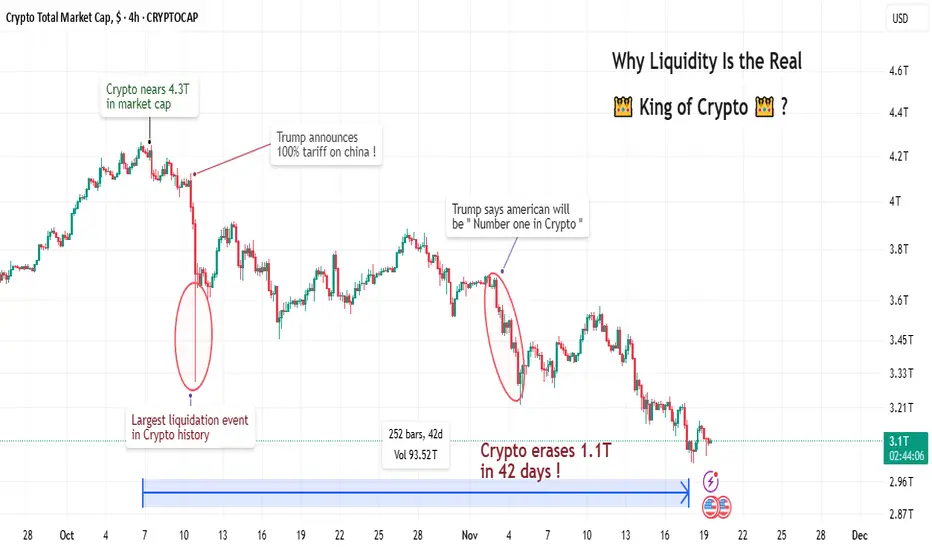
Best Free Fair Value Gap FVG Technical Indicator on TradingView
This free indicator accurately identifies Fair Value Gaps FVG on any market.
It is available on TradingView and it is very easy to set it up.
In this article, I will show you how to use this indicator and how to find a fair value gap easy in one click.
Let's start with my definition of a fair value gap because it is different from trader to trader.
FVG is a sudden, sharp price move that happens so fast that it leaves behind a price zone where very little trading actually occurred.
Because this zone saw almost no trading, it creates an imbalance .
Such a move is usually created by a large candle.
A candle with a big body and almost no wicks.
Among classic Japanese candlesticks, there is one such a candle.
It is called Marubozu.
Here are bullish and bearish structures of that candle.
A green one represents extremely strong bullish momentum. The price opened at the low of the period and closed at the high of the period. There were no pullbacks ; buyers were in complete control from the opening bell to the close.
Its bearish variation has the same logic.
The price opened at the high of the period and closed at the low of the period, with a very little trading activity within.
Our technical indicator will look for such a candle.
The indicator that we will use is called "All Candlestick Patterns".
In the settings of this indicator, we should select Marubozu White (bullish candle) and Marubozu Black (bearish candle).
After we click "OK", the indicator will immediately start working.
The indicator will show valid and significant Fair Value Gaps FVG on any time frame and any trading instrument.
Like any other indicator, it will miss some Fair Value Gaps, but while you are learning to identify them, it will help you to spot the most important ones.
❤️Please, support my work with like, thank you!❤️
I am part of Trade Nation's Influencer program and receive a monthly fee for using their TradingView charts in my analysis.
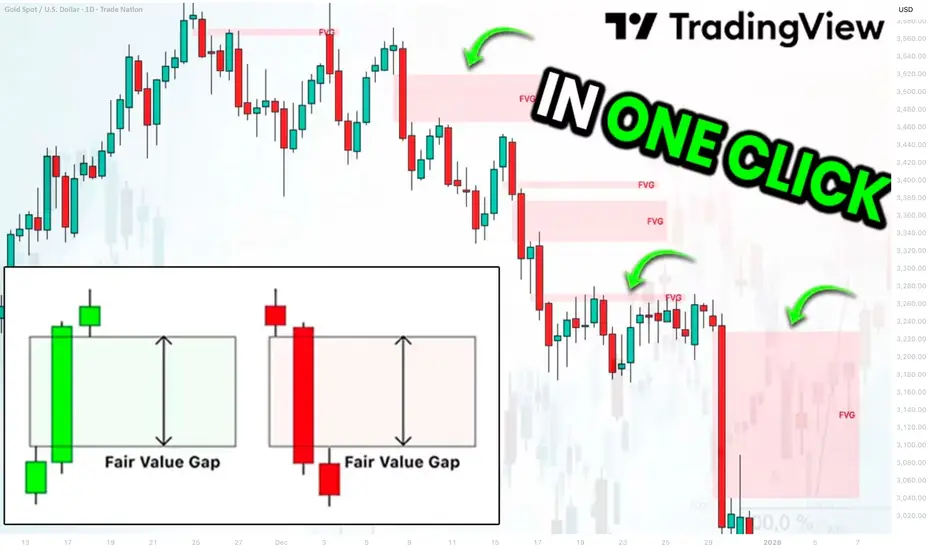
Do You Know Bitcoin and Nasdaq Have a 92% Correlation?* Most traders still believe Bitcoin and the Nasdaq 100 belong to two different worlds — one is “digital currency,” the other is “US tech stocks.”
- But in reality, Bitcoin and Nasdaq have nearly 92% positive correlation (based on past +10 years data).
The current market movements are showing signs of a market crash on the way...........
- See for arounf past 10 years, Bitcoin stayed above the tech index.
- It was the month of Nov only in 2015, when Bitcoin crossed above Nasdaq on the chart
After 10 straight years - Its 2025 & the month of November itself
- And Bitcoin has slipped below Nasdaq, forming its first bearish crossover in a decade.
This is a major shift.
- When a long-term leader loses momentum, it often signals deeper structural weakness — not only for Bitcoin, but for the entire risk-on ecosystem.
- Remember, Nasdaq & Bitcoin has over a 92% correlation
- And US tech industry is brewing a bubble somewhere - where the epicenter lies in the AI sector
A crash in one will sink the other with it
Checkout the chart (Nasdaq Futures & Bitcoin Weekly)

The Support Zone That Refused To Be IgnoredSome chart zones whisper. This one practically waved its arms.
Price slid right into a hefty support area on the higher timeframe… and suddenly started behaving like it had forgotten how to move lower. Classic clue.
Zoom in, and the daily chart shows price squeezing itself into a falling wedge — the market’s equivalent of someone pacing in a hallway, unsure whether to sit down or sprint. Sellers kept trying to push prices lower, but each attempt had less conviction than the last.
When you stack those two pieces together — a big support zone from the monthly chart and a daily pattern running out of room — things start to get interesting. Not predictive, just… interesting.
A breakout above the wedge (around 0.0065030) would basically say, “Alright, I’m done compressing.”
A stop tucked below the lower support range (roughly 0.0063330) keeps the scenario clean.
And a structural projection toward 0.0067695 gives the idea a tidy endpoint if momentum decides to stretch its legs.
Of course, leverage cuts both ways, and traders working with the standard or micro contracts often choose size based on how much room they want between entry and invalidation. When traders choose between the standard and micro versions of this market, it usually comes down to scale. The bigger contract represents 12,500,000 units of the underlying with a $6.25 tick, while the micro mirrors the behavior at 1,250,000 units with a $1.25 tick. Estimated margins also differ — roughly $2,800 for the larger contract and about $280 for the micro. Same chart logic, just two very different footprints on the account.
The real takeaway? When a major zone teams up with a compression pattern, it’s usually worth paying attention. Maybe it leads to a beautiful breakout. Maybe it fizzles. But structurally, this is one of those “save the screenshot” moments.
And whatever the outcome, risk management keeps the whole thing sensible — size smartly, define failure points, and let the chart prove itself instead of assuming it will.
Want More Depth?
If you’d like to go deeper into the building blocks of trading, check out our From Mystery to Mastery trilogy, three cornerstone articles that complement this one:
🔗 From Mystery to Mastery: Trading Essentials
🔗 From Mystery to Mastery: Futures Explained
🔗 From Mystery to Mastery: Options Explained
When charting futures, the data provided could be delayed. Traders working with the ticker symbols discussed in this idea may prefer to use CME Group real-time data plan on TradingView: www.tradingview.com - This consideration is particularly important for shorter-term traders, whereas it may be less critical for those focused on longer-term trading strategies.
General Disclaimer:
The trade ideas presented herein are solely for illustrative purposes forming a part of a case study intended to demonstrate key principles in risk management within the context of the specific market scenarios discussed. These ideas are not to be interpreted as investment recommendations or financial advice. They do not endorse or promote any specific trading strategies, financial products, or services. The information provided is based on data believed to be reliable; however, its accuracy or completeness cannot be guaranteed. Trading in financial markets involves risks, including the potential loss of principal. Each individual should conduct their own research and consult with professional financial advisors before making any investment decisions. The author or publisher of this content bears no responsibility for any actions taken based on the information provided or for any resultant financial or other losses.
