Understanding Global Event Risks1. Defining Global Event Risks
Global event risks refer to sudden or prolonged events that significantly affect global systems — from trade and finance to security and natural resources. These events are often unpredictable in timing but can have measurable impacts once they occur.
Examples include:
Geopolitical tensions such as wars, border disputes, or terrorism.
Economic crises like financial meltdowns, debt defaults, or currency collapses.
Pandemics such as COVID-19, which disrupted global supply chains and labor markets.
Natural disasters including earthquakes, tsunamis, or climate-driven catastrophes.
Technological disruptions, such as cyberattacks or digital infrastructure failures.
The key characteristic of global event risks is their interconnected impact — what begins as a localized issue can quickly become a global concern.
2. Classification of Global Event Risks
Global event risks can be broadly classified into several categories:
a. Political and Geopolitical Risks
These involve government actions, regime changes, conflicts, or diplomatic breakdowns that affect trade routes, investment flows, and international alliances.
Examples:
Russia-Ukraine war and its impact on global energy prices.
US-China trade tensions affecting technology supply chains.
Middle East conflicts influencing oil markets.
b. Economic and Financial Risks
These include global recessions, inflationary shocks, debt crises, and stock market collapses.
Examples:
The 2008 Global Financial Crisis.
The European Sovereign Debt Crisis.
Inflation surges after the COVID-19 pandemic due to disrupted supply chains.
c. Environmental and Climate Risks
Climate change has become a persistent global threat. Rising sea levels, floods, droughts, and wildfires can devastate infrastructure and food systems.
Examples:
The 2023 heatwaves in Europe and Asia affecting energy demand.
Flooding in Pakistan (2022) disrupting agriculture and industry.
d. Technological and Cyber Risks
The increasing digitalization of global systems brings vulnerabilities to cyberattacks, data theft, and digital espionage.
Examples:
Cyberattacks on critical infrastructure or financial systems.
Disruptions in semiconductor supply chains.
AI-driven misinformation campaigns influencing markets and politics.
e. Health and Pandemic Risks
Global health emergencies can halt production, trade, and travel.
Example:
The COVID-19 pandemic, which caused the biggest global economic contraction since World War II.
f. Social and Humanitarian Risks
Mass migrations, social unrest, and inequality can destabilize societies and economies.
Examples:
Refugee crises due to conflicts or climate disasters.
Civil protests affecting industrial output or governance.
3. The Interconnected Nature of Global Risks
In today’s globalized economy, risks rarely exist in isolation. Political instability may trigger economic sanctions; economic downturns can lead to social unrest; and environmental disasters can fuel migration crises.
For instance:
The war in Ukraine not only created a geopolitical crisis, but also an energy shock, food shortage, and inflationary wave across Europe and Asia.
A cyberattack on a financial institution could lead to market panic, liquidity shortages, and regulatory crackdowns.
This web of interdependence means that risk management today must take a systemic approach — considering how one event can cascade into others.
4. Measuring and Analyzing Global Event Risks
Understanding risk requires both quantitative and qualitative assessment. Analysts use several tools and indicators to measure the probability and potential impact of global events:
a. Economic Indicators
GDP growth rates, inflation, and employment levels help identify potential downturns.
Bond spreads and currency volatility signal financial stress or geopolitical uncertainty.
b. Geopolitical Analysis
Political stability indexes, sanctions data, and defense expenditures give clues to upcoming conflicts or policy shifts.
c. Climate and Environmental Data
Monitoring global temperature anomalies, carbon emissions, and disaster frequency helps assess long-term environmental risks.
d. Cybersecurity Reports
Institutions like Interpol, Europol, and private cybersecurity firms track attack trends and vulnerabilities.
e. Scenario Planning
Organizations simulate various “what-if” scenarios — for example, a war in a major oil-producing region or a cyberattack on banking systems — to test their preparedness.
f. Global Risk Reports
The World Economic Forum (WEF) and IMF publish annual risk reports that rank threats by likelihood and impact. These reports help governments and investors prioritize their strategies.
5. Impact of Global Event Risks on the Economy and Markets
Global events influence nearly every aspect of economic life:
a. Trade Disruptions
Wars, sanctions, or pandemics can disrupt shipping lanes and supply chains. Businesses face shortages, higher costs, and delays.
b. Financial Market Volatility
Investors often react quickly to uncertainty. Stock markets may fall, currencies fluctuate, and bond yields shift. Safe-haven assets like gold and the US dollar typically rise.
c. Inflation and Commodity Prices
Energy and food prices often surge during crises, as seen in the post-Ukraine war inflation spike.
d. Corporate Strategy and Investment
Companies may delay expansions, diversify suppliers, or relocate operations to manage risk exposure.
e. Policy Responses
Governments and central banks intervene through stimulus packages, interest rate changes, or fiscal reforms to stabilize markets.
f. Social and Labor Impacts
Job losses, wage pressures, and reduced consumer confidence can follow prolonged global shocks.
6. Case Studies of Major Global Event Risks
a. The 2008 Financial Crisis
Triggered by the collapse of the US housing bubble, it spread globally due to interconnected banking systems. The crisis led to mass unemployment, austerity policies, and long-term shifts in regulation.
b. The COVID-19 Pandemic
Lockdowns halted travel, production, and trade. Governments injected trillions in stimulus, but inflation and debt burdens grew. The event redefined global health governance and digital transformation.
c. Russia-Ukraine Conflict (2022-Present)
The invasion disrupted global energy markets, food supply chains, and international alliances. Sanctions on Russia reshaped trade flows, pushing countries toward alternative energy sources and defense spending.
d. Climate-Driven Events
Extreme weather in the 2020s has affected agricultural yields, insurance costs, and migration patterns. These long-term risks now feature prominently in global financial planning.
7. The Role of Global Institutions in Managing Risks
a. International Monetary Fund (IMF) and World Bank
They provide financial aid and policy guidance during crises to prevent economic contagion.
b. World Health Organization (WHO)
Coordinates global responses to pandemics, sets health guidelines, and assists vulnerable nations.
c. World Trade Organization (WTO)
Mediates trade disputes and ensures smoother recovery from disruptions.
d. United Nations (UN)
Addresses humanitarian, environmental, and peacekeeping challenges, aiming to stabilize conflict regions.
e. Central Banks and Regional Alliances
The U.S. Federal Reserve, European Central Bank, and others coordinate monetary policies to manage inflation and liquidity crises.
f. Private Sector and NGOs
Corporations and non-profits contribute through innovation, sustainability projects, and disaster relief efforts.
8. Managing and Mitigating Global Event Risks
Risk management is not about eliminating uncertainty but about building resilience. Key strategies include:
a. Diversification
Businesses spread their operations and supply chains across multiple regions to avoid dependence on one market or source.
b. Hedging and Financial Instruments
Investors use options, futures, and insurance contracts to protect against market volatility or commodity price swings.
c. Scenario Planning and Stress Testing
Banks and corporations conduct regular simulations to test their ability to survive shocks like currency crashes or cyberattacks.
d. Geopolitical Intelligence
Firms increasingly invest in geopolitical advisory services to anticipate policy changes and security risks.
e. Sustainable and Green Policies
Adopting eco-friendly practices reduces exposure to regulatory penalties and environmental disruptions.
f. Technological Preparedness
Cyber resilience, data encryption, and backup systems help guard against digital threats.
g. Crisis Communication and Coordination
Transparent communication between governments, corporations, and the public ensures faster response and recovery during global events.
9. Future Trends in Global Event Risks
The risk landscape is evolving rapidly. Some future trends include:
a. Technological Warfare and AI Risks
AI-driven misinformation, autonomous weapons, and data manipulation could redefine future conflicts.
b. Climate Migration
Rising sea levels and droughts may push millions to migrate, creating social and political strains.
c. Supply Chain Re-Localization
Nations are reshoring production to reduce dependency on foreign suppliers, creating new trade dynamics.
d. Digital Currency and Financial Stability
Central Bank Digital Currencies (CBDCs) may alter the global payment system but also bring cybersecurity challenges.
e. Energy Transition Risks
As economies shift from fossil fuels to renewables, transitional disruptions in energy prices and jobs will occur.
f. Multipolar World Order
Power is shifting from Western dominance to a multipolar setup with China, India, and regional blocs gaining influence. This could lead to both cooperation and competition.
10. The Importance of Awareness and Adaptability
Understanding global event risks requires not just analysis but agility — the ability to adapt policies and strategies as new challenges arise. The modern era rewards entities that are proactive, data-driven, and globally aware.
Governments must design flexible policies for energy, health, and trade.
Businesses must incorporate risk intelligence into decision-making.
Investors must diversify and remain vigilant for cross-market signals.
Citizens must stay informed, as global shocks increasingly affect local economies and daily life.
Conclusion
Global event risks are a defining feature of the 21st-century world. They remind us that our economies, technologies, and societies are deeply interconnected. From financial meltdowns to pandemics, from cyberattacks to climate disasters, each event tests the resilience of global systems.
The key to navigating these challenges lies in understanding interconnections, building preparedness, and fostering international cooperation. In an era where uncertainty is constant, risk awareness becomes not a luxury but a necessity — shaping the policies, strategies, and innovations that safeguard global stability and progress.
Community ideas
How to Set a Stop Loss in Price Action Trading Forex Explained
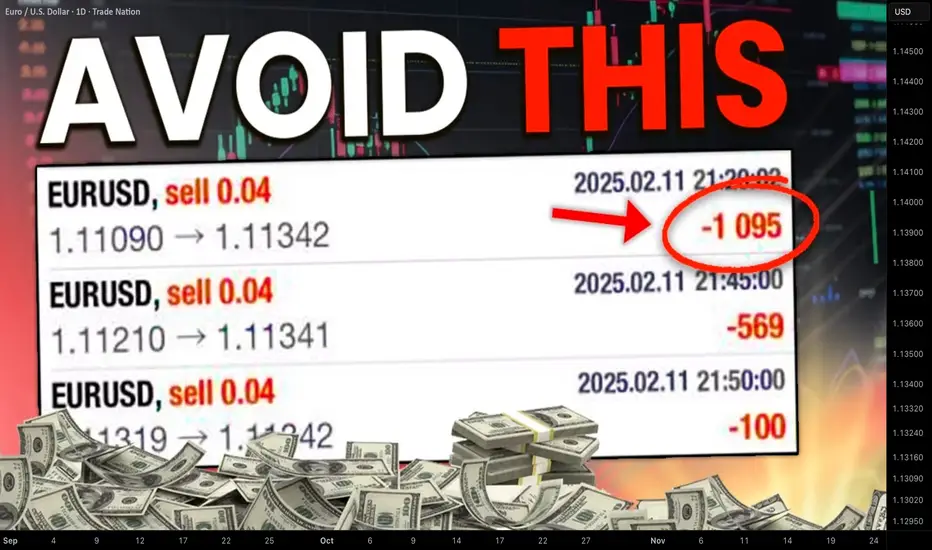
Wrong stop loss is one of the main reasons why newbie traders lose money.
I will share with you a proven stop loss strategy for price action trading Forex.
I will explain how to identify a safe stop loss level for any chart part, trend line and a breakout that you trade.
Learn how to set a safe stop loss easily on any time frame and no matter whether you are day trading, scalping or swing trading.
To correctly put a stop loss for trading price action in forex market, first, let's discuss 2 major types of price action patterns that you should know.
Trend line based patterns
The first type of patterns is called trend line based patterns.
In this category, we put all the patterns where trend lines are used as entries or confirmations.
Here is the list of these patterns:
Rising/falling parallel channels,
Rising/falling wedges,
Rising/falling expanding wedges/channels.
For example, in a rising parallel channel, its support is a strong vertical structure. It provides a safe place to buy the market from.
Alternatively, its breakout will provide a strong confirmation to sell.
Horizontal neckline based patterns
The second type of patterns is called neckline based patterns.
In this category, we include all chart patterns that lie on a horizontal neckline.
A signal that we rely on to trade these patterns is a breakout of their necklines.
Here is the list of these patterns:
Double top/bottom,
Head and shoulders and inverted one,
Ascending/descending triangle,
Cup and handle and inverted one.
Here is how we set a stop loss in trend line based patterns.
If we buy the market from a support line of a wedge or a channel, expecting a growth, we will need to the last bearish movement from the high of the pattern to the point where it touches a support line - our entry.
Our safe stop loss will be 1.272 fibonacci extension (from its high to low) of this movement.
If we sell the market after a breakout of a support line of a wedge or a channel, we will take the last bearish movement from the high of the pattern to the low of a breakout candle.
Our safe stop loss will be 1.272 fibonacci extension (from its low to high) of this movement.
Look how it works in practice:
If we sell the market from a resistance line of a wedge or a channel,
we will take the last bullish movement from the low of the pattern to the point where it touched a resistance line.
Our safe stop loss will be 1.272 fibonacii extension (from its low to high) of this movement.
Look how it works in practice:
Here is a safe stop loss for selling USDJPY forex pair from a resistance of a falling wedge.
If we buy a bullish breakout of a resistance line of a wedge or a channel, we will take a bullish movement from the low of the pattern to a high of the breakout candle.
Our safe stop loss will be 1.272 fibonacci extension (from its high to its low) of this movement.
Here is how easily we can set a stop loss, using this strategy, buying a breakout of a resistance line of a falling channel on NZDUSD forex pair.
And here is how we set stop loss for neckline based patterns.
If we see a breakout of a neckline of a bearish pattern, and we want to sell, we will need to find a pattern range: a low of the neckline of the pattern and highest high of the pattern.
Based on that, we will draw fibonacci extension (from its lows to high).
Our safe stop loss will be 1.272 extension.
That is how we put a stop loss, using this method on EURUSD, trading head & shoulders.
If we buy a breakout of a neckline of a bullish pattern, our safe stop loss will be based on 1.272 extention (from high to low) of the range of the pattern - the highest high of the neckline and the lowest low of the pattern.
That is how a safe stop loss for a cup & handle pattern on EURUSD looks. I drew fib.extension from the neckline's high to pattern's low.
This simple method will help you to always put a safe stop loss.
Integrate that in your trading plan and avoid losses, trading price action.
❤️Please, support my work with like, thank you!❤️
I am part of Trade Nation's Influencer program and receive a monthly fee for using their TradingView charts in my analysis.
Why Win Rate Lies: The Metric That Keeps Traders BrokeWhy Win Rate Lies (and What to Measure Instead)
Everyone loves a high win rate. Every newbie dreams of having a 75%+ success rate.
But here’s the trap: your win rate only tells you how often you’re right, not how much you make when you are. Even worse, focusing on win rate puts you on the wrong path: trying to predict outcomes instead of focusing on what really matters: being profitable.
Let’s dissect this a bit.
As a quantitative trader, I know I can design hundreds of systems with a 75% win rate. It’s simple: take frequent, small profits and place wide stop losses. Voilà, your win rate looks great on paper.
The problem? Those small wins can’t save you when that one big loss hits. The math doesn’t forgive.
Building a truly profitable system is much harder, because you need to balance the trade-off between win rate and risk/reward. A system that wins often but loses big doesn’t have an edge, it just has good marketing. See the futility in chasing high win rates?
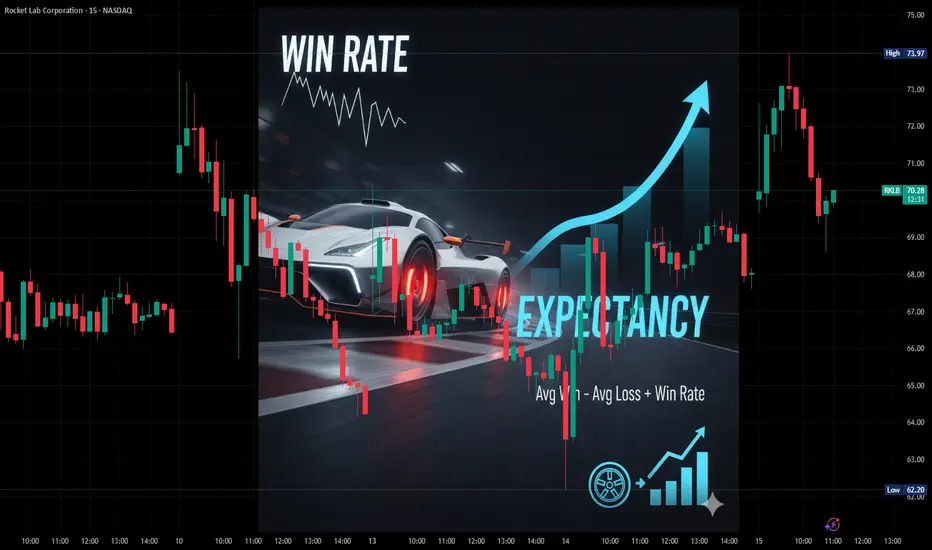
The real path is focusing on expectancy.
Expectancy not only accounts for win rate but also includes your average win and average loss, capturing the critical balance between how often you’re right and how much you gain or lose when you are.
Chasing a high win rate is like designing a race car and spending all your money on the engine. It’ll hit top speed on the straights (your wins), but without investing in decent brakes, you won’t look so great when the first corner arrives.
The Comeback Urge - When a Loss Feels PersonalNOTE – This is a post on mindset and emotion. It is not a trade idea or strategy designed to make you money. My intention is to help you preserve your capital, focus, and composure so you can trade your own system with clarity and confidence.
We saw some very deep sell offs towards the end of last week.
Imagine this if you will.
You’ve just taken a loss.
This one is not catastrophic, but it stings.
You replay it in your head.
What you could’ve done differently.
Where you should’ve cut.
What you should’ve seen.
And before the dust even settles, there’s an urge .
To get back in.
To “come back strong.”
To show the market and yourself that you’ve still got it.
At first, it feels like determination.
But look closer.
That energy coursing through your body isn’t calm focus.
It’s agitation.
Your jaw tightens.
Your breath shortens.
Your shoulders inch forward toward the screen.
Your system has just taken a hit not just financially, but emotionally.
Your identity as a capable, disciplined trader feels threatened.
And the impulse to trade again isn’t about opportunity.
It’s about redemption.
You’re not trying to win the market back.
You’re trying to win yourself back.
What’s really happening:
After a loss, your mind scrambles to restore equilibrium.
It wants to prove you’re still competent, still in control.
But trading from that place rarely ends well
Because the next trade becomes about repairing ego, not executing process.
It’s subtle, but powerful:
You’re no longer trading the chart.
You’re trading your self-image .
How to shift it:
Pause.
Acknowledge the emotional hit - not with judgment, but awareness.
Let the nervous energy move through your system without acting on it.
Remind yourself: “This is biology, not skill decay.”
You haven’t lost your edge, you’ve just been knocked off-center.
When you can sit in that discomfort without needing to erase it
That’s when emotional maturity starts replacing emotional reactivity.
And that’s not just psychology - it’s edge .
Because trading well doesn’t just depend on your system. It depends on your state .
Ask yourself:
When I rush to make it back,
What part of me am I really trying to fix?
The moment you can see that the need to prove, to redeem, to make it right is coming from ‘make back’
You stop trading from the wound and start trading from awareness.
And that’s where consistent performance begins
If this resonated, please check out my post on FOMO. H'ere's the link:

Why I Didn’t Buy Gold in the Last Few WeeksI’ve been bullish on gold since the beginning of the year — expecting it to reach $3000, and in a very optimistic scenario, maybe even $3500. My previous posts are proof of that.
But I definitely wasn’t expecting $4000, and certainly not $4200, for one simple reason:
Some time ago, my crystal ball broke, and since then I’ve been trying to base my trades on technical analysis and what I’ve actually seen happen in the past — not on wishful thinking.
________________________________________
When Price Doesn’t Correct, But You Still Profit Selling
Ever since gold hit the $3700–$3800 zone, I’ve been expecting a correction.
It never came.
Even so, I still made money selling against the trend — something I usually avoid and definitely don’t recommend anyone to do.
But this post isn’t about my trades. It’s about why I didn’t buy gold in the last two or three weeks.
And the answer is right there — on the chart.
________________________________________
The Chart Tells the Truth
If you look closely, you’ll see yellow rectangles highlighting the sharp drops that happened during this period.
It’s easy to look at the chart after the fact and say:
“I should’ve bought there.”
But imagine you don’t see the right side of the chart.
You’re sitting in front of your screen, looking at the current price, trying to decide what to do.
And then — within minutes — gold drops 700-800 pips out of nowhere.
No signal. No alert on WhatsApp. No warning.
Where do you put your stop?
Do you trade without one?
Just because you know it will bounce?
And what if it doesn’t?
What if it drops another 1000 pips — the same way it just did — without even breathing?
That’s not trading. That’s hope disguised as confidence.
________________________________________
This Is an Exercise in Honesty
This is an exercise in honesty with yourself — not after you’ve seen the chart.
How many of you would’ve stayed in a position that’s -500 pips, just because you “know” it will turn around?
Even now, right after I finished recording the video, it dropped another 500+ pips like it was nothing.
I’ve explained this a thousand times:
1. If a trade is not there, it’s not there. Period.
I don’t force it. I don’t FOMO.
2. A trade must have a clear entry, stop, target — and most importantly, a reason.
“Gold is rising, can’t you see?” is not a reason. It’s FOMO.
________________________________________
If You Want to Be a Real Trader, Remember This
1. The market has two directions, even when it looks like it only has one.
2. In aggressive trends, even my cat becomes a great trader.
3. Every trade must have a clear reason. If it doesn’t, and you enter just because “it’s going up”, that’s FOMO — and we all saw what happened to crypto in 2021. People are still waiting for the mythical altcoin season, while some are still 70- 90% down on the bag
4. We’re all geniuses after seeing the chart: “should’ve bought there, closed there…”
5. The only real truth is in your equity — and mine is higher, even though I’ve been selling.
6. I can guarantee there are gold bulls reading this right now who lost money on long positions over the past month.
7. In the end, it all comes down to money management and timing.
________________________________________
Conclusion:
Trading isn’t about being bullish or bearish.
It’s about being disciplined, timing and money management; the rest is can-can, and "I told you so"
P.S. Once again, I’m looking to sell — and if it works out like my last five trades, that’s perfectly fine with me.
At the club, they don’t ask whether I paid for my champagne with profits from buying or selling gold. 🍾

From Confidence to Panic: The Real Story Behind TradesIn the crypto market, emotions are the true engine behind price movement . Traders often believe they’re analyzing charts, but in reality, they’re analyzing their own minds. This analysis explores the emotional path of a trade from excitement and confidence to fear, loss, and recovery.
Hello✌️
Spend 2 minutes ⏰ reading this educational material.
🎯 Analytical Insight on Bitcoin:
Bitcoin is approaching a key daily support which could set up a 9% rally toward 122500$. Traders should watch this level closely for a potential bounce. 📈🔍
Now , let's dive into the educationa l section,
🌱 The Beginning of Hope
Every trade starts with hope hope for profit, recovery, or financial freedom. At this point, a trader’s confidence is at its peak. They see confirmations everywhere and believe the market agrees with them. Each green candle strengthens their optimism, while small pullbacks seem harmless. Yet, beneath that confidence, greed begins to grow quietly.
⚡ The Turning Point
The market, however, always follows its own rhythm. One sudden drop or an unexpected move is enough to shake that confidence. The mind shifts from analysis to reaction. Logic fades, and emotion takes control. This is the moment fear begins — when patience disappears and decisions become impulsive. Most losses are born right here, not from bad charts but from emotional decisions.
🌀 The Emotional Cycle
Crypto is a mirror of human emotion.
Hope → Greed → Doubt → Fear → Despair → Hope again.
Professional traders accept this cycle instead of fighting it. Each crash wipes out the impatient, while the disciplined quietly prepare for the next rise. The real difference lies not in knowledge, but in emotional control.
🧩 The Path to Balance
Trading is the art of making decisions amid mental noise. The only real edge is emotional discipline. Once you recognize that emotions are part of the game, you stop being controlled by them. The most successful traders are not the ones who know more they’re the ones who react less.
🧰 Practical Tools to Read Market Emotions
TradingView offers several features that help you measure market sentiment and stay objective while trading.
1. Fear and Greed Index
This index shows the current level of fear or greed in the market. Low values indicate collective fear (often a buy signal), while high values suggest greed (potential risk). Adding it to your chart helps you understand crowd psychology in real time.
2. Volume Profile (Visible Range)
This tool highlights the price zones with the highest trading activity. These levels often represent emotional clusters points of decision, panic, or reversal.
3. RSI (Relative Strength Index)
RSI reveals whether the market is overbought or oversold. High readings reflect greed, while low ones expose fear. When paired with volume, it creates a clear emotional map of the market.
🔚Conclusion
The crypto market is built not just on charts, but on human emotions. If you can read those emotions on the chart, you can anticipate the rhythm of price itself. Your emotional balance is the one indicator no one else can see.
💬Golden Pieces of Advice for Traders
Predict your own reactions before predicting the market. Knowing how you respond to fear or greed saves more capital than any signal ever will.
No trade is worth your mental peace. The moment your thoughts get heavy, your strategy loses value.
Observe emotions don’t suppress them. Professionals feel everything, but they act on logic, not impulse. That’s the true difference between survival and failure.
✨ Need a little love!
We pour love into every post your support keeps us inspired! 💛 Don’t be shy, we’d love to hear from you on comments. Big thanks, Mad Whale 🐋
📜Please make sure to do your own research before investing, and review the disclaimer provided at the end of each post.

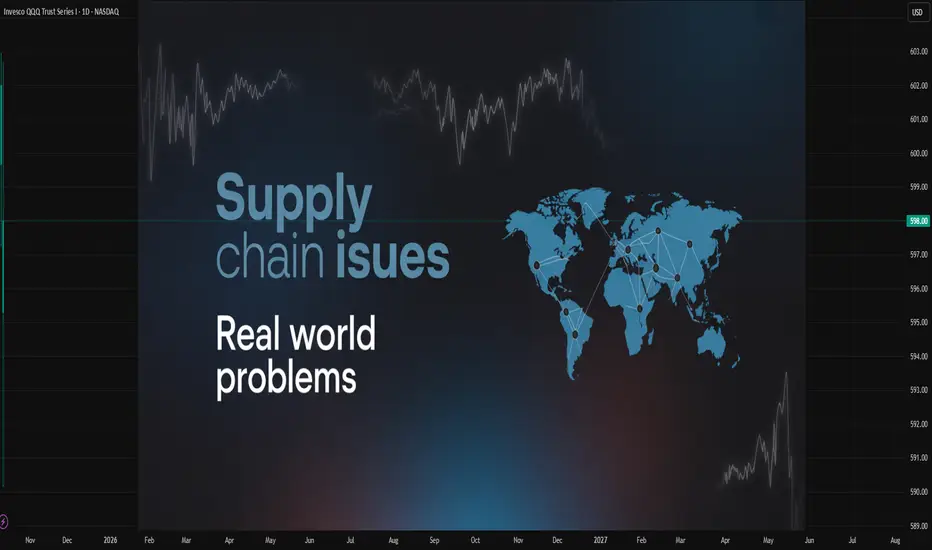
Impact of Geopolitical Tensions on Supply Chains1. Introduction to Geopolitical Tensions and Supply Chains
Geopolitical tensions refer to conflicts, disputes, or strained relations between countries, often involving political, economic, or military dimensions. These tensions can disrupt international trade and global supply chains, which rely on the smooth movement of goods, services, and information across borders. Supply chains are interconnected networks of suppliers, manufacturers, logistics providers, and distributors. When geopolitical crises arise—such as wars, sanctions, or territorial disputes—they can cause delays, increase costs, and force companies to seek alternative routes or suppliers. In an era of globalization, even a localized conflict can have far-reaching effects on industries worldwide.
2. Trade Restrictions and Sanctions
One of the most immediate effects of geopolitical tensions is the imposition of trade restrictions, tariffs, and sanctions. Countries may restrict exports or imports of critical goods like oil, technology, or raw materials to exert political pressure. For example, sanctions on Russia following the Ukraine conflict disrupted the supply of natural gas and rare earth metals, causing ripple effects in energy-intensive industries and electronics manufacturing. Companies dependent on sanctioned countries face compliance risks, legal penalties, and the need to find alternative suppliers, often at higher costs.
3. Disruption of Transportation and Logistics
Geopolitical tensions often create unsafe or restricted transport routes, impacting maritime, air, and land logistics. Shipping lanes, like the Strait of Hormuz or the South China Sea, can become contested zones, raising insurance costs and causing shipping delays. Similarly, airspace restrictions force rerouting of cargo flights, increasing fuel consumption and delivery times. Ports in conflict zones may halt operations entirely, forcing supply chains to seek distant ports and increasing lead times. These disruptions not only delay deliveries but also create bottlenecks that affect the entire global distribution network.
4. Volatility in Commodity Prices
Geopolitical crises often trigger sharp fluctuations in commodity prices, particularly oil, gas, and metals. These price swings directly affect transportation costs and manufacturing expenses. For instance, during periods of Middle East instability, crude oil prices can spike, increasing the cost of shipping and production for industries reliant on fuel. Similarly, conflict in rare earth-producing regions can disrupt electronics and automotive industries, as these minerals are critical in high-tech manufacturing. Companies must adapt to these volatile conditions, often by hedging prices or maintaining strategic reserves of essential materials.
5. Supply Chain Diversification and Resilience Challenges
Geopolitical tensions highlight the vulnerability of single-source or regionally concentrated supply chains. Companies may face pressure to diversify suppliers and manufacturing locations to reduce risk. However, diversification comes with challenges such as higher operational costs, longer lead times, and complex coordination across multiple countries. For example, firms heavily reliant on Chinese manufacturing for electronics faced difficulties during U.S.-China trade disputes, prompting efforts to establish alternative production hubs in Southeast Asia or India. While diversification improves resilience, it also increases the complexity of global supply chain management.
6. Impact on Workforce and Production
Conflict or political instability can disrupt the availability of labor in affected regions. Strikes, protests, or military conscription reduce workforce productivity, while migration crises can strain labor markets in neighboring countries. Factories in politically unstable regions may face temporary closures, production slowdowns, or workforce shortages. For multinational companies, this unpredictability can delay production schedules and contractual obligations, ultimately affecting revenue and customer trust. In addition, geopolitical tensions can lead to restrictions on skilled labor movement, limiting access to essential technical expertise in global supply chains.
7. Cybersecurity Threats and Industrial Espionage
Geopolitical tensions often escalate cyber threats targeting supply chains. Nation-state actors may attempt to disrupt industrial operations, steal intellectual property, or sabotage logistics networks. Critical sectors such as defense, energy, and pharmaceuticals are particularly vulnerable. Cyberattacks can halt production, corrupt shipment data, or compromise financial transactions. Companies must invest in robust cybersecurity measures and contingency planning to protect their supply chain from these emerging risks. The integration of digital technologies in supply chains increases efficiency but also amplifies vulnerability to politically motivated cyber threats.
8. Financial and Insurance Implications
Geopolitical instability increases the financial risk of supply chains. Higher insurance premiums, cost of hedging against currency fluctuations, and increased interest rates for trade financing are common consequences. Companies may face liquidity challenges if payments are delayed due to banking restrictions in sanctioned countries. Financial risk management becomes critical to maintaining continuity in global operations. Firms may also have to maintain emergency funds or negotiate flexible credit terms with suppliers and logistics providers to cushion against sudden disruptions caused by geopolitical events.
9. Regulatory Compliance and Legal Challenges
Operating across regions with tense political relations requires strict adherence to international regulations, export controls, and sanctions. Violating these regulations, even unintentionally, can result in severe penalties, reputational damage, and operational restrictions. Companies must constantly monitor changes in laws across countries, ensure compliance, and train personnel accordingly. For instance, restrictions on dual-use technologies, military-grade materials, or certain chemicals may force supply chain redesigns. Legal complexities add operational overhead and require robust compliance management systems.
10. Strategic Shifts and Long-Term Supply Chain Transformation
Persistent geopolitical tensions push companies to rethink long-term strategies. This includes reshoring or nearshoring production, building strategic reserves, investing in automation, and leveraging local suppliers to reduce dependency on high-risk regions. Supply chain digitization and predictive analytics are increasingly used to anticipate disruptions and optimize logistics routes. Furthermore, geopolitical awareness is becoming a core part of corporate strategy, influencing investment decisions, market entry, and partnerships. Companies that proactively adapt to geopolitical realities can build competitive advantages through resilient, flexible, and agile supply chains.
Conclusion
Geopolitical tensions have a profound impact on global supply chains, affecting trade flows, transportation, commodity prices, workforce availability, cybersecurity, financial stability, and regulatory compliance. While these disruptions present challenges, they also create opportunities for companies to enhance supply chain resilience through diversification, technology adoption, and strategic planning. In an interconnected global economy, understanding and mitigating geopolitical risks is no longer optional—it is critical for maintaining operational continuity and competitive advantage.
Introduction to OPEC and Its Role in Global Oil Markets1. What is OPEC?
The Organization of the Petroleum Exporting Countries (OPEC) is an intergovernmental organization founded in 1960 by five countries: Iran, Iraq, Kuwait, Saudi Arabia, and Venezuela. Its primary purpose is to coordinate and unify petroleum policies among member countries to stabilize oil markets. OPEC’s membership has since expanded to 13 countries as of today, including nations like United Arab Emirates, Nigeria, Algeria, and Angola. By pooling their resources and coordinating production strategies, OPEC aims to influence oil prices and maintain market stability. It operates under a formal charter and holds regular meetings to discuss production quotas, market conditions, and global economic trends.
2. Historical Context and Formation
OPEC was formed during a period of global economic transformation. In the 1950s, oil prices were largely controlled by multinational corporations called the “Seven Sisters”, which dominated exploration, production, and pricing. Oil-producing countries often felt that they were not receiving fair value for their natural resources. In response, OPEC’s founding members sought to assert sovereignty over their oil reserves, control production levels, and ensure fair pricing for their exports. This shift marked a turning point in global energy politics, giving oil-producing nations greater influence over the world economy.
3. Objectives of OPEC
OPEC’s core objectives include:
Stabilizing oil markets to avoid extreme price volatility.
Securing fair and stable revenues for member countries.
Ensuring efficient, economic, and regular supply of petroleum to consumers.
Providing a steady return on investment to those engaged in oil production.
By balancing supply and demand, OPEC aims to create an environment where both producers and consumers benefit, avoiding abrupt price shocks that can destabilize economies.
4. OPEC Structure and Decision-Making
OPEC’s decisions are made collectively by its member states through the Conference of Ministers, which meets twice a year or more frequently if necessary. Key organs include the Secretary-General, who oversees operations, and various technical committees that analyze market trends, demand projections, and global oil inventories. Decisions about production quotas are consensus-based, meaning that all members must agree on output adjustments. This structure gives OPEC the ability to exert influence over global oil supply but also requires careful negotiation due to differing national interests among members.
5. OPEC’s Role in Oil Production and Pricing
OPEC controls about 40% of global oil production and more than 70% of proven oil reserves. By adjusting production quotas, OPEC can directly influence global oil supply, which in turn impacts prices. For instance, reducing production can tighten supply and push prices up, whereas increasing production can flood the market and lower prices. While OPEC does not set prices directly, its production policies strongly influence benchmark crude oil prices such as Brent and WTI. In essence, OPEC acts as a stabilizing force in a volatile market, helping prevent extreme swings that can disrupt global economies.
6. OPEC and Market Stabilization
One of OPEC’s primary mandates is market stabilization. Global oil markets are highly sensitive to geopolitical events, technological changes, and shifts in demand. OPEC monitors these factors to prevent sudden shortages or oversupply. For example, during the 1970s oil shocks, OPEC’s production cuts led to soaring prices, while in recent decades, coordinated production increases helped counteract periods of low demand. The organization also provides long-term market forecasts, helping member states plan investments and manage their economies more effectively.
7. OPEC’s Influence on the Global Economy
Oil is a critical commodity in the global economy, impacting everything from energy costs to inflation and trade balances. OPEC’s actions can influence fuel prices, industrial production, transportation costs, and consumer prices worldwide. For oil-importing nations, OPEC decisions often translate into higher or lower energy bills, affecting their macroeconomic performance. Conversely, oil-exporting countries rely on stable OPEC-led prices to fund infrastructure, social programs, and economic development initiatives. The organization, therefore, plays a dual role: balancing the interests of producers while indirectly affecting global consumers.
8. Challenges Facing OPEC
OPEC faces multiple challenges in the modern energy landscape:
Non-member competition: Countries like the United States, Russia, and Canada have significant shale and unconventional oil production, reducing OPEC’s market share.
Internal disagreements: Member countries have different economic needs, sometimes leading to disputes over production cuts or quota allocations.
Renewable energy transition: Global moves toward renewable energy and reduced fossil fuel consumption threaten long-term oil demand.
Geopolitical instability: Conflicts, sanctions, or political tensions in member countries can disrupt supply and affect OPEC’s credibility.
Addressing these challenges requires strategic diplomacy, flexibility in production, and collaboration with other major producers through initiatives like OPEC+.
9. OPEC+ and Global Cooperation
In recent years, OPEC has partnered with non-member countries, forming OPEC+, which includes Russia, Mexico, and other oil producers. This collaboration aims to coordinate production policies more broadly, enhancing OPEC’s influence in global markets. OPEC+ decisions have become particularly significant in responding to events like the COVID-19 pandemic, where drastic production cuts were required to stabilize collapsing oil prices. By expanding its cooperative network, OPEC has adapted to changing energy dynamics while maintaining relevance in a competitive global market.
10. Future Outlook and Strategic Importance
Looking ahead, OPEC’s role is likely to evolve in response to energy transition, climate policies, and technological innovation. While global demand for oil may plateau or decline over the long term, OPEC’s ability to manage supply, influence prices, and coordinate policies ensures it remains a critical player in the energy sector. Additionally, OPEC continues to invest in research, market intelligence, and sustainability initiatives to navigate uncertainties. For policymakers, investors, and businesses, understanding OPEC’s strategies is essential for anticipating price fluctuations, supply risks, and global energy trends.
Conclusion
OPEC is more than just a cartel of oil-producing countries; it is a strategic organization that balances the economic interests of producers and consumers. By coordinating production, stabilizing prices, and influencing global energy markets, OPEC plays a pivotal role in the global economy. While facing modern challenges like renewable energy and geopolitical risks, OPEC’s adaptive strategies and partnerships ensure it remains a central force in shaping the future of oil markets.
Introduction to Regional Price Differences1. Definition and Concept of Regional Price Differences
Regional price differences occur when the cost of a product or service varies between regions due to a combination of factors such as transportation costs, local demand and supply conditions, taxes, and market competition. These differences are not limited to goods alone but also extend to services like housing, healthcare, and education.
For example, the price of a smartphone may differ between metropolitan cities and rural areas due to logistical costs and varying consumer purchasing power. Regional price differences highlight the economic disparities between regions and help in understanding regional market dynamics.
2. Factors Causing Regional Price Differences
Several factors contribute to the variations in prices across regions:
Transportation and Logistics: Shipping goods over long distances increases costs. Remote areas often pay higher prices due to transportation expenses.
Supply and Demand: Products in high demand in a particular region may be priced higher, while in areas of oversupply, prices tend to drop.
Taxes and Regulations: Different regions impose varied taxes, tariffs, and regulatory costs, affecting final prices.
Local Economic Conditions: Income levels, employment rates, and regional economic health influence what consumers can pay.
Market Competition: More competitive markets often have lower prices, while monopolistic or limited-supply regions may experience higher prices.
3. Importance for Businesses
Understanding regional price differences is vital for businesses to develop effective pricing strategies. By analyzing these variations, companies can:
Optimize profit margins by adjusting prices according to regional purchasing power.
Decide on the best locations for distribution and retail.
Design promotional strategies tailored to local market conditions.
For instance, a luxury brand may price products higher in urban areas where consumers have more disposable income, while offering discounts or lower prices in rural regions to boost sales.
4. Role in International Trade
Regional price differences also play a significant role in international trade. Countries with lower production costs or cheaper labor can export products at lower prices, creating competitive advantages. Conversely, regions with higher prices may import goods to meet consumer demand at affordable rates.
For example, agricultural products from developing countries may be cheaper than in developed countries due to lower labor costs, influencing global trade patterns and consumer choices.
5. Price Arbitrage and Market Efficiency
Price differences create opportunities for arbitrage, where traders buy products in a low-price region and sell them in a high-price region, earning profits from the difference. This mechanism helps in balancing prices over time, promoting market efficiency.
However, transportation costs, tariffs, and market access restrictions may limit arbitrage. For instance, oil or gas price differences between countries often lead to international trading strategies designed to exploit these variations.
6. Consumer Behavior and Regional Pricing
Regional price differences directly affect consumer behavior. Consumers often make purchasing decisions based on price sensitivity:
In high-price regions, buyers may reduce consumption, switch to alternatives, or seek imports.
In low-price regions, consumers may increase consumption or attract traders from high-price areas.
Understanding these patterns helps businesses and policymakers anticipate demand fluctuations and plan accordingly.
7. Government Policies and Interventions
Governments often intervene to address regional price differences, especially for essential goods. Policies include:
Subsidies: Lowering the cost of goods in high-price regions.
Price Controls: Fixing maximum prices to protect consumers.
Infrastructure Development: Reducing logistics costs to equalize prices between regions.
Such measures ensure affordability, reduce regional inequality, and stabilize markets.
8. Impact on Inflation Measurement
Regional price differences can distort inflation indices if not accounted for. For instance, the Consumer Price Index (CPI) may vary significantly between urban and rural areas. Policymakers often use weighted averages or regional indices to capture the true impact of inflation on households across different regions.
Ignoring regional differences could mislead monetary policy decisions, affecting interest rates, taxation, and social welfare programs.
9. Technological and Digital Influence
Technology and e-commerce platforms are gradually reducing regional price differences. Online marketplaces allow consumers to access products from anywhere, often at competitive prices.
Price Comparison Tools: Help consumers find the lowest prices across regions.
Digital Payments and Logistics Solutions: Facilitate faster, cheaper movement of goods.
However, challenges remain, such as last-mile delivery costs, regional taxes, and local market conditions.
10. Future Trends and Implications
Regional price differences will continue to evolve with globalization, technology, and changing consumer behavior. Key trends include:
Increased Market Transparency: Consumers can compare prices globally, narrowing differences.
Dynamic Pricing Models: Businesses will adopt region-specific pricing using AI and big data.
Sustainable Supply Chains: Reducing logistics and production costs may lead to more uniform pricing.
Policy Adjustments: Governments may enhance infrastructure and regulations to ensure equitable access to goods.
Understanding these dynamics is crucial for businesses, investors, and policymakers to remain competitive and responsive to market needs.
Conclusion
Regional price differences are a fundamental feature of economic markets, influenced by a combination of supply-demand dynamics, logistics, government policies, and technological developments. They impact businesses, consumers, and trade flows while offering opportunities for profit and efficiency. By analyzing these differences, stakeholders can make informed decisions, ensure fair pricing, and contribute to regional economic development.
Gold as a Safe Haven Asset During Market Uncertainty1. The Historical Role of Gold as a Store of Value
Gold’s reputation as a safe haven asset is deeply rooted in history. Long before modern currencies were created, gold was used as money due to its rarity, durability, and universal acceptance. Empires and civilizations—from the Romans to the Chinese—recognized its intrinsic value. Unlike paper currencies, which can lose value due to inflation or political manipulation, gold has maintained its purchasing power over centuries. This enduring legacy has built investor confidence, making gold the ultimate hedge against economic collapse or monetary instability.
2. Gold’s Relationship with Inflation and Currency Devaluation
One of the key reasons investors flock to gold during uncertainty is its ability to preserve value during inflationary periods. When central banks print excess money or economies experience hyperinflation, the real value of currency declines. Gold, on the other hand, cannot be printed or artificially inflated. Its supply grows slowly through mining, keeping its scarcity intact. Historically, during times of high inflation—such as the 1970s oil crisis—gold prices surged as investors sought protection from declining fiat currency values.
3. Gold’s Performance During Financial Crises
Gold tends to perform strongly during financial market crises. For instance, during the 2008 Global Financial Crisis, stock markets around the world plummeted, yet gold prices surged from around $700 to over $1,200 per ounce in the following years. Investors shifted their capital from volatile equities and collapsing real estate markets into gold as a safer store of wealth. Similarly, during the COVID-19 pandemic in 2020, when uncertainty and market panic dominated, gold reached a record high of over $2,000 per ounce, reinforcing its role as a safe haven asset in times of chaos.
4. Gold’s Role in Portfolio Diversification
In investment strategy, diversification is key to managing risk. Gold often acts as an effective hedge because it has a low or even negative correlation with traditional asset classes like equities or bonds. When markets are in turmoil, stocks often decline, but gold tends to rise or remain stable. By including gold in a portfolio, investors can reduce volatility and overall risk exposure. Institutional investors, mutual funds, and even central banks include gold as a strategic component to ensure portfolio stability during downturns.
5. Gold as a Hedge Against Geopolitical Risk
Geopolitical instability—such as wars, trade conflicts, or political crises—creates uncertainty in global markets. During such times, currencies fluctuate, stock indices decline, and investor confidence weakens. Gold often becomes the preferred asset during these events because it is not tied to any one government or economy. For example, during the Russia-Ukraine conflict in 2022, global demand for gold increased as investors sought refuge from potential currency devaluation and market disruptions. Its universal acceptance makes it a neutral and borderless asset that retains value regardless of political boundaries.
6. Central Bank Policies and Their Impact on Gold
Central banks play a major role in influencing gold prices. When central banks adopt expansionary monetary policies—such as lowering interest rates or increasing money supply—gold prices often rise. Low interest rates reduce the opportunity cost of holding non-yielding assets like gold, making it more attractive to investors. Additionally, when central banks themselves buy gold, it signals trust in its long-term value. In recent years, emerging economies like China, India, and Russia have increased their gold reserves to diversify away from U.S. dollar dependence, strengthening gold’s status as a global reserve asset.
7. Investor Psychology and Market Sentiment
Gold’s appeal is not just economic—it’s psychological. During times of fear or uncertainty, investors instinctively move toward tangible assets that they can trust. Gold’s physical nature and intrinsic value give it emotional security that paper assets lack. This “flight to safety” effect means that when news of market instability spreads, investors collectively buy gold, driving up its price. This psychological factor reinforces the cycle of gold appreciation during uncertain times, as more people seek safety in an asset they perceive as stable and permanent.
8. Gold vs. Other Safe Haven Assets
While gold is the most well-known safe haven asset, others—like the U.S. dollar, Swiss franc, or U.S. Treasury bonds—also attract investors in crises. However, gold holds unique advantages. Unlike currencies, which can be manipulated through monetary policy, gold’s value is independent of any central authority. It is also free from credit risk, meaning it cannot default like bonds. Furthermore, unlike real estate or commodities like oil, gold is highly liquid and portable. This makes it an ideal asset for immediate protection and long-term wealth preservation during global financial stress.
9. Technological and Industrial Demand Supporting Gold Prices
Beyond its financial role, gold has growing industrial and technological applications, especially in electronics, renewable energy, and medical devices. Its conductivity and resistance to corrosion make it a critical material in high-tech industries. This real-world demand adds a fundamental layer of value to gold, ensuring that its price is not solely dependent on investor sentiment. Jewelry demand—especially from countries like India and China—also supports its global market stability. Together, these factors create a strong baseline for gold prices, even when financial markets are calm.
10. The Future Outlook for Gold as a Safe Haven
Looking ahead, gold’s role as a safe haven is expected to remain strong. In a world marked by rising geopolitical tensions, digital currency volatility, and potential economic slowdowns, investors will continue viewing gold as a stabilizing force. The rise of digital gold and gold-backed exchange-traded funds (ETFs) has made it easier for retail investors to participate in the gold market. Moreover, as global debt levels rise and faith in fiat currencies weakens, the demand for gold is likely to persist. Even in an increasingly digital economy, gold’s timeless appeal as a tangible, limited, and universally trusted asset ensures its continued relevance.
Conclusion
Gold’s reputation as a safe haven asset is well-deserved and time-tested. It offers protection against inflation, currency devaluation, market volatility, and geopolitical instability. Its scarcity, universal acceptance, and psychological comfort make it a unique hedge in uncertain times. Whether held by individuals, institutions, or central banks, gold continues to shine as a reliable symbol of stability and security.
In a global economy where uncertainty is the only constant, gold stands as a timeless reminder that true value endures beyond market cycles and monetary systems. For investors seeking long-term security amid financial turbulence, gold remains the ultimate safeguard of wealth.

How Freight Powers International Trade Flows1. Freight as the Foundation of Global Commerce
Freight transportation is the essential mechanism that makes global trade possible. Every product traded internationally — from electronics to food grains — must move through freight networks. Whether through container ships, cargo planes, or freight trains, these modes connect producers in one part of the world to consumers in another. Approximately 90% of global trade by volume moves via maritime freight, highlighting its dominance. The efficiency of freight systems determines how smoothly global trade operates and influences everything from delivery speed to product pricing.
2. Integration of Global Supply Chains
Freight is at the heart of global supply chain integration. Modern supply chains are complex networks where raw materials, components, and finished goods move between multiple countries before reaching the end consumer. For example, a smartphone may have chips from Taiwan, displays from South Korea, and assembly in China before shipping to global markets. Freight systems synchronize these movements, ensuring that production timelines are maintained and inventory flows efficiently. The coordination between shipping, warehousing, and logistics creates a seamless global trade structure that supports industries worldwide.
3. Maritime Freight: The Engine of Bulk Trade
The shipping industry is the most significant segment of freight transportation in international trade. Containerization — the use of standardized containers — revolutionized the way goods are transported, allowing easy transfer between ships, trucks, and trains. Bulk carriers transport essential commodities like oil, coal, iron ore, and grains that sustain global industries. Ports such as Singapore, Rotterdam, and Shanghai are critical trade hubs facilitating the majority of maritime trade. The cost-effectiveness of sea freight enables developing nations to participate in global trade by exporting raw materials and importing manufactured goods efficiently.
4. Air Freight: Speeding High-Value Trade
While maritime freight dominates in volume, air freight leads in value and speed. It is essential for transporting perishable goods, electronics, luxury items, and pharmaceuticals. Global courier companies such as FedEx, UPS, and DHL operate vast networks connecting continents within hours. Air freight supports industries where time-sensitive delivery is crucial, such as e-commerce and medical supply chains. During global crises — like the COVID-19 pandemic — air freight played a vital role in distributing vaccines, medical equipment, and emergency goods worldwide. Its ability to reduce transit time makes it indispensable to modern trade flows.
5. Rail and Road Freight: Connecting Landlocked Economies
Not all countries have direct access to seaports. For landlocked nations like Nepal, Afghanistan, or Switzerland, rail and road freight are critical for connecting to global markets. Rail freight offers cost-effective long-distance land transport, particularly across continents such as Europe and Asia. The Trans-Eurasian Railway, linking China to Europe, is a prime example of how rail corridors enhance international trade efficiency. Road freight complements rail by providing “last-mile” connectivity between ports, warehouses, and distribution centers. Together, these modes ensure that even remote regions can participate in the global trade network.
6. Technological Advancements in Freight Logistics
Modern freight systems are becoming increasingly digitalized, boosting the speed and reliability of trade flows. Automation, artificial intelligence (AI), GPS tracking, and blockchain are transforming freight logistics. Smart ports use automated cranes and drones to monitor cargo, while AI optimizes shipping routes to reduce fuel costs and emissions. Blockchain enhances transparency by providing real-time tracking of goods and verifying trade documents securely. Technologies such as the Internet of Things (IoT) allow constant monitoring of temperature, humidity, and location, which is vital for sensitive cargo like pharmaceuticals and food. These innovations make freight operations more efficient, resilient, and sustainable.
7. Freight Infrastructure as a Trade Enabler
Robust infrastructure development is a major driver of trade competitiveness. Ports, airports, railways, highways, and logistics hubs form the physical foundation of global freight systems. Countries investing heavily in infrastructure — such as China’s Belt and Road Initiative (BRI) — are reshaping global trade corridors. Improved infrastructure reduces transit times, minimizes delays, and cuts transportation costs. Additionally, intermodal terminals allow seamless transfer of cargo between different transport modes, ensuring efficiency throughout the trade journey. Well-developed freight infrastructure attracts foreign investment and strengthens a nation’s position in global trade networks.
8. Freight Costs and Trade Competitiveness
Freight costs significantly influence the pricing and competitiveness of goods in international markets. High transportation costs can make exports less attractive and imports more expensive. For instance, small island nations often face higher freight charges, limiting their trade potential. Conversely, countries with efficient freight systems enjoy lower trade costs and increased global competitiveness. Reductions in freight costs — through containerization, fuel efficiency, and digital logistics — have helped lower global trade barriers. Economists often consider freight efficiency as a key indicator of a country’s ability to compete in the international market.
9. Environmental Impact and the Push for Green Freight
Freight transportation, while essential for trade, also contributes to carbon emissions and environmental pollution. The maritime industry alone accounts for nearly 3% of global CO₂ emissions. As a result, there is growing emphasis on green freight initiatives, such as cleaner fuels, electric vehicles, and energy-efficient logistics. Organizations like the International Maritime Organization (IMO) are enforcing stricter emission standards to ensure sustainable shipping. Rail and electric freight options are gaining popularity as eco-friendly alternatives. Sustainable freight systems not only protect the environment but also align with global trade’s shift toward ESG (Environmental, Social, and Governance) goals.
10. Freight Resilience and Global Trade Stability
Recent global events — from the COVID-19 pandemic to the Suez Canal blockage — have underscored the importance of freight system resilience. Disruptions in major shipping routes or shortages of containers can cause ripple effects across industries and economies. Strengthening freight resilience through diversification of trade routes, building buffer capacities, and adopting digital logistics solutions has become a global priority. Resilient freight networks ensure the uninterrupted flow of goods, stabilize supply chains, and maintain economic balance. Nations that invest in flexible and adaptive freight infrastructure are better equipped to handle future global disruptions.
Conclusion
Freight is more than just the movement of goods — it is the lifeline of international trade. It connects nations, drives industrial growth, and enables global economic interdependence. From the vast ocean shipping routes to the rapid air cargo lanes and the expanding rail corridors, freight systems form the invisible network sustaining global commerce. As technology advances and sustainability becomes a priority, the future of freight lies in smarter, greener, and more resilient systems. Efficient freight operations will continue to power global trade flows, shaping the next era of globalization and economic progress.
Difference Between Forward and Futures Forex Markets1. Definition and Basic Concept
Forward Market:
A forward forex contract is a private agreement between two parties to buy or sell a specific amount of a currency at a predetermined rate on a future date. It is a customizable contract where the terms—such as amount, delivery date, and exchange rate—are negotiated directly between the buyer and the seller.
Futures Market:
A futures forex contract, on the other hand, is a standardized agreement traded on an organized exchange (such as the Chicago Mercantile Exchange - CME) to buy or sell a currency at a set price on a specific future date. Futures contracts are governed by exchange rules and are not negotiable between individuals.
Example:
If an Indian importer knows they must pay $1 million in three months, they can lock in today’s rate with a forward contract negotiated with their bank. Alternatively, they could use a futures contract on the exchange to hedge the same exposure, but under standardized terms.
2. Trading Venue and Regulation
Forward Market:
The forward forex market is Over-the-Counter (OTC), meaning trades occur directly between parties—usually through banks, brokers, or large financial institutions. It is unregulated compared to futures markets, giving flexibility but also introducing counterparty risk.
Futures Market:
Futures contracts are traded on regulated exchanges, ensuring transparency, standardized contract sizes, and proper oversight by authorities such as the Commodity Futures Trading Commission (CFTC) in the U.S. This makes the futures market more secure and trustworthy for investors.
Key Difference:
OTC forward markets offer privacy and customization, whereas futures markets emphasize standardization, regulation, and transparency.
3. Contract Customization
Forward Market:
Forward contracts are fully customizable. Parties can decide the exact amount, currency pair, settlement date, and method of delivery. This flexibility suits businesses and institutions with specific hedging needs.
Futures Market:
Futures contracts are standardized in terms of contract size, maturity dates (e.g., March, June, September, December), and settlement procedures. Traders must accept these fixed terms, which can limit flexibility but make trading easier for speculative purposes.
Example:
A company wanting to hedge €2.5 million in three months can easily set that amount in a forward contract. In contrast, a futures contract might have a fixed lot size (say, €125,000 per contract), so the company would need to trade multiple contracts to approximate the desired amount.
4. Settlement and Delivery
Forward Market:
Settlement occurs on the agreed future date, and most forward contracts end in actual delivery of the currencies. However, some may be settled in cash based on the difference between the agreed rate and the spot rate at maturity.
Futures Market:
Most futures contracts are cash-settled before expiry, as traders often close their positions before the delivery date. Only a small percentage result in physical delivery of the currencies.
Key Point:
Forwards typically end with physical delivery, while futures are mainly used for speculation and hedging without actual currency exchange.
5. Counterparty Risk
Forward Market:
Since forwards are private agreements, there is a high counterparty risk—the possibility that one party may default on the contract. There is no intermediary guaranteeing the trade.
Futures Market:
Futures contracts eliminate counterparty risk because the exchange clearing house acts as the intermediary, guaranteeing that both sides meet their obligations. Traders must maintain margin accounts to manage default risk.
Result:
Futures offer greater security due to exchange-backed settlement mechanisms.
6. Mark-to-Market and Margin Requirements
Forward Market:
Forward contracts are not marked to market, meaning profits or losses are realized only at the contract’s maturity. No margin or daily settlement is required.
Futures Market:
Futures contracts are marked to market daily, meaning gains and losses are settled every trading day. Traders must maintain margin accounts (initial and maintenance margins) to cover potential losses, ensuring market integrity.
Example:
If the exchange rate moves unfavorably in a futures position, the trader must deposit additional funds to maintain their margin. In forwards, the loss or gain is realized only at the end.
7. Liquidity and Market Participants
Forward Market:
Liquidity in forwards depends on the specific currency pair and the parties involved. It’s dominated by banks, multinational corporations, and institutional investors seeking to hedge specific exposures.
Futures Market:
The futures market is highly liquid due to standardized contracts and participation from a wide range of players—hedgers, speculators, and institutional traders. Continuous trading ensures tight spreads and efficient pricing.
In summary:
Forwards serve mainly for hedging; futures attract both hedgers and speculators due to liquidity and transparency.
8. Purpose and Usage
Forward Market:
Primarily used for hedging long-term exposures. Forwards protect against adverse currency movements for future transactions like exports, imports, or loans in foreign currencies.
Futures Market:
Used for both hedging and speculation. Hedge funds and traders use futures to profit from short-term price movements in currency pairs or to manage portfolio risk efficiently.
Example:
A corporate treasurer uses forwards to hedge a future payment, while a speculator might use futures to bet on the dollar strengthening against the euro.
9. Pricing and Cost Structure
Forward Market:
Forward prices are determined by the interest rate differential between the two currencies and the current spot rate. There are no exchange fees, but the pricing may include a bank’s spread or commission.
Futures Market:
Futures prices are also influenced by interest rate differentials but may deviate slightly from forward rates due to daily margin settlements and market expectations. Traders also pay exchange and brokerage fees.
Key Insight:
Forward pricing is customized and negotiated privately, while futures pricing is transparent and visible on exchanges.
10. Transparency and Accessibility
Forward Market:
Forward markets are less transparent, as prices and deals are not publicly available. Only large players like banks and corporations typically participate due to the high transaction size.
Futures Market:
Futures markets are highly transparent. Prices, trading volumes, and open interest data are publicly available in real time, enabling fair competition and analysis for all traders.
Final Comparison:
Transparency in futures ensures fairness and easier access for retail and institutional investors, while forwards remain largely institutional and relationship-based.
Conclusion
While both forward and futures forex markets allow participants to hedge or speculate on future currency movements, their structure, purpose, and participants differ greatly.
Forwards offer customization and flexibility but come with higher counterparty risk and limited liquidity.
Futures provide standardization, security, and transparency, making them ideal for speculative trading and risk management in a regulated environment.
In summary:
Aspect Forward Market Futures Market
Trading Venue OTC (Private) Exchange-Traded
Customization Fully customizable Standardized
Regulation Unregulated Regulated
Settlement On maturity Daily (mark-to-market)
Counterparty Risk High Minimal
Participants Corporates, Banks Traders, Investors
Transparency Low High
Liquidity Moderate High
Margin Requirement None Required
Usage Long-term hedging Hedging & speculation
How Spot Forex Trading Works1. Understanding the Concept of Spot Forex Trading
Spot Forex trading, also known as spot FX, refers to the direct exchange of one currency for another at the current market rate, known as the spot price. Unlike futures or options contracts, where settlement happens at a later date, a spot transaction is settled “on the spot”, typically within two business days (T+2) for most currency pairs.
The Forex market is the largest and most liquid financial market globally, with a daily trading volume exceeding $7 trillion. It operates 24 hours a day, five days a week, allowing traders from around the world to speculate on currency price movements. Spot Forex trading forms the foundation of global currency trading, providing real-time exchange of currencies between participants such as banks, corporations, investors, and retail traders.
2. The Participants in the Spot Forex Market
The Spot Forex market involves multiple participants who trade for different purposes:
Central Banks – Manage currency reserves, stabilize exchange rates, and implement monetary policies.
Commercial Banks and Financial Institutions – Facilitate interbank trading and currency exchange for clients.
Multinational Corporations – Exchange currencies for international trade and investment purposes.
Hedge Funds and Investment Firms – Engage in speculative trading to profit from currency fluctuations.
Retail Traders – Individuals using online platforms to speculate on short-term price movements.
Each participant contributes to market liquidity, influencing price dynamics based on supply and demand.
3. Currency Pairs and Price Quotation
In the Forex market, currencies are always traded in pairs, such as EUR/USD, GBP/JPY, or USD/INR. The first currency is the base currency, and the second is the quote currency.
The price quote represents how much of the quote currency is required to buy one unit of the base currency. For example, if EUR/USD = 1.0900, it means 1 Euro = 1.09 US Dollars.
Each pair has:
Bid Price – The price at which the market (or broker) is willing to buy the base currency.
Ask Price – The price at which the market (or broker) is willing to sell the base currency.
The difference between these two is called the spread, which represents the broker’s commission or transaction cost.
4. How Spot Forex Transactions Are Executed
Spot Forex trading operates through over-the-counter (OTC) networks rather than centralized exchanges. When a trader places a buy or sell order on a trading platform, the broker executes it through liquidity providers or the interbank market.
For instance, if a trader buys EUR/USD, they are effectively buying Euros while selling US Dollars at the current spot rate. The transaction is typically settled within T+2 days, though in practice, many brokers offer rolling spot contracts, which are automatically extended daily for speculative purposes.
Execution types include:
Market Orders – Executed instantly at the best available price.
Limit Orders – Executed when the market reaches a specified price level.
Stop Orders – Triggered when the price crosses a set threshold to limit losses or capture breakouts.
5. The Role of Leverage in Spot Forex Trading
Leverage is one of the most distinctive features of the Forex market. It allows traders to control large positions with relatively small amounts of capital. For example, a 1:100 leverage ratio means that a trader can control a $100,000 position with only $1,000 of margin.
While leverage amplifies potential profits, it also magnifies losses, making risk management essential. Professional traders typically use moderate leverage and implement stop-loss mechanisms to protect against adverse movements.
Regulators in different regions impose varying limits on leverage — for example, 1:30 in the EU (ESMA regulations) and 1:50 in the US.
6. Determinants of Spot Forex Prices
Spot exchange rates are influenced by numerous macroeconomic, geopolitical, and technical factors:
Interest Rate Differentials: Higher interest rates attract foreign capital, boosting demand for the currency.
Economic Indicators: GDP growth, employment data, inflation, and trade balances affect currency valuation.
Central Bank Policies: Monetary tightening or loosening directly impacts currency strength.
Political Stability: Political risk or uncertainty weakens investor confidence, depreciating the currency.
Market Sentiment and Speculation: Traders’ collective expectations drive short-term fluctuations.
Global Events: Wars, pandemics, and natural disasters can trigger volatility across the Forex market.
In short, Forex prices are a reflection of global economic health and investor confidence.
7. Profit and Loss Calculation in Spot Forex
The profit or loss in a spot Forex trade is determined by the change in exchange rate between the time the position is opened and closed.
For example, if a trader buys EUR/USD at 1.0900 and sells it later at 1.1000, they gain 100 pips (the fourth decimal point represents a pip in most pairs).
Profit calculation formula:
Profit (USD)
=
Pip Movement
×
Lot Size
×
Pip Value
Profit (USD)=Pip Movement×Lot Size×Pip Value
For a standard lot (100,000 units), one pip in EUR/USD equals $10. Thus, a 100-pip move equals $1,000 profit.
Conversely, if the trade moves against the trader, losses occur at the same rate. Hence, understanding position sizing and pip value is crucial for effective risk management.
8. Settlement and Delivery in Spot Forex
While traditional spot Forex transactions involve physical delivery of currencies within two business days, retail traders rarely take delivery. Instead, brokers provide contract-based trading that simulates real exchange but is settled through cash differences in profit or loss.
For institutional participants, however, settlement occurs through systems like CLS (Continuous Linked Settlement), which eliminates settlement risk by synchronizing payments between major financial institutions globally.
Thus, while the spot market technically implies immediate delivery, in practice, most participants engage for speculative or hedging purposes without currency delivery.
9. Risk Management in Spot Forex Trading
Spot Forex trading carries inherent risks due to volatility, leverage, and unpredictable global events. To mitigate these, traders adopt structured risk management strategies:
Stop-Loss and Take-Profit Orders – Automatically close positions at predefined levels to control losses or lock in profits.
Position Sizing – Limiting trade size relative to account equity, often 1–2% per trade.
Diversification – Avoiding concentration in one currency pair or region.
Economic Calendar Monitoring – Tracking major events like central bank meetings and GDP releases to anticipate volatility.
Technical and Fundamental Analysis – Combining chart patterns with macroeconomic insights to make informed decisions.
Effective risk management ensures long-term sustainability and consistent returns in the Forex market.
10. Advantages and Challenges of Spot Forex Trading
Advantages:
High Liquidity: Tight spreads and minimal slippage due to massive global participation.
24/5 Availability: Traders can operate across global time zones without limitation.
Low Entry Barriers: Retail traders can start with small capital using micro or mini accounts.
Leverage Access: Enables higher market exposure with limited funds.
No Centralized Exchange: Global accessibility through OTC trading networks.
Challenges:
High Volatility: Sharp fluctuations can trigger significant losses.
Leverage Risk: Over-leveraging can wipe out accounts quickly.
Information Overload: Constant economic updates require active monitoring.
Broker Reliability: Unregulated brokers pose counterparty risks.
Psychological Pressure: Emotional control is essential for success in a fast-paced market.
Despite these challenges, spot Forex trading remains one of the most popular avenues for both institutional and retail investors due to its liquidity, flexibility, and potential for profit.
Conclusion
Spot Forex trading represents the core of the global currency market, enabling participants to exchange currencies directly at real-time rates. Its structure—comprising major participants, dynamic pricing, leverage, and decentralized execution—creates immense opportunities and risks alike. Understanding how the market functions, the economic forces behind exchange rates, and effective risk management techniques is crucial for success. Whether used for speculation, hedging, or international trade, the Spot Forex market remains a cornerstone of global finance, reflecting the heartbeat of the world’s economic and political landscape.
Impact of Central Bank Policies on Global Indices1. Interest Rate Decisions and Stock Market Valuations
One of the most direct ways central banks affect global indices is through interest rate policy. When a central bank such as the U.S. Federal Reserve, European Central Bank (ECB), or Bank of Japan changes benchmark interest rates, it impacts corporate profitability and investor sentiment.
Rate cuts make borrowing cheaper, stimulating business expansion and consumer spending. This boosts earnings expectations, leading to higher stock prices and rising indices such as the S&P 500 or FTSE 100.
Rate hikes, on the other hand, increase borrowing costs, reduce spending, and pressure profit margins, leading to a bearish sentiment across global markets.
Thus, the direction of central bank rates often sets the tone for short- to medium-term movements in global indices.
2. Quantitative Easing (QE) and Liquidity Injection
During economic downturns, central banks often implement Quantitative Easing (QE)—the purchase of government and corporate bonds to inject liquidity into the financial system.
This policy increases the money supply, lowers long-term interest rates, and encourages investment in riskier assets like equities.
For example, the Federal Reserve’s QE programs after the 2008 financial crisis and during the COVID-19 pandemic led to massive rallies in global indices such as the NASDAQ, Dow Jones, and MSCI World Index.
Increased liquidity often pushes investors toward stocks, resulting in higher valuations and stronger index performance globally.
3. Tapering and Liquidity Withdrawal
Conversely, when central banks begin tapering QE or reducing asset purchases, it signals a tightening monetary stance. Markets perceive this as a withdrawal of easy money, often leading to volatility.
The “Taper Tantrum” of 2013, when the Federal Reserve hinted at slowing its bond purchases, caused global bond yields to spike and emerging market indices to decline sharply.
Tapering reduces the availability of cheap capital, which can deflate overvalued markets and cause corrections across global indices.
4. Currency Exchange Rate Impacts
Central bank actions significantly influence foreign exchange rates, which in turn affect multinational companies and stock market indices.
For instance, a strong U.S. dollar resulting from higher Federal Reserve interest rates can hurt U.S. exporters, leading to declines in indices such as the Dow Jones and S&P 500.
Conversely, a weaker yen due to the Bank of Japan’s accommodative policy benefits Japanese exporters, pushing the Nikkei 225 higher.
Exchange rate movements impact global trade competitiveness, profits, and valuations—key factors in index performance.
5. Inflation Control and Market Stability
A central bank’s mandate often includes maintaining price stability. When inflation rises beyond targets, banks respond by tightening policy (raising rates or reducing liquidity).
High inflation reduces purchasing power and increases input costs for companies, which negatively impacts profit margins and stock valuations.
For example, aggressive rate hikes by the Federal Reserve in 2022–2023 to combat inflation led to declines in major indices like the NASDAQ Composite and S&P 500.
Conversely, successful inflation management fosters confidence, encouraging investors to re-enter equity markets.
Thus, inflation control directly affects both short-term volatility and long-term market stability.
6. Impact on Bond Yields and Equity Valuation Models
Central bank policy decisions influence bond yields, which are critical to equity valuation models.
When central banks lower rates, bond yields fall, and the discount rate used in valuing future corporate earnings decreases. This leads to higher present values of future cash flows, making equities appear more attractive.
In contrast, rising yields due to policy tightening make bonds more competitive with stocks, often prompting a rotation from equities to fixed income.
This dynamic is visible across global indices, where valuation multiples (like P/E ratios) expand or contract depending on central bank yield policies.
7. Investor Sentiment and Global Risk Appetite
Central bank communication—through forward guidance and policy statements—greatly influences investor sentiment and global risk appetite.
Dovish statements (indicating a preference for low rates and economic support) often boost investor confidence and lead to index rallies.
Hawkish tones (signaling tightening or rate hikes) can trigger sell-offs as investors anticipate slower growth.
Markets often react more to the tone and outlook of central bank meetings than to the actual rate changes. The Federal Reserve’s or ECB’s policy stance thus sets the mood for global equity performance.
8. Global Spillover Effects and Policy Synchronization
In today’s interconnected world, central bank actions have global spillover effects.
For instance, when the U.S. Federal Reserve raises rates, capital often flows from emerging markets to the U.S. in search of higher returns. This leads to depreciation of emerging market currencies and declines in their stock indices.
On the other hand, synchronized easing policies—as seen during the 2020 pandemic—can drive global liquidity surges and push indices across continents to record highs.
Thus, the coordination (or lack thereof) among major central banks—Fed, ECB, BoJ, and PBoC—affects not just domestic markets but global equity trends.
9. Sectoral Impacts within Indices
Central bank policies impact different sectors of an economy unevenly, influencing the composition of index performance.
Financial sector stocks (banks and insurers) generally benefit from higher interest rates as they improve lending margins.
Technology and growth stocks, however, tend to perform better in low-rate environments where borrowing is cheap and future growth is highly valued.
Therefore, changes in monetary policy can shift the leadership within global indices, with cyclical or defensive sectors taking turns depending on policy stance.
10. Long-Term Structural Implications
Finally, central bank policies have long-term structural effects on market valuation, risk perception, and investor behavior.
Prolonged periods of ultra-low interest rates can lead to asset bubbles, excessive leverage, and distortions in capital allocation.
On the other hand, consistent and transparent policy frameworks strengthen financial stability, foster sustainable growth, and create confidence in long-term investments.
For example, the credibility of the U.S. Federal Reserve’s inflation targeting has historically anchored investor trust, supporting steady growth in indices like the S&P 500 over decades.
Thus, beyond short-term volatility, central bank credibility shapes the very foundation of global financial markets.
Conclusion
The impact of central bank policies on global indices is profound and multifaceted. From influencing interest rates and liquidity to shaping investor psychology and cross-border capital flows, central banks are the key architects of modern financial stability. Their actions ripple through bond, currency, and equity markets—driving both short-term volatility and long-term trends.
Ultimately, understanding central bank policy decisions is essential for investors, traders, and analysts seeking to interpret the movement of global indices. In an interconnected global economy, the pulse of equity markets beats in rhythm with central bank policy shifts—making monetary policy one of the most powerful forces in global finance.

Future Trends in Global Index Trading1. Expansion of Thematic and Sector-Based Indices
Traditional indices like the S&P 500 or FTSE 100 are giving way to thematic indices that focus on specific industries or megatrends such as artificial intelligence, green energy, cybersecurity, biotechnology, and space technology.
Investors are increasingly allocating capital toward sectors that align with technological innovation or sustainability goals. This evolution will diversify index offerings and allow traders to gain exposure to cutting-edge sectors without needing to pick individual stocks.
For example, ESG and renewable energy indices are expected to attract major institutional inflows as global decarbonization policies intensify. Similarly, AI-focused indices will become a major attraction as machine learning reshapes corporate productivity.
2. Rise of AI and Algorithmic Trading in Index Management
Artificial Intelligence (AI) and algorithmic models are transforming index trading by enhancing speed, accuracy, and decision-making.
Advanced algorithms analyze massive data sets in real time, predicting market sentiment, volatility, and correlations between global indices. These tools enable traders to rebalance portfolios instantly and exploit arbitrage opportunities.
In the future, AI-driven “smart indices” could automatically adjust their weightings based on macroeconomic conditions, geopolitical risk, or investor sentiment — creating dynamic, self-optimizing benchmarks rather than static ones.
3. Increased Popularity of Passive Investing and ETFs
Over the past decade, passive index funds and exchange-traded funds (ETFs) have outperformed most active managers. This trend will continue as investors seek low-cost, diversified exposure to global markets.
Global ETF assets are projected to surpass $20 trillion by 2030, largely fueled by index-linked strategies. As more retail and institutional investors favor passive investing, liquidity in major indices like the MSCI World, NASDAQ-100, and Nifty 50 will deepen.
Moreover, fractional and automated ETF investing platforms will make index exposure more accessible, further democratizing global market participation.
4. Integration of ESG (Environmental, Social, and Governance) Criteria
Sustainability will be one of the defining features of future global index construction. Regulators and investors alike are demanding transparency, ethical governance, and environmental accountability.
ESG indices will not only track performance but also quantify corporate sustainability using measurable metrics such as carbon footprint, social equity, and board diversity.
In the next decade, “green indices” may become a mainstream benchmark, influencing capital allocation toward responsible corporations. Investors will increasingly use carbon-adjusted indices or climate risk-weighted indices to mitigate environmental exposure.
5. Real-Time Global Connectivity and 24/7 Trading
With technology reducing barriers between global markets, the concept of 24/7 trading across indices is becoming a reality.
Cryptocurrency markets already operate continuously, setting the precedent for traditional markets to follow. Index futures and global ETFs may soon be traded around the clock, allowing traders to react instantly to geopolitical or economic developments in any region.
Enhanced inter-market connectivity among exchanges in Asia, Europe, and North America will ensure smoother liquidity flow and minimize regional trading gaps.
6. Blockchain and Tokenization of Indices
Blockchain technology will revolutionize how indices are built, traded, and settled. Through tokenization, entire indices could be represented as digital tokens, allowing investors to buy fractional shares of global market indices seamlessly.
This innovation will make global index trading more transparent, secure, and accessible, particularly for retail investors.
Smart contracts could automate dividend distribution, rebalancing, and settlement, while decentralized finance (DeFi) platforms may introduce index-backed synthetic assets, enabling trading beyond traditional market hours.
The fusion of blockchain and finance will create a borderless, low-cost trading environment.
7. Customizable and Personalized Index Products
Investors of the future will demand customized indices that align with their personal risk tolerance, ethical values, or investment objectives.
Through AI-based portfolio construction, traders could create personal indices tracking specific sets of companies, sectors, or regions — effectively blending active and passive investing.
Robo-advisors and fintech platforms are already offering custom index portfolios that automatically rebalance based on user preferences, risk profiles, or global market movements.
This personalization trend will redefine how investors interact with global indices, making index trading both dynamic and individual-centric.
8. Data-Driven Trading and Predictive Analytics
The future of global index trading will rely heavily on big data, alternative data, and predictive analytics.
Beyond financial metrics, traders will analyze satellite imagery, shipping data, internet traffic, and sentiment analysis from social media to anticipate index trends.
Predictive models powered by machine learning will improve timing, reduce drawdowns, and identify early signals of macroeconomic shifts.
For example, sentiment data from millions of online sources could forecast the next market correction or bull run before it appears in traditional indicators.
Data-driven decision-making will become the cornerstone of competitive index trading.
9. Geopolitical and Economic Diversification
Global index traders must increasingly account for geopolitical risk, trade tensions, and currency fluctuations.
The rise of regional economic blocs — such as BRICS expansion, Asian market integration, and European green reforms — will lead to new regional index compositions.
Diversification across multiple regions will become essential to hedge against localized shocks like war, inflation, or policy shifts.
Future indices will incorporate multi-currency and multi-region components, helping investors reduce exposure to any single market’s volatility.
This diversification will also open opportunities for cross-border arbitrage and currency-hedged index products.
10. Regulatory Evolution and Market Transparency
As global index trading expands, regulatory oversight will strengthen. Authorities such as SEBI, SEC, and ESMA are developing frameworks to ensure data integrity, transparency, and investor protection in index creation and trading.
Future regulations will likely require disclosure of index methodologies, weighting criteria, and data sources, ensuring fairness and accountability.
Moreover, with the rise of AI and algorithmic trading, governments will impose ethical and operational standards to prevent manipulation and systemic risk.
Enhanced transparency will foster trust, attract more institutional participation, and create a stable global trading ecosystem.
Conclusion
The future of global index trading will be defined by technology-driven transformation, investor empowerment, and sustainable innovation.
AI, blockchain, ESG integration, and data analytics will reshape how indices are constructed, traded, and understood. The line between active and passive investing will blur as markets evolve toward automation, customization, and inclusivity.
As global economies become more interconnected, traders who embrace these trends — combining digital intelligence with strategic diversification — will thrive in the next generation of financial markets.

Options Blueprint Series [Intermediate]: ES Condor in the Clouds1 — The Market in a Cloud Layer
The S&P 500 (E-mini and Micro E-mini) futures have recently been caught in a curious atmospheric pattern — not of weather, but of price action. After a strong sell-off shook the market a few days ago, both Fibonacci extensions and retracement zones now cluster densely above and below the current price. When these are joined by multiple Floor Trader Pivot Points and Unfilled Order (UFO) zones sitting in similar regions, a clear message emerges: this market is potentially trapped in a range.
Resistance has been repeatedly observed near 6,873, while the lower boundary around 6,437 continues to attract buyers. The index seems to be trapped between Fibs — a typical post-volatility consolidation phase.
For traders who understand that sideways markets can be just as valuable as trending ones, this environment presents an opportunity. Instead of chasing direction, the goal becomes to capture time decay while staying within defined risk limits.
2 — The Strategy: Short Iron Condor Fundamentals
A Short Iron Condor combines two credit spreads:
A short call spread above current price
A short put spread below current price
Together, they create a “no-fly zone” for the underlying — a region where the trader earns maximum profit if price remains between the inner strikes.
This position benefits from:
Stable or neutral price movement
Time decay (theta)
Declining implied volatility
The Iron Condor offers defined risk and defined reward, making it a powerful candidate for range-bound markets like the current ES setup. While the maximum gain is limited to the net premium collected, the maximum loss is also capped, making this a risk-defined non-directional strategy.
Because this structure has both call and put spreads, it offers low Vega exposure — meaning it’s not overly sensitive to volatility shocks. For intermediate traders, this makes it a comfortable way to step beyond simple single-leg strategies and into the world of multi-leg, theta-driven structures.
3 — The Setup: Building the ES Condor
For this idea, we’re looking at the ES (E-mini S&P 500 Futures) options expiring on November 13.
The structure is built as follows:
Sell 6880 Call @ 34.43
Buy 6890 Call @ 31.69
Buy 6430 Put @ 55.32
Sell 6440 Put @ 57.07
This results in a net credit, generating the potential for a maximum profit of 4.49 points (per spread), while the maximum risk stands at -5.51 points. The reward-to-risk ratio comes to approximately 0.8:1, with a statistical win rate of 52.6% based on the current volatility surface, and the Breakeven points: 6,436 and 6,884.
As long as the ES price remains between these levels by expiration, the structure will achieve profitability. The Iron Condor works best when volatility remains stable or contracts — a condition currently supported by the post-drop equilibrium visible in implied volatility readings across near-term expirations.
4 — Chart Context: Technical Landscape Supporting the Range
The chart of the E-mini S&P 500 Futures (ES) reveals a tight compression zone forming between Fibonacci extensions and retracement levels above @ 0.618 (≈6,868) and below @ 0.618 (≈6,437). This overlap with Floor Trader Pivots — specifically R1 at 6,873 and S1 at 6,488 — paints a classic range structure. This setup can be the natural habitat for an Iron Condor.
While directional traders may feel frustrated by sideways movement, option sellers can see this as a period of controlled opportunity — where theta decay compensates for the market’s hesitation.
In other words, as long as ES continues to “hover in the clouds,” the Condor quietly collects premium.
5 — CME Product Specifications and Margins
Understanding the underlying contracts is essential when selecting between E-mini S&P 500 Futures (ES) and Micro E-mini S&P 500 Futures (MES) for this options setup.
E-mini S&P 500 (ES) Futures
Tick Size: 0.25 = $12.50 per tick
Trading Hours: Nearly 24 hours (Sunday–Friday, CME Globex)
Margin (approx.): $21,000 per contract
Micro E-mini S&P 500 (MES) Futures
Contract Size: 1/10 of ES
Tick Size: 0.25 = $1.25 per tick
Margin (approx.): $2,100 per contract
(Margins may vary slightly depending on volatility and broker policies.)
For smaller accounts or for traders looking to practice scaling and hedging, the MES provides a highly capital-efficient alternative to ES.
When executing the Short Iron Condor, traders may also consider margin offsets if the structure is risk-defined — a benefit when using portfolio margin accounts. However, margin usage will vary by broker and account type.
6 — Risk Management: Keeping the Condor in the Clouds
Every Iron Condor begins with a disciplined approach to risk.
Here’s how it can be managed:
Position Sizing: Determine exposure based on the maximum loss, not the credit received. For instance, risking 1–2% of account equity per structure keeps risk contained even during volatility spikes.
Exit Before Expiration: Avoid gamma risk in the final days. Closing the trade when 50–60% of the maximum profit is achieved can reduce time risk while locking in gains.
Adjustments: If price nears a breakeven zone (6,436 or 6,884), traders can consider rolling the threatened side further away or closing half of the position to reduce delta exposure.
Volatility Awareness: A volatility spike can temporarily pressure the mark-to-market value.
Because the Iron Condor is short Vega, it benefits from a calm or contracting volatility regime.
When markets are calm, this strategy works beautifully; when storms approach, it’s time to bring the Condor to the ground.
When charting futures, the data provided could be delayed. Traders working with the ticker symbols discussed in this idea may prefer to use CME Group real-time data plan on TradingView: www.tradingview.com - This consideration is particularly important for shorter-term traders, whereas it may be less critical for those focused on longer-term trading strategies.
General Disclaimer:
The trade ideas presented herein are solely for illustrative purposes forming a part of a case study intended to demonstrate key principles in risk management within the context of the specific market scenarios discussed. These ideas are not to be interpreted as investment recommendations or financial advice. They do not endorse or promote any specific trading strategies, financial products, or services. The information provided is based on data believed to be reliable; however, its accuracy or completeness cannot be guaranteed. Trading in financial markets involves risks, including the potential loss of principal. Each individual should conduct their own research and consult with professional financial advisors before making any investment decisions. The author or publisher of this content bears no responsibility for any actions taken based on the information provided or for any resultant financial or other losses.
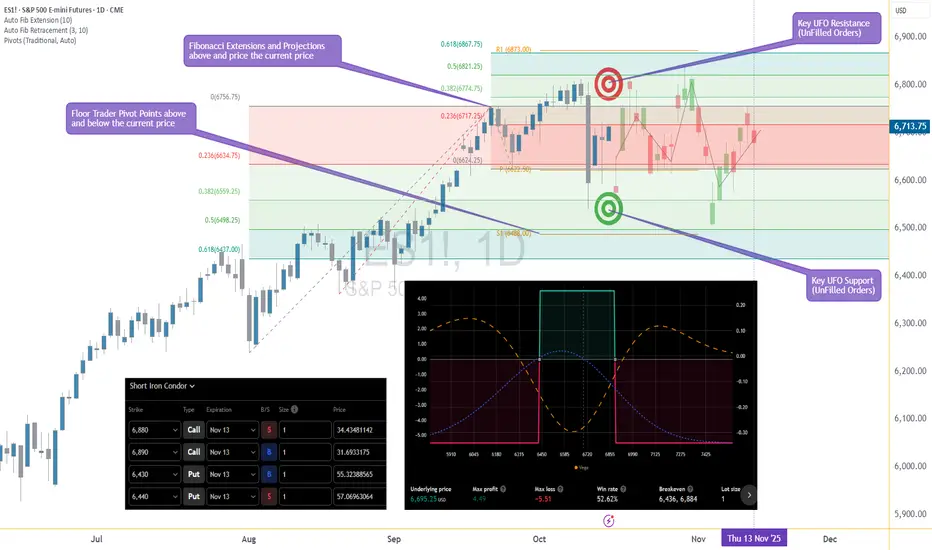
What Are These Messy Lines in my Chart? - Explaining the AlgosIf you’ve checked out my trading chart, you might’ve noticed it looks a bit complex — full of colorful lines and structures. But have you ever wondered what those lines are really for?
Each one is drawn to graphically identify the presence of invisible algorithms — the hidden forces that move the market. At any given time, multiple algorithms are battling for control of price direction. By visualizing their interaction on the chart, we can begin to see the true structure behind market movement.
Understanding this gives you a deeper insight into how markets actually function — and that insight can completely change the way you trade.
If you find this perspective useful, consider subscribing and diving deeper into this style of market analysis.

Universal Trading Psychology: The Patience Paradox PlaybookUniversal Trading Psychology: The Patience Paradox Playbook
A general discipline lesson you can apply to any liquid market and any timeframe
Most trading pain is not caused by a bad system. It is caused by impatience. The edge appears when you plan inactivity, watch with intent, wait for confirmation, and only act when setup quality is high. Cash is a position.
1. Why patience beats impulse in every market
Impatience sneaks in as early entries, overtrading, revenge trading, and random scaling. These habits feel productive because you are clicking and chasing motion. In reality they transfer capital from your future self to the present urge. Patience does the opposite. It gives your method time to read structure, it allows volatility and volume to normalize, and it keeps your energy for the right moment. The effect is universal. It does not matter if you trade indices, commodities, crypto, stocks, or forex. It does not matter if you trade on the one minute, the fifteen minute, or the daily. The core link is simple. Better timing raises the probability of an idea and lowers drawdown. Fewer attempts with higher quality improve expectancy and improve return divided by drawdown. That is the language that every account understands.
2. The Patience Paradox in plain language
The paradox says you can win more by doing less. You plan windows where you watch the market without touching the buy or sell buttons. You promise to yourself that you will let a timer run and you will only act after a confirmation event. Inactive minutes feel like a cost at first. In practice they are an investment. They reduce noise, they teach you the current regime, and they keep you calm enough to apply your edge. The paradox holds across sessions. The first minutes after a session begins often have high noise and emotional bait. The middle of the session can go quiet and trick you into forcing trades. The last minutes can be erratic. A patient trader respects this rhythm and keeps a written plan of when to observe and when to allow action.
3. Observation windows that fit any market
Observation windows are simple. Pick a time block. Start a timer. During the block you do not place orders. You watch the tape, the order of bars, the response to levels, and the size of swings. You collect awareness. You write one or two sentences about regime and structure. Then the timer ends. Only then do you look for a trade.
Observation windows you can adopt today
Pre session scan for fifteen minutes. You prepare levels and watch the first hints of tempo. Inactive only.
Session open observation for fifteen minutes. You let the first box form. No orders until a bar closes beyond this box and the next bar respects that information.
Mid session read for thirty minutes. You classify regime as active or quiet using simple filters and you decide trend, range, or inactivity.
Pre secondary session observation for fifteen minutes. If your market has two major sessions, you repeat the open observation idea.
Post trade cooldown for ten to twenty minutes. You break the dopamine loop, you write a short review, and you reset your attention.
How to make it practical
Place a small physical timer on your desk. A phone timer also works. Print a one page card with your windows and durations. When the window starts, say out loud that you are in observation and you will sit on hands until the timer ends. This small ritual builds identity. It tells your brain that watching is part of trading and not a waste of time.
4. Confirmation that cuts false signals
Impatience usually shows up as early entry without confirmation. The most portable rule is also the simplest. Wait for the close. A signal bar that looks perfect in the middle of its life can close with a wick, a rejection, or a full flip. If you still want earlier entry mechanics, use delay one bar. You let a signal print. You enter on the next bar only if price remains valid. Both rules reduce false positives and reduce the total number of attempts. That is a feature, not a bug. The quality of attempts goes up. The mood in your head calms down. Your journal becomes cleaner to read and your expectancy calculation becomes more stable.
A universal confirmation checklist
The setup is valid by your written plan.
Close confirms beyond structure or a retest holds and closes in your direction.
Regime filters are supportive. You see participation that matches the idea.
Risk and position size are defined. The exit is clear before you click.
5. Regime filters that travel well
Regime is the background condition that decides if your strategy is likely to read the market correctly. You can estimate regime with two simple filters. One measures volatility. One measures participation. These two are available on any platform.
Volatility filter
Use average true range with a long enough length to be stable. A common choice is length fifty. Express ATR as a percent of price so you can compare across timeframes and symbols. Compare the current reading to a baseline such as the daily median over the last few weeks. Above the baseline means active regime. Below means quiet regime.
Participation filter
Use a session volume baseline. A simple moving average of session volume works. When current volume is below the baseline, you demand more patience or you switch to range tactics. When current volume is above the baseline, you keep confirmation strict and you avoid random scalps.
Session filter
Every market has time of day effects. The first minutes can be noisy. Lunchtime or the middle band can be flat. The last minutes can snap. You plan a response. Observe at the open. Reduce attempts in the lull. Keep the end of session simple.
6. Cooldown, loss streak lockout, and daily loss limit
Cooldown is the fastest lever you can pull to stop impulsive streaks. After any loss you start a ten to twenty minute cooldown. You leave the chart zoom alone. You write a short paragraph with what the market did and what you did. This break cuts the urge circuit and lets you reset. A lockout is a stronger version. Two losses in a row at full risk trigger a lockout until the next session. Three small losses also trigger a lockout. A win does not cancel a lockout if you broke plan discipline during the win. A daily loss limit protects the account from a bad day. Pick a fraction of your weekly drawdown budget. When you hit it, you stop for the day. These three guardrails build survivorship and keep your mind from spiraling.
7. Expectancy and return divided by drawdown
Expectancy is the average outcome per trade. Write it as average win multiplied by win probability minus average loss multiplied by loss probability. It is a small number in units of R. That is fine. The power of expectancy is repetition. The second metric to watch is return divided by drawdown. This tells you how efficiently you compound given the cost of the worst pullback. Patience improves both. Cutting early attempts raises win probability and often raises average win because you pick cleaner structure. Removing impulsive losses reduces drawdown. Together they stabilize equity and make your process less emotional.
A quick way to measure
Log ten to twenty trades under the patience protocol. Record average win in R, average loss in R, win rate, and worst drawdown in R. Compute expectancy and return divided by drawdown. Then compare to your prior logs where you did not respect observation or confirmation. The difference shows you why patience pays.
8. A portable pre market checklist
Checklists prevent decision fatigue. Use one page. Keep the language simple.
Trade plan
Plan is visible. Strategy is defined.
Entry, exit, and position size rules are clear and written.
Journal template is open.
Market regime
ATR as percent of price labeled active or quiet.
Session volume labeled below baseline or above baseline.
Prior session open, high, low, close marked.
Observation windows for the first minutes drawn on the chart.
Session timing
Pre session observation timer set.
Open observation window scheduled.
Lunchtime lull noted.
Post session review time booked.
Watchlist and setup quality
Three to five names maximum.
One sentence setup description for each name.
Score the idea from one to five on quality.
Act only on four or five.
Confirmation and patience
Delay one bar or close based confirmation selected.
Inside bar means wait. No exceptions.
If FOMO appears, start a five minute micro timer and breathe.
Say out loud that doing nothing is a valid decision.
Risk and position control
Risk per trade set as a fixed percent of equity.
Stop never widened after entry.
No adds unless the plan explicitly allows scaling.
Daily loss limit and lockout rules visible.
Exit plan
Exit condition defined before entry.
Partial exits use confirmation if the system supports it.
If a volatility spike hits, reduce risk or exit per plan.
Journal the reason for the exit.
9. A simple setup quality score
A score makes permission to trade objective. Use five factors. Each is zero to two.
Factors
Regime. Market aligned with the strategy using the filters.
Structure. Setup is clean with room to target.
Timing. Observation respected and confirmation present.
Risk. Position size correct and stop placed where logic breaks.
Mindset. Patient attention present and FOMO absent.
Eight or more means permission. Seven or less means wait. This one rule saves careers.
10. A day in the life under the Patience Paradox
You begin fifteen minutes before your active session with an observation. You mark levels and write a short line about tempo. No orders. When the session begins you let the first box print. A breakout looks tempting inside the window, but you stay inactive. The next bar fails to close beyond the box. You extend the delay. Later participation rises above the baseline and volatility reaches the active zone. Your strategy calls for a trend pullback entry. You wait for a bar to close back in the direction of trend. Then you take a single position with one percent risk. The trade reaches target. You record the result and start a short cooldown. Near the second session open you repeat the observation idea. A clean setup appears but your score is only six. You pass and write one sentence to honor the decision. You end the day with a review and update your metrics. Equity is stable. Attention is calm. The process feels repeatable.
11. Overtrading prevention that actually works
Limit attempts per session. Use micro breaks whenever fatigue appears. If the journal shows a loss streak, apply the lockout. If volatility is too low, accept inactivity. If noise is heavy near the open, extend the observation. If you break any rule, record the event and reduce size on the next attempt. Prevention is cheaper than recovery. You will never regret a trade you did not take. You will often regret the one you forced.
12. Mindfulness and urge surf for traders
Mindfulness is not about long meditation. It is about a one minute reset. Watch the breath for one minute. Name the urge silently. Start a two minute timer and surf the wave. When it passes, you return to the plan. This tiny protocol moves you from reaction to response. Over time it raises your discipline score and lowers your cost of error.
13. Frequently asked behavior questions
What if the first clean setup appears during the first minutes of the day
You still respect the observation. The first confirmation bar after the window often gives better probability and a calmer entry.
What if volume stays below average all day
Reduce attempts. Focus on one name or stay inactive. Quality beats quantity. You are paid for selectivity, not activity.
What if I miss a win after a long wait
Missing is normal. Write it in the journal and keep the schedule. The market never runs out of opportunities. Your attention does.
How do I measure improvement
Track three numbers. Expectancy. Return divided by drawdown. Discipline score. If the first two rise and the third stays above four, the process is working.
14. Install the Paradox in one week
Day one. Print the checklist and the windows. Place a timer on the desk. Commit to half the usual number of attempts.
Day two. Run all observation windows. Log only confirmed ideas.
Day three. Add the cooldown after any loss. Review your writing at the end of the day.
Day four. Apply the loss streak lockout if needed. Protect the account.
Day five. Score every idea with the five factor grid. Only trade eight or more.
Day six. Compute expectancy and return divided by drawdown from the week.
Day seven. Read your notes. Keep the parts that made you calm and effective. Remove what was noise.
15. Comparator versus a passive baseline
You want to see that patience improves efficiency. Pick a baseline that matches your market. If there is a natural session, use buy at session open and exit at session close. If there is no natural session, use an always in market baseline. Then run the Patience Paradox protocol next to it.
How to compare in three steps
Compute baseline results across your window. Record attempts, average result per session, and worst drawdown in R.
Compute Paradox results with observation windows, confirmation, and guardrails. Record attempts, expectancy, and worst drawdown in R.
Compute return divided by drawdown for both. When the protocol is respected, this ratio usually improves even if total trades drop. Your account and your sleep benefit from that.
16. A journal template you can use today
Before entry
Setup name and one sentence description.
Regime notes on volatility and participation.
Quality score and reason for each point.
Risk in R and exit plan.
After exit
Result in R and whether the logic held.
What you felt and how you responded.
What you would repeat and what you would remove.
One sentence lesson for the board.
17. Advanced patience drills for professionals
The inside bar extension
When a bar prints inside the prior range you extend the observation by one more bar. This drill stops you from guessing breakouts and creates a natural delay.
The half size probation
After a loss you allow the next confirmed idea at half size. You return to full size only after a clean win that followed plan. This keeps you from trying to win it back.
The one pass rule
You allow yourself one pass on a marginal idea each week. You write the reason and the outcome. This rule prevents a cascade of rationalizations.
18. Closing perspective
Patience is not passive. It is active observation guided by rules. A professional monitors regime, respects timers, demands confirmation, and protects the account with cooldowns and lockouts. The paradox is simple. Inactivity at the right time raises probability, keeps drawdown shallow, and makes expectancy stable. Traders who internalize this find that the market stops feeling like a battle and starts feeling like a process. You do less. You see more. You let the best ideas come to you.
Education and analytics only. Not investment advice.
Thank you all for reading this article.
If you have any type of requests, drop a comment below.

TradeCityPro Academy | Support & Resistance Part 1👋 Welcome to TradeCityPro Channel
🎓 Educational Section Technical Analysis Training Series
Welcome to the Educational Content Section of our channel!
Here, we aim to teach you technical analysis from A to Z through structured playlists.
We’ll cover everything from risk and capital management, Dow Theory, support and resistance, trends, and market cycles, to more advanced concepts.
Our lessons are based on both real market experience and The Handbook of Technical Analysis.
🎨 What is Technical Analysis?
Technical Analysis (TA) is a method used to forecast price movements in financial markets by analyzing historical data, especially price and volume.
It’s based on the idea that history tends to repeat itself, and that recurring patterns can reveal profitable trading opportunities.
🧩 The Human Concept of Support and Resistance
Support and resistance aren’t just numbers on a chart — they’re the result of collective human behavior.
When large groups of traders make similar decisions — buying or selling — at a certain level, that area becomes psychologically important in the market.
Support forms where fear of missing out (FOMO) drives people to buy.
Resistance forms where fear of loss motivates people to sell.
💭 The Psychology Behind Formation
In a downtrend, when prices fall too much, traders start thinking “It can’t go any lower”, and buying pressure increases — forming support.
In an uptrend, when prices rise sharply, traders think “It’s too expensive now”, and selling pressure builds — forming resistance.
So, these levels reflect emotions like fear, greed, and FOMO, rather than being purely technical.
🌍 Real-World Example
When the USD price drops so low that everyone rushes to buy it — that’s support.
When gold becomes so expensive that no one wants to buy anymore — that’s resistance.
Markets operate on these same human instincts — only visualized through candlesticks and numbers.
🧩 Introduction
In technical analysis, two key concepts exist in nearly every strategy:
Support and Resistance.
These are areas on the chart where the probability of price reaction or reversal is high.
🟢 What is Support?
A support level is where buying pressure is expected to increase and prevent further price decline.
It acts like a floor that supports price.
📘 Example:
If Bitcoin repeatedly bounces from the $60,000 level, that area is considered a support zone.
🔴 What is Resistance?
A resistance level is where selling pressure increases, preventing further price growth.
It acts like a ceiling that stops price movement upward.
📘 Example:
If Ethereum fails multiple times to break above $3,800, that area is a resistance zone.
📈 How to Identify Support and Resistance
There are several methods to detect these levels:
Previous Highs and Lows:
The most common method — look for areas where price has reacted before.
Trendlines:
In an uptrend, connecting higher lows gives you a dynamic support line.
Moving Averages (MA):
MAs like MA50 or MA200 often act as dynamic support or resistance.
Supply and Demand Zones:
Areas where heavy buying or selling previously occurred.
⚙️ Market Psychology
Support and resistance are emotional memory points for traders.
When price reacts to a level once, it becomes mentally significant, leading to similar reactions in the future.
That’s why these zones often repeat over time.
🔄 Breakouts and Role Reversal
When price breaks a support or resistance level with strong volume and momentum, that level changes its role:
Broken resistance → becomes new support
Broken support → becomes new resistance
This concept is known as Role Reversal.
🎯 Importance of Timeframes
Support and resistance zones on higher timeframes (Daily, Weekly) carry greater significance, since more traders and larger volumes are involved.
🧠 Pro Tips
✅ Always treat support and resistance as zones, not fixed price points.
✅ If price approaches a level with strong momentum, it’s more likely to break it.
✅ Combine S/R with candlestick reactions, volume, and indicators for confirmation.
✅ Levels that repeat multiple times usually grow stronger over time.
💬 Summary
Support and resistance are the foundation of technical analysis.
Understanding them helps you find better entry and exit points and gain a deeper insight into market psychology.
Turtle Soup - Risky but high risk reward method.Hi friends let's have a look to the Turtle soup method. It's known from ICT, but original author is Linda Raschke. Strategy was described in the book street smarts ICT has repackaged it and falsely claimed that it's his own as most of his concepts.
There is not much new to be invented in a trading. People are still trying to find new holly grail and educators are delivering new methods and secrets. While it's always something what iconic traders as Gann, Elliot, Dow etc.. has invented in the last century. In my opinion we should approach every information as master Bruce Lee says:
Adapt whats useful , reject what is useless and add what is specifically your own.
And this is how I adopted Turtle soup in as a part of my setup, I rejected 20 days Low / high conditions as I didn't find it useful. Does it increase profitability ? Yes, but it also reduce number of profitable trades. So here is how I see it.
🧩 What is a Turtle Soup?
• Turtle soup / stop Hunt is a false breakout or liquidity purge focuses on the concept of liquidity hunts, where the market triggers stop-losses of retail traders before reversing.
• High risk entry method but with high risk reward potential.
• Turtle soup is how real move starts.
• Often occurs during the high Impact news
🧩 Characteristics of Turtle Soup
• Turtle soup is in other words stop hunt
• Price moves beyond a significant level briefly.
• Sudden reversal into the prior range
📌 Trade examples Classic turtle soup
🧪 EURUSD Short Click picture below to see how price action formed 👇 🧪 GBPUSD Short Click picture below to see how price action formed 👇 🧪 USDCHF Long Click picture below to see how price action formed 👇https://www.tradingview.com/chart/USDCHF/WrvLuU3j-USDCHF-Daily-CLS-Model-Long-from-KL-rates-cut-is-priced-in/ It's effective because it capitalizes on the retail traders classic mistakes- FOMO and trading break out of the highs and selling the lows. While market makers are doing the opposite (don't get me wrong, Im also retail trader and you are too) trading so called smart money concepts doesn't make us smart money traders.
📌 Logic behind the action of retail
Less informed traders sold early and other group of Turtles buying break out, they are wrong on the top. Sellers were used as liqudity and buyers are now trapped in the long where price reverse against them. Turtle soup during the manipulation phase.
📌 Logic behind the action of retail
Less informed traders bought early and other group of Turtles selling the break out of the lows, they are wrong on the lows. Sellers were used as liqudity and buyers are now trapped in the long where price reverse against them. Method is effective and it feels great catching highs and lows, but you need to ask yourself questions :
🧠 Do you want to become profitable, or are you chasing sniper entries to impress others in communities and feed your ego? If your goal is profitability. remember that all you truly need is an edge.
Hence, turtle soup is part of my strategy mixed with the ranges. It gives us complete 100% mechanical trading approach which I have described in this post Click to picture to learn more 👇
🧩 Market Context is important
successful turtle soup entry occurs only when you have right the market context. In other words you want to buy lows in uptrend and sell highs in the downtrend.
📌 Up Trend - Trade Stop Hunt (Turtle soup) buy below the lows
📌 Down Trend - Trade Stop hunts (Turtle soup) sell above the highs ‼️ You can only catch high-probability turtle soups if you have accurately determined the higher timeframe draw on liquidity and entering on the pullback deep enough.
📌 Not every level is valid for you to trade . Trade only those below 50% pullback - in other words in the discount 📌 Wrong approach
We can see low was turtle souped / stop hunted and your setup occurs on the key level its all fine 📌 Setup is technically right. But by placing the trades in premium they creates a stop loss cluster = liquidity in the discount. Then this happen - price go for the liquidity of early buyers in the premium hits key level in the discount and it continue with the trend. Im not saying that key levels in the premium cant work, in the strong trend there is no always pullback to the discount. But by applying Dealing ranges you will get:
• Less but more accurate trades
• Higher Risk reward setups
• You can build HTF narrative
• Use it for targets
• Better risk management
You also need to build a sharp narrative around it using weekly and intraday profiles.
OHLC, P03, dealing ranges and so on, because there is different ways how market makers deliver price to the key level it can be either simple AMD or expansion to the reversal.
🧩 Turtle soup and key level
if you see range just below the key level. Smart money are building liqudity and there will be manipulation. If price is already on key level deep manipulation is not necessary. or it can be sharp expansion to the reversal which is the best turtle soup entry to catch highs / Lows. HTF Key live is a must part of the setup.
if there is not a key level in the premium price is often retracing to the discount key level in order to create a liquidity around a key level price makes a false break which sucks traders in to the market and create a liquidity on a key level and liquidate them. 🧩 Entry Method:
You don't need sniper-accurate entries to be profitable.
You don't need to catch the extreme top or bottom to succeed. All you need is an edge
over the markets and a clear awareness of all the variables so you can stay vigilant.
📌 Successful Trades Turtle soup + Range :
🧪 USDCHF Turtle Soup Long - CIOD confirmation click picture👇
🧪 USDJPY Turtle Soup Long - CIOD confirmation- Click picture 👇
🧪 AUDUSD Turtle Soup Short - CIOD confirmation picture👇
🧩 Step-by-Step Approach
• Always start with the Higher Timeframe and define the trend Monthly / Weekly
• Identify your draw on liquidity using the Daily and 4-hour timeframes.
• Focus on the double bottom / Tops - thats best targets
🧩 Build a Narrative:
• Determine how price is likely to move toward the draw on liquidity.
• Identify which key levels it might test before expanding toward the target.
• Consider when liquidity might be taken (key times) and when reversals could occur.
🧩 Select Key Levels and Candle Ranges:
• Choose key levels and a relevant candle range.
🧩 Wait for Stop Hunts / Turtle soup / Manipulation:
• Look for these to occur at a key times during the London or New York session
💊 Price is fractal
If you want to refine on the lower timeframe here is the how to trade it during the London session. click picture👇 As I quoted master Bruce lee on the beginning:
Adapt whats useful , rajcect what is useless and add what is specifically your own.
Take from this what useful , but remember strategy is only 20% of success. What makes it working is traders conviction , confidence and discipline which is build by backtesting and knowing your statistical data.
✨ Trading Mastery is reflection of your life
Have a longterm plan, No Alcohol & Drugs, Ignore others, Focus on your journey , Backtest regularly, Review your weeks, Journal mistakes, Exercise, Sleep well, Read books, Walks in nature (no phone) , Meditate, Reduce social media time, Spend time with family, Live Life.
Trading is hard, but not impossible. I believe in you 💪
David Perk aka Dave Fx Hunter
Catching a Falling Knife - The Illusion of OpportunityNOTE – This is a post on mindset and emotion. It is NOT a trade idea or system designed to make you money. My intention is to help you preserve capital, energy, and focus — so you can execute your own trading system with calm and confidence.
A sharp selloff.
Price is plunging.
The chart looks like it’s gone too far .
Your eye zooms in on that last swing low - “It has to bounce here.”
You tell yourself you’re being brave… opportunistic… disciplined even.
Beneath the surface, something else is driving the impulse.
A need to get involved and capitalize on opportunity
A need to relieve tension and fomo
A belief that there’s value here.
A sense of excitement. Things are moving.
A chance to make back all that I’ve lost before - plus more.
When markets fall fast, the nervous system reacts.
Adrenaline spikes.
The body wants to do something - to turn impulse into action.
To buy the bottom feels like you’ve beaten the market. That you’ve proven that you can do this and that you’re really really clever.
But every time you step in too soon, the same pattern repeats:
You’re not trading your process
You’re trading your emotions, your sense of self worth and lets be honest
Face it. You’ve been hijacked.
Body cues:
Eyes darting across screens, scanning for reversal signals.
Shoulders tense, leaning closer to the monitor.
A restless tapping of fingers or bouncing knee as you wait for confirmation.
Breath shortening, shallow and quick.
Underlying belief:
“If I can catch this, I’ll prove that I’m right”
How to shift it:
When you feel that urge to step in early, force a pause.
Name what’s really happening: “My mind wants action, and it wants to be right ”. Ask the question
“Do I want to be right or do I want to make money?”
Then redirect that energy toward process - not action.
Waiting doesn’t make you passive.
It’s an act of discipline and power.
Remember Eddie Murphy and Dan Ackroyd in Trading Places.
The art of waiting for the moment, and then engaging is the mark of a disciplined professional trader.
Stay safe out there and live to trade another day
For another related post, check out this one on buying the dip
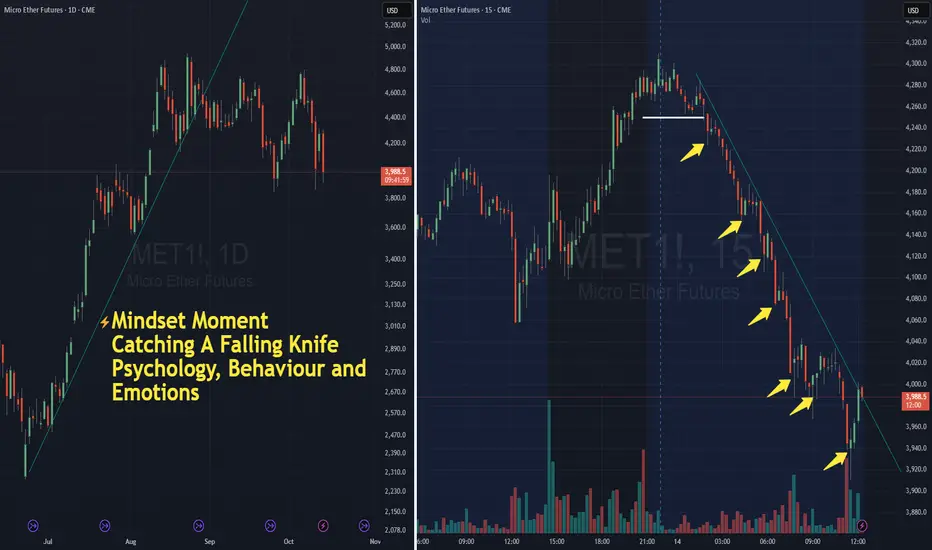
President Donald J. Trump (the real market maker) There are traders… and then there’s Donald Trump, a man who could move multi-trillion-dollar markets without ever opening a Bloomberg terminal. For years, investors studied technicals, Fibonacci ratios, and order flow to predict direction. But from 2017 onward, one force bent all that — policy surprises and public statements from the U.S. President himself.
Trump’s influence didn’t end when he left office. Even in 2025, markets still respond instantly to his tariffs, trade policies, and economic commentary. He became, in every sense of the word, “The Real Market Mover.”
🧠 When Policy Became Price
Traditionally, markets move on data, GDP releases, CPI, interest rates, central bank minutes. But during Trump’s tenure and resurgence in 2025, words carried the same weight as data. Tweets, press briefings, and tariff announcements created knee-jerk reactions that dwarfed technical setups.
Price action no longer followed pure structure, structure reacted to political noise.
1️⃣ The Trade War Shock — May 2019
Event:
In early May 2019, Trump tweeted that tariffs on $200 billion worth of Chinese imports would increase from 10% to 25%. This came unexpectedly after months of optimism about trade negotiations.
Market Reaction:
The S&P 500 fell over 2% in two sessions.
USDJPY dropped as traders sought safety in the yen.
Gold (XAUUSD) spiked from around $1,270 to $1,300 in a matter of days.
Global equity markets — from Shanghai to Frankfurt — mirrored the sell-off.
chart : S&P 500
Lesson:
Fundamentals can erase weeks of technical buildup in hours. Chart structure provided direction, but timing belonged to policy.
2️⃣ Oil’s Verbal Rescue — April 2020
Event:
After the COVID-19 collapse sent oil below $20 a barrel, Trump publicly claimed he had spoken to both Vladimir Putin and Saudi Crown Prince Mohammed bin Salman, saying they agreed to large output cuts.
Market Reaction:
chart ; WTI gain
WTI Crude surged over 30% in a single day, one of the sharpest one-day gains in modern oil history.
Energy stocks rebounded aggressively.
CAD and NOK, both oil-linked currencies, caught strong bids.
Lesson:
Market psychology is as powerful as supply and demand. Traders weren’t just pricing crude — they were pricing hope.
3️⃣ Bitcoin’s “Not a Fan” Tweet — July 2019
Event:
On July 11, 2019, Trump tweeted:
“I am not a fan of Bitcoin and other cryptocurrencies, which are not money and whose value is highly volatile...”
Market Reaction:
chart : BTCUSD drop
BTCUSD dropped from $12,000 to below $9,000 within a week.
Altcoins mirrored the sell-off.
Volatility spiked across crypto derivatives exchanges like BitMEX and Deribit.
Lesson:
Even a decentralized market isn’t immune to centralized sentiment. In crypto, narrative drives volatility faster than fundamentals.
4️⃣ The Iran Strike — January 2020
Event:
On January 3, 2020, the U.S. conducted an airstrike that killed Iranian General Qassem Soleimani.
Geopolitical tension spiked overnight.
Market Reaction:
chart : GOLD gain
Gold (XAUUSD) jumped nearly 3%, touching $1,600, a level not seen since 2013.
Oil (WTI) surged over 4% on supply concerns.
Equities and risk currencies sold off sharply.
Lesson:
Geopolitical shocks move markets not because of numbers, but uncertainty. Traders price fear, not fundamentals.
5️⃣ The 2025 Tariff Shock & Crypto Liquidation
Event:
In October 2025, Trump announced 100% tariffs on all Chinese imports, alongside restrictions on software exports and AI-linked technology. The announcement came suddenly during a campaign rally and caught the market completely off guard.
Market Reaction:
chart : BITCOIN drop
Bitcoin fell by nearly 14% in 24 hours, triggering the largest liquidation in crypto history — over $19 billion in leveraged positions wiped out.
Nasdaq futures dropped over 3% pre-market.
Gold (XAUUSD) broke above $4,000 per ounce for the first time ever, peaking near $4,125, while Silver (XAGUSD) hit record highs above $45.
Yuan (USDCNH) weakened rapidly as investors rushed into the U.S. dollar and Japanese yen.
Lesson:
When macro meets emotion, liquidity vanishes. No technical setup can prepare you for a macro shock of that scale. The market doesn’t just move, it reprices reality.
6️⃣ “Phase One” Relief — December 2019
Event:
After months of trade tension, Trump announced that the U.S. and China had reached a “Phase One” trade deal.
Market Reaction:
The S&P 500 broke to new highs above 3,200.
USDJPY rose as risk appetite returned.
Gold briefly cooled off from safe-haven highs.
Lesson:
Fear creates liquidity gaps, but relief fills them even faster. Markets always overreact in both directions.
🔍 Final Word
Trump didn’t just comment on the economy, he is a market event.
Every tariff, tweet, and offhand remark had measurable price consequences.
In 2025, when Bitcoin collapsed and gold surged to $4,000+, traders witnessed once again that in modern markets, politics and price are inseparable.
For those who rely only on charts, remember:
“technicals shows where; fundamentals decide when.”
put together by : Pako Phutietsile as @currencynerd

Currency (Forex) Market Dynamics1. Structure of the Forex Market
1.1 Market Tiers
The forex market has a multi-tiered structure, consisting of:
Interbank Market – The top level, where large financial institutions and central banks trade directly or via electronic networks. This segment sets the benchmark rates and provides liquidity to the market.
Institutional Market – Investment funds, multinational corporations, and hedge funds engage here to hedge currency exposure or speculate on macro trends.
Retail Market – Involves individual traders accessing the market through brokers using online platforms. Although smaller in volume, retail trading has grown significantly due to technological advancements and leverage facilities.
1.2 Major Trading Centers
The market operates through global financial hubs in a 24-hour cycle, moving from:
Sydney → Tokyo → London → New York
This rotation ensures continuous liquidity and allows for global participation. London and New York dominate daily turnover, accounting for nearly two-thirds of total volume.
1.3 Types of Forex Markets
Spot Market: Immediate exchange of currencies at current rates.
Forward Market: Agreements to exchange currencies at a future date at a predetermined rate.
Futures Market: Standardized contracts traded on exchanges (e.g., CME) for future delivery.
Options Market: Grants the right but not the obligation to exchange currencies.
Swaps: Simultaneous buying and selling of currencies for different value dates; used for hedging and liquidity management.
2. Major Participants and Their Roles
2.1 Central Banks
Central banks are key players influencing forex dynamics through monetary policy, interest rate decisions, and currency interventions.
For instance:
The U.S. Federal Reserve (Fed) impacts the dollar’s global strength.
The European Central Bank (ECB) influences the euro.
The Bank of Japan (BoJ) affects yen liquidity through yield curve control.
Their policies on money supply, inflation targets, and interest rates directly determine currency valuation.
2.2 Commercial and Investment Banks
Banks facilitate the majority of forex transactions, both for clients and proprietary trading. They act as market makers, quoting bid and ask prices, thereby maintaining market liquidity.
2.3 Corporations
Multinational firms engage in forex transactions to hedge exchange rate risk arising from cross-border operations. For example, an exporter in Europe receiving U.S. dollars may hedge future receipts against EUR/USD fluctuations.
2.4 Hedge Funds and Institutional Investors
Hedge funds, sovereign wealth funds, and asset managers engage in speculative trading based on macroeconomic trends, interest rate spreads, and geopolitical events. Their large trades can cause significant short-term volatility.
2.5 Retail Traders
Retail participation has expanded rapidly through online brokers. Using leverage, traders speculate on currency pairs, often focusing on major pairs such as EUR/USD, GBP/USD, USD/JPY, and USD/CHF. Although retail traders constitute a smaller portion of total volume, their activity can influence intraday movements.
3. Determinants of Exchange Rate Movements
Exchange rates fluctuate constantly due to a multitude of economic and psychological factors. Understanding these dynamics is essential to interpreting market behavior.
3.1 Macroeconomic Indicators
Inflation Rates: Higher inflation erodes currency value, making it less attractive to investors.
Interest Rates: Higher interest rates attract capital inflows, strengthening the currency.
GDP Growth: Strong economic performance signals higher investment potential, boosting demand for that currency.
Unemployment and Wage Data: Reflect domestic demand and policy direction.
3.2 Balance of Payments and Trade Flows
Countries with trade surpluses (exports > imports) tend to experience currency appreciation due to strong demand for their goods and currency. Conversely, trade deficits exert downward pressure.
3.3 Fiscal and Monetary Policies
Expansionary fiscal policies (e.g., increased government spending) and loose monetary policies (e.g., quantitative easing) often weaken the domestic currency. Tightening policies, on the other hand, attract foreign investors seeking higher yields.
3.4 Political and Geopolitical Factors
Political stability, elections, wars, and sanctions significantly affect investor sentiment. For instance, geopolitical tensions in the Middle East often lead to a “flight to safety”, strengthening the U.S. dollar and Swiss franc.
3.5 Speculative Forces
Short-term price movements are frequently driven by speculative traders responding to news releases, technical patterns, and market psychology.
4. Market Mechanics and Price Formation
4.1 Bid-Ask Spread
The difference between the bid (buy) and ask (sell) price reflects liquidity and transaction cost. Major pairs like EUR/USD have tight spreads due to high liquidity, while exotic pairs (e.g., USD/INR) have wider spreads.
4.2 Order Types and Execution
Common order types include:
Market Orders: Executed at current price.
Limit Orders: Executed when price reaches a specified level.
Stop Orders: Triggered to limit losses or lock in profits.
High-frequency trading (HFT) and algorithmic strategies now account for a large share of order execution, enhancing liquidity but occasionally intensifying volatility.
4.3 Price Discovery
Prices are determined through supply-demand equilibrium, shaped by economic fundamentals and trader expectations. The interbank market ensures continuous price adjustment across trading centers.
5. Technical and Fundamental Analysis in Forex
5.1 Fundamental Analysis
Focuses on macroeconomic data, monetary policy, and geopolitical trends. Traders evaluate relative economic strength between two countries to determine fair value.
Example:
If the U.S. raises interest rates while the Eurozone keeps them unchanged, the USD is likely to appreciate against the EUR due to higher yield attractiveness.
5.2 Technical Analysis
Relies on historical price data to identify trends, support/resistance levels, and chart patterns. Popular tools include:
Moving Averages (MA)
Relative Strength Index (RSI)
Fibonacci Retracements
Bollinger Bands
MACD (Moving Average Convergence Divergence)
5.3 Sentiment and Intermarket Analysis
Sentiment indicators such as the Commitment of Traders (COT) report show positioning of large market participants. Additionally, forex prices often correlate with commodities and bonds:
AUD/USD correlates with gold prices.
USD/CAD correlates with oil prices.
JPY strengthens when global equities decline (risk-off sentiment).
6. Major Currency Pairs and Crosses
6.1 Major Pairs
These involve the U.S. dollar and are the most traded:
EUR/USD (Euro / U.S. Dollar)
USD/JPY (U.S. Dollar / Japanese Yen)
GBP/USD (British Pound / U.S. Dollar)
USD/CHF (U.S. Dollar / Swiss Franc)
6.2 Minor (Cross) Pairs
Exclude the U.S. dollar, such as:
EUR/GBP, EUR/JPY, GBP/JPY.
6.3 Exotic Pairs
Involve emerging market currencies (e.g., USD/INR, USD/TRY). These pairs have lower liquidity and higher volatility.
7. Role of Technology and Algorithmic Trading
7.1 Electronic Communication Networks (ECNs)
ECNs connect liquidity providers and traders directly, enabling faster execution and tighter spreads.
7.2 Algorithmic and High-Frequency Trading
Algorithms execute large volumes of orders at microsecond speeds based on mathematical models. While they improve efficiency, they can also amplify volatility during sudden market shocks (e.g., flash crashes).
7.3 Artificial Intelligence and Machine Learning
AI models are increasingly used for predictive analytics, sentiment analysis, and risk management. By analyzing big data from news, social media, and order books, algorithms can anticipate market reactions.
8. Risk Management in Forex Trading
8.1 Types of Risks
Market Risk: Adverse price movement.
Leverage Risk: Amplified losses due to high leverage.
Liquidity Risk: Inability to execute trades at desired prices.
Interest Rate Risk: Differences in yields between currencies.
Political Risk: Unexpected policy or regime changes.
8.2 Risk Control Techniques
Stop-loss and Take-profit Orders
Position Sizing and Diversification
Hedging through Options or Forward Contracts
Using Low Leverage in Volatile Markets
Proper risk management ensures survival in a market characterized by rapid price swings and unpredictable events.
9. Global Economic and Geopolitical Influences
9.1 U.S. Dollar Dominance
The USD remains the world’s reserve currency, accounting for nearly 60% of global foreign exchange reserves. Dollar liquidity and U.S. Treasury markets underpin global trade and finance.
9.2 Emerging Markets
Currencies such as the Indian Rupee (INR), Chinese Yuan (CNY), and Brazilian Real (BRL) are gaining significance. However, they are often more volatile due to capital flow sensitivity and policy interventions.
9.3 Commodity Currencies
Currencies like the Australian Dollar (AUD), Canadian Dollar (CAD), and Norwegian Krone (NOK) move closely with commodity prices, especially oil and metals.
9.4 Geopolitical Tensions
Events such as Brexit, U.S.–China trade wars, and Russia–Ukraine conflict have reshaped forex flows. Safe-haven currencies (USD, CHF, JPY) typically strengthen during uncertainty.
10. Central Bank Interventions and Policy Coordination
Central banks occasionally intervene directly to stabilize or influence their currencies.
For example:
The Bank of Japan has historically intervened to curb excessive yen strength.
The Swiss National Bank (SNB) pegged the CHF to the euro in 2011 to prevent deflation.
Policy coordination among major central banks—like during the 2008 global financial crisis—helps maintain systemic stability and liquidity.
11. The Impact of Globalization and Digitalization
11.1 Global Capital Mobility
Capital flows have become increasingly fluid, allowing investors to move funds across borders instantly. This amplifies both opportunity and risk in forex markets.
11.2 Rise of Digital Currencies
Central Bank Digital Currencies (CBDCs) and cryptocurrencies (like Bitcoin and Ethereum) are introducing new forms of cross-border payments, potentially challenging traditional forex models. While CBDCs may streamline transactions, they also pose questions about exchange rate regimes and monetary sovereignty.
11.3 FinTech Innovations
Mobile trading platforms and blockchain-based settlements have made forex more accessible, transparent, and efficient.
12. Behavioral Aspects of Forex Markets
Trader psychology plays a major role in forex volatility. Herd behavior, overconfidence, and risk aversion influence currency trends.
During market panic, traders rush into safe-haven assets.
In bullish phases, speculative capital flows to high-yielding currencies (carry trades).
Behavioral finance helps explain why forex markets often deviate from pure rational models.
13. Future Outlook and Emerging Trends
13.1 Shift Toward Asia
Asian financial centers (Singapore, Hong Kong, Shanghai) are becoming key forex hubs, reflecting the region’s growing economic influence.
13.2 AI-Driven Trading Ecosystems
Artificial intelligence will further revolutionize trading strategies, offering predictive analytics and real-time decision support.
13.3 Sustainable Finance and Green Currencies
ESG considerations may influence forex as nations align economic policies with sustainability goals. “Green bonds” and carbon-linked currencies could shape future capital flows.
13.4 De-dollarization Trends
Countries are increasingly seeking alternatives to the U.S. dollar for bilateral trade (e.g., yuan–ruble or rupee–dirham settlements). Although gradual, this shift may redefine forex market power balances.
Conclusion
The Forex Market is a complex and dynamic ecosystem driven by macroeconomic fundamentals, central bank policies, geopolitical events, and technological innovation. Its vast scale ensures liquidity and global integration, but also exposes participants to high volatility and systemic risks.
Understanding forex dynamics requires a multidisciplinary approach—combining economics, finance, psychology, and technology. From central banks steering policy to retail traders speculating on short-term moves, every participant contributes to the continuous process of price discovery and capital redistribution.
As globalization evolves and digital transformation accelerates, the forex market will continue to adapt, integrating AI-driven analytics, sustainable finance principles, and new forms of digital currency. Despite its challenges, forex remains the cornerstone of the global financial system—linking economies, facilitating trade, and shaping the world’s monetary landscape.
