Global Economy Shifts1. Multipolarity and the Rebalancing of Global Power
For decades, the global economy operated under a largely unipolar structure led by the United States and its Western allies. Today, this dominance is fading as new economic blocs rise. Emerging markets—most notably China, India, Southeast Asia, the Middle East, and Africa—are becoming engines of global growth.
Rise of Asia
Asia now contributes more than half of global economic growth. China remains the world’s second-largest economy despite slowing growth, while India is emerging as the fastest-growing major economy, driven by demographics, domestic consumption, and digital infrastructure.
Shift Toward Regional Blocs
Increasing geopolitical tensions between the U.S. and China have accelerated the formation of economic blocs:
BRICS+ expansion has brought new resource-rich members.
Regional trade agreements such as RCEP and CPTPP are reshaping Asia-Pacific integration.
The European Union, despite internal challenges, is investing in strategic autonomy, green energy, and advanced manufacturing.
This move toward multipolarity is redefining investment flows, supply chains, and diplomatic alignments.
2. Technological Transformation and the Digital Economy
Technology is the most powerful force reshaping global economic structures. The accelerating adoption of AI, automation, robotics, and digital platforms is altering productivity, labor markets, and competitive advantages.
Artificial Intelligence as a Growth Catalyst
AI is transforming sectors such as finance, healthcare, logistics, and manufacturing. Countries that invest heavily in AI—like the U.S., China, and South Korea—are gaining competitive edges.
Digital Infrastructure Expansion
Digital connectivity has become the backbone of national competitiveness. Innovations such as:
5G and upcoming 6G networks
Cloud computing
Quantum technologies
Blockchain and digital payments
are enabling new business models. Digital public infrastructure (DPI), led by India’s UPI, Aadhaar, and ONDC, is becoming a blueprint for emerging markets.
Techno-Economic Fragmentation
However, technology is also driving global fragmentation:
Competing semiconductor supply chains
Restrictions on data flows
Tech-related sanctions
Global technology standards may split into competing spheres, creating challenges for multinational corporations.
3. Geopolitical Conflicts and De-Risking of Supply Chains
Conflicts such as the Russia–Ukraine war, Middle East instability, and U.S.–China tensions have triggered a significant rethinking of global supply chains.
From Globalization to “De-Risking”
Countries are not fully de-globalizing, but they are diversifying away from single-source dependencies. This has led to:
Nearshoring (e.g., U.S. companies shifting production to Mexico)
Friendshoring (production moving among geopolitical allies)
China+1 strategy (India, Vietnam, Indonesia as beneficiaries)
Resilience Over Efficiency
Companies are prioritizing:
Multi-location manufacturing
Strategic stockpiling
Strengthening logistics networks
Supply chains are becoming more regional and networked, reducing vulnerability to shocks.
4. Green Transition and the Economics of Climate Change
Climate change is reshaping policymaking and investment decisions. Governments and corporations are transitioning toward low-carbon economies, driving structural changes across energy, transportation, manufacturing, and agriculture.
Shift Toward Clean Energy
Renewables—solar, wind, hydro, hydrogen—are experiencing massive investment. Nations like China lead in solar manufacturing, Europe in wind technology, and the Middle East in green hydrogen.
Electric Vehicle (EV) Transformation
EV adoption is accelerating globally, forcing:
Auto companies to redesign supply chains
Battery manufacturers to secure critical mineral sources
Governments to provide subsidies and carbon regulations
Climate-Resilient Infrastructure
Rising temperatures and extreme weather events require substantial investment in resilient infrastructure, influencing fiscal priorities worldwide.
5. Demographic Changes and Labor Market Evolution
Demographics play a critical role in shaping economic potential.
Aging Economies
Developed nations—Japan, South Korea, much of Europe, and even China—face aging populations, shrinking workforces, and rising healthcare burdens. This leads to:
Lower long-term growth
Higher fiscal pressure
Increased need for automation and immigration
Youthful Economies
In contrast, India, Africa, and parts of Southeast Asia have young populations and rapidly urbanizing societies. These countries will be key drivers of global labor supply and consumer demand in coming decades.
Future of Work
Automation and AI will redefine jobs across sectors. While high-skilled workers benefit from rising productivity, low-skilled jobs face displacement. Upskilling, remote work, and gig economy platforms are altering labor structures.
6. Shifts in Global Trade, Currency, and Finance
Global trade patterns are being reshaped by:
Tariffs and trade barriers
Sanctions
New trade agreements
Carbon border taxes
Changing Currency Dynamics
While the U.S. dollar remains dominant, alternative currency arrangements are gaining traction:
BRICS countries exploring settlement in local currencies
Digital currencies and central bank digital currencies (CBDCs)
Bilateral trade agreements bypassing the dollar
Although the dollar’s dominance will not end soon, its relative share is gradually declining.
Capital Flow Reconfiguration
Investments are moving into:
Resilient supply chains
Green energy
Technology hubs
Emerging markets
Sovereign wealth funds, especially from the Middle East, are playing a major role in global capital allocation.
7. Consumer Behavior and Market Transformations
Consumers are shifting their preferences due to technological access, environmental awareness, and rising incomes.
Key trends include:
Increased digital consumption
Demand for sustainable products
Rapid growth of e-commerce and online services
Preference for personalized and subscription-based models
Emerging market middle classes—especially in India, Indonesia, and Africa—are becoming major contributors to global consumption growth.
Conclusion: A Transformative Decade Ahead
The global economy is transitioning through a period of deep structural change. Multipolarity, technological acceleration, shifting demographics, climate imperatives, and geopolitical tensions are transforming how nations trade, innovate, and grow.
The next decade will be defined by adaptability. Countries and companies that invest in technology, diversify supply chains, embrace sustainability, and harness human capital will emerge as winners. As economic power diffuses and the global order evolves, agility and resilience will shape the new world economy.
Community ideas

Emerging Market Impact in the Global Trade Market1. Transformation of Global Demand and Consumption
One of the most significant impacts of emerging markets on global trade comes from their expanding consumer bases. Rising incomes, rapid urbanization, and demographic advantages—particularly in economies like India, Indonesia, and Nigeria—have created massive new markets for global goods and services.
Growing Middle Class
The global middle class has more than doubled since 2000, primarily driven by Asia.
Emerging economies now account for over two-thirds of global consumption growth.
This increasing consumption translates into greater demand for automobiles, electronics, pharmaceuticals, luxury goods, food products, and technology services. For multinational corporations, emerging markets are no longer optional but essential destinations for expansion and long-term growth.
2. Shift in Global Production Centers
The global manufacturing landscape has undergone dramatic shifts, with emerging markets becoming the backbone of global production networks. China led the manufacturing revolution, but other economies—including Vietnam, Bangladesh, India, and Mexico—have followed suit.
Low-Cost Labor Advantage
Emerging markets often provide affordable labor and supportive tax policies, attracting foreign direct investment (FDI) from international firms seeking cost-efficient production hubs.
Rise of New Manufacturing Titans
Vietnam has become a global hub for electronics and textiles.
India is emerging strongly in electronics, pharmaceuticals, and automotive parts.
Mexico benefits significantly from nearshoring trends driven by U.S.-based companies.
This shift has diversified the global supply chain, reducing dependency on single sources and making international trade more resilient and adaptive.
3. Backbone of Global Commodity Trade
Emerging markets play a vital role in both the supply and demand sides of global commodities.
Demand-Side Influence
As developing economies industrialize, their need for:
crude oil
natural gas
steel
copper
agricultural commodities
increases dramatically. China alone has been a major driver of global commodity demand for the last two decades.
Supply-Side Contribution
Many emerging countries are rich in natural resources.
Examples include:
Brazil and Argentina in agriculture
South Africa and Chile in metals and minerals
Indonesia and Malaysia in palm oil
Gulf and African countries in energy resources
The pricing of many global commodities is now significantly influenced by the economic growth patterns of emerging markets.
4. Increasing Role in Global Trade Policies
Emerging markets are becoming more influential in international economic institutions such as the World Trade Organization (WTO), IMF, G20, and regional trade blocs.
Strategic Alliances and Trade Blocs
BRICS (Brazil, Russia, India, China, South Africa)
ASEAN (Association of Southeast Asian Nations)
MERCOSUR in South America
These groups advocate for more balanced trade policies and improved access to developed markets. Their collective bargaining power is reshaping global tariffs, trade agreements, and development frameworks.
5. Digital Transformation and Technology Services
Emerging markets are not just manufacturing hubs; many have become leaders in digital trade and technology services.
India’s IT Dominance
India has become the world’s IT outsourcing leader, supplying software services, cloud solutions, and consulting to major global corporations.
China’s Tech Ecosystem
China’s evolution into a global powerhouse in:
smartphones
e-commerce
artificial intelligence
robotics
has changed the competitive landscape.
Start-Up Ecosystems Rising
Several emerging economies now boast robust start-up ecosystems, including:
Indonesia
Brazil
Nigeria
Vietnam
Their growing digital markets contribute significantly to global e-commerce and fintech trade.
6. Changing Global Supply Chain Dynamics
The pandemic accelerated a realignment of supply chain strategies. Companies began diversifying production away from single-country dependence—a phenomenon known as China+1 strategy.
Winners of Supply Chain Diversification
Vietnam
India
Mexico
Thailand
Malaysia
As multinational firms diversify, emerging markets gain new investments, technology transfers, and increased participation in global trade networks. This shift enhances their economic resilience and strengthens their influence in global trade decisions.
7. Growing Investment Destinations
Emerging markets attract significant foreign direct investment (FDI) due to:
large workforces
improving ease of doing business
competitive production costs
rapid digitalization
Investments in sectors like manufacturing, infrastructure, renewable energy, and technology have fueled growth. In return, these economies are increasingly investing abroad, particularly through:
sovereign wealth funds
multinational corporations
development banks (e.g., China’s Belt & Road Initiative)
This two-way investment flow deepens global trade linkages and accelerates economic integration.
8. Challenges and Vulnerabilities
Despite their growth and influence, emerging markets face structural challenges that affect global trade.
Economic Volatility
These economies are more vulnerable to:
currency fluctuations
inflation cycles
commodity price swings
debt stress
Global economic slowdowns disproportionately impact emerging markets.
Infrastructure Gaps
Inadequate infrastructure in ports, logistics, power supply, and digital connectivity can limit trade efficiency.
Political and Policy Risks
Trade policies, regulatory changes, and geopolitical tensions can create uncertainty for investors and trading partners.
Yet despite these challenges, their overall trajectory continues upward.
9. Geopolitical Influence and Realignment
Emerging markets now play major roles in global geopolitics, influencing trade corridors, energy routes, and investment flows. China’s Belt and Road Initiative (BRI), India’s Act East Policy, and regional trade blocs show a growing desire for strategic autonomy.
These geopolitical realignments have reshaped:
maritime trade routes
infrastructure development
cross-border connectivity
As emerging markets grow stronger, their geopolitical strategies directly impact global trade patterns.
10. Future Outlook: The Next Phase of Global Trade
In the coming decade, emerging markets are expected to contribute nearly 60–65% of global GDP growth. Their rise will further influence:
Key Trends
Expansion of digital trade and fintech
Green energy transitions leading new commodity markets
Growing influence in global governance institutions
Greater regional trade integration
Increased innovation and technological adoption
Emerging markets are not just participants—they are becoming architects of the future global trade system.
Conclusion
Emerging markets have fundamentally reshaped the global trade landscape. From driving consumption growth and diversifying production hubs to influencing commodity markets and trade policies, these economies are now critical pillars of global economic architecture. While challenges remain, their increasing economic integration, expanding middle class, rapid digitalization, and strategic geopolitical influence position them as the key engines of global trade in the decades ahead.
BRICS Thriving in the Global Market1. Economic Powerhouse: The Growing Weight of BRICS
BRICS nations collectively account for:
~45% of the world’s population
~36% of global GDP (PPP terms)
Over 30% of global energy supply
More than 25% of global exports
This economic heft gives the bloc a powerful edge in global markets. China and India alone are among the world’s top three economies (PPP), contributing significantly to global consumption and manufacturing.
Diverse Economic Strengths
Each BRICS nation contributes uniquely:
China remains the world’s manufacturing hub.
India is a technology and services powerhouse.
Brazil dominates agricultural exports—soybeans, beef, sugar.
Russia is a global leader in oil, gas, and defence.
South Africa is rich in minerals and precious metals.
Saudi Arabia & UAE bring capital and strategic energy influence.
Iran adds geopolitical depth and massive energy reserves.
Egypt & Ethiopia boost African connectivity and demographic momentum.
This diversity allows BRICS to remain resilient amid global disruptions, creating a balanced ecosystem that strengthens intra-bloc cooperation.
2. Trade Expansion: Intra-BRICS and Global Influence
BRICS countries are rapidly expanding trade ties among themselves to reduce dependence on Western markets. China’s trade with BRICS partners has surged, while India has significantly increased exports to Brazil, Russia, and Middle Eastern BRICS members.
Key Factors Driving BRICS Trade Growth
a) Complementary Economies
China and India require energy → Russia, Saudi Arabia, Iran supply it.
Brazil’s agricultural exports feed Asia.
Africa’s mineral wealth fuels global industrial supply chains.
This interdependence strengthens BRICS’ internal trade network.
b) Reduced Trade Barriers
Countries are increasingly settling trade in local currencies rather than the U.S. dollar, reducing currency volatility and sanctions exposure.
c) Shift in Global Supply Chains
The “China+1” and “China+2” strategies have allowed India, Brazil, and others to attract manufacturing investments as global firms diversify.
3. Financial Resilience: BRICS Challenging the Western Banking System
One of the strongest signs of BRICS thriving in the global market is the growing independence from Western-dominated financial structures.
The New Development Bank (NDB)
Founded in 2014, the NDB finances infrastructure and sustainable projects across member countries. It has approved billions in funding and aims to rival institutions like the World Bank.
Local Currency Settlements
Countries like India, Russia, and China are increasingly settling trade in:
Indian Rupee (INR)
Chinese Yuan (CNY)
Russian Ruble (RUB)
This reduces dollar dependency and creates a more stable financial ecosystem.
Rise of Yuan in Global Trade
With China’s vast trade network, the Yuan has become a preferred settlement currency in Asia, Middle East, and parts of Africa—indicating the financial reach of BRICS nations.
4. Energy Dominance: A Core Strength of BRICS
Energy-rich BRICS members—Russia, Saudi Arabia, Iran, Brazil—have reshaped global oil and gas markets.
Why Energy Gives BRICS Global Power
They control over 40% of the world’s oil production.
They significantly influence OPEC+ decisions.
Asian demand for energy gives the bloc leverage.
Energy trade in local currencies challenges petrodollar dominance.
This energy ecosystem further strengthens BRICS economic integration.
5. Technological and Digital Growth: The New Engine of BRICS
Technology and digital infrastructure are crucial for modern economic dominance. BRICS nations, especially China and India, are leading in several key areas:
a) Digital Payments
India’s UPI has become a global model.
Brazil’s PIX and China’s WeChat Pay dominate domestic markets.
b) Artificial Intelligence & Semiconductors
China is a global AI leader; India is emerging as a major chip-design hub.
c) Space Technology
India, China, and Brazil have advanced space programs that boost telecom, navigation, and climate research.
d) 5G and Future Tech
China’s Huawei leads global telecom infrastructure development, especially in Africa and Asia.
BRICS nations are not just consumers of technology—they are innovators and exporters, enhancing their global market competitiveness.
6. Geopolitical Influence: BRICS as a Multipolar Power Center
The growth of BRICS is inherently tied to the global shift away from unipolarity. With the West and emerging economies diverging in priorities, BRICS offers an alternative global governance model.
Geopolitical Strengths of BRICS
Represents major regional powers across Asia, Africa, Middle East, South America.
Coordinates policies on global issues like climate, development, and trade.
Provides a counterweight to NATO, G7, and Western-led financial institutions.
The expansion of BRICS signals its rising diplomatic and strategic relevance.
7. Global South Leadership: BRICS as a Voice for Developing Nations
A major reason BRICS is thriving is its role as the champion of the Global South.
Key roles include:
Promoting fairer global trade rules.
Improving access to development finance.
Supporting infrastructure development across Africa & Asia.
Challenging Western dominance in global decision-making.
As inequality between developed and developing countries rises, BRICS becomes a preferred platform for emerging economies.
8. Future Outlook: Can BRICS Redefine Global Markets?
The momentum behind BRICS is strong, but the future will depend on:
Deepening financial integration.
Improving trade logistics.
Balancing China–India competition.
Leveraging energy dominance responsibly.
Expanding technological cooperation.
If successful, BRICS could become the largest economic bloc in the world by 2035, shaping global trade, currencies, and geopolitics.
Conclusion
BRICS is thriving in the global market due to its massive population, resource wealth, rapid digital growth, rising financial independence, and strategic geopolitical influence. As the world transitions toward a multipolar era, BRICS nations are not only shaping global trade but also redefining the economic and political architecture of the 21st century. With expanding membership, growing economic interdependence, and increasing relevance in global governance, BRICS is poised to become one of the most powerful alliances in the decades ahead.

Understanding Forex Money Flow: Risk-on & Risk-offWhen it comes to Forex, most traders focus on technicals, chart patterns, or indicators. But “money flow” — the force that truly moves price — is often overlooked. If you want to read the market like a pro, you must understand Risk-on and Risk-off: the two sentiment states that drive global capital.
Today, let’s break them down clearly, practically, and in a way you can apply immediately.
🔥 What Is Risk-on?
“Risk-on” appears when the market is optimistic, investors seek risk, and money flows strongly into high-return assets.
Signals of a Risk-on Environment:
Strong stock market rallies
Capital shifts into riskier assets
Bond yields rise
Positive economic news or geopolitical easing
Assets That Benefit in Forex:
AUD, NZD, CAD (commodity currencies)
GBP, EUR (when the economy is stable)
Bitcoin, oil, and equities also tend to rise
Risk-on = “The market is excited → money flows into high-yield assets”.
💥 What Is Risk-off?
“Risk-off” occurs when the market fears uncertainty, causing money to move toward safe-haven assets.
Signals of a Risk-off Environment:
Stock markets fall sharply
Money exits risky assets
Gold spikes
USD and JPY strengthen
Negative economic news, war, inflation, or political instability
Assets That Benefit in Forex:
USD, JPY, CHF
Gold (XAUUSD)
U.S. government bonds
Risk-off = “The market is scared → money runs to safety”.
❓ Why Forex Traders MUST Understand Risk-on / Risk-off
No matter what indicator you use, the market ultimately reacts to major capital flow.
Understanding these two states helps you:
Trade with market sentiment → dramatically increases win rate
Avoid entering trades against the money flow → fewer “pointless stop-loss hits”
Identify strong/weak currencies → choose high-probability setups
Many perfect technical setups fail simply because they go against global money flow.
📌 How to Apply This Immediately in Your Forex Trading
1. Check the News → Identify Sentiment
Good news? Strong GDP? Stable markets? → Risk-on
Bad news? War? Inflation? Hawkish Fed? → Risk-off
2. Compare Currency Strength
Simple formula:
Risk-on → prioritize BUY AUD, NZD, CAD
Risk-off → prioritize BUY USD, JPY, CHF
3. Follow the Trend — Avoid Fighting Money Flow
The strongest trends often come from shifts between Risk-on and Risk-off.
Examples:
Bad news → JPY strengthens → XXXJPY pairs fall hard
Risk-on returns → USD weakens → gold rises quickly
Follow the money flow, and you’re already ahead of 80% of traders.
🧠 Conclusion – If You Want to Trade Smart, Trade With the Money Flow
Risk-on and Risk-off aren’t just theory — they’re the compass that reveals market psychology, which is the foundation of every trend.
Want to trade like Smart Money?
→ Watch where the money is moving, not just where the candles are going.

Why Retailers lose 90%? Smart Money doesn't allow to follow!Hello. If you’re curious about trading or you’ve tried to beat the markets ? Think what smart money has been doing again and again.
Disclaimer:
This post is dedicated solely to educational content and community-driven insights. All information shared here—including strategies, trade setups, and opinions—are for informational purposes only and should not be considered as financial, investment, or trading advice.
Viewers are solely responsible for their own investment decisions.
Trading and investing in financial markets involve risk, and the channel will not be held responsible for any losses or damages incurred as a result of actions taken based on the content presented.
Please consult with a qualified financial advisor before making any investment decisions.
In this post you will learn:
1. How to read price action, not just indicators.
2. How to follow the smart money, not the crowd.
3. Real statistics, live examples, and honest warnings. The discipline needed to turn a trading account into long-lasting wealth.
4. If you’re ready to stop searching for shortcuts and finally learn what works from first principles, understand this post.
Let’s begin at the root: What is trading?
It is the act of buying and selling financial instruments, like stocks, currencies, commodities, or derivatives, with the sole aim of making a profit which has the ability to impact the economy of a country is now accessible to anyone with a mobile phone.
You might wonder, how does trading influence an entire economy?
Trading adds massive liquidity to financial markets, allows companies to raise capital for expansion, and lets investors participate in a country’s growth story. However, wild or speculative trading can sometimes trigger volatility, even a crisis, impacting jobs and industries across the economy.
So when it is available to everyone, why do Most Fail? Why It’s Not for Everyone?
Here’s the catch — trading isn’t everyone’s cup of tea. Statistics are brutal: Nearly 90% of retail traders lose money over time. Only about 10% manage to survive, and an even smaller fraction thrives long-term. So, if you’re looking for an easy way out or quick money, trading might not be for you.
Honestly, if you want guaranteed results and dislike uncertainty, it’s better to focus your energy elsewhere — that’s the hard truth.
At the same time, Who Thrives in Trading?
It is one of the toughest jobs in the world — tougher than rocket science or open-heart surgery, because here, the enemy is your own psychology. Those who succeed have discipline, patience, and adaptability. If that excites you, then let’s continue.
Moving forward, Why Most Retail Traders Lose?
Let’s talk about indicators and patterns. Have you ever wondered why there’s a flood of free tools online, each claiming to unlock profits? If these tools worked, wouldn’t everyone be rich? The harsh reality is Big institutions and banks have the resource to track all algorithms and setups of every petty retailer. Indicators are often designed to manipulate the masses, helping big players—smart money—feed off smaller, retail traders. Most of these strategies look good on paper, but fail miserably upto 50% in real trades.
Let me explain further with A Live Example: How Smart Money Profits from Retailers:
Whenever retail traders enter a popular selling zone, their collective stop losses are clustered just above that zone. The smart money—hedge funds and institutional players—can see these clusters. Smart money already has the expertise and resources to track down the cluster of stop losses. They push the price up briefly, either by buying pressure or hedging, triggering retail stop losses and buying those positions at a discount. The losing retail traders exit in panic, while the smart money enjoys the rebound.
So, the common man’s entry price often becomes the rich man’s exit, and the provider of liquidity is the one who loses.
Thus, The Statistics emphasise on Rich Get Richer, Poor Get Poorer.
Statistics don’t lie. The top 1% of traders control over 80% of the wealth because they understand market psychology, price action, and institutional flow. Most retail traders keep chasing easy profits, only to end up as “fuel” for the professionals. The famous saying, “In trading, money flows from the impatient to the patient,” is very real.
In all these circumstances, Can Retail Traders Ever Win?
Is there any hope for retailers to win consistently? Yes, but only with the right approach!
Forget about magic indicators, secret patterns, or the latest news flash—institutions can manipulate all that. But there’s one thing nobody can manipulate: price itself.
Stop chasing the crowd, imagine them as a school of fish. Instead, hug the belly of the big sharks—blend in with institutional flow and study pure price action.
Why Price Action is King?
Why trust price action? Because price is the total of every force—news, sentiment, manipulation, and truly valuable information. If you can read the footprints left by smart money, you’ll stop getting tricked by the bread crumbs distributed to unsuspecting retailers.
Stop losses of retailers are literally profits for institutions. A retailer’s entry, without proper analysis, often becomes a signal for big players to do the opposite. Follow price—not noise.
Drop a comment sharing your own trading journey, mistakes, or burning questions.

Smart Money Liquidity Trap Explained⭐ Smart Money Liquidity Trap Explained
✨ A deep dive into how institutions manipulate price before major moves ✨
In every financial market — Forex, Crypto, Stocks, Indices — price doesn’t simply move at random. Behind the scenes, Smart Money (institutions, banks, hedge funds) engineer setups that allow them to enter positions at the best possible price. One of their most effective tools is the Liquidity Trap.
Let’s break it down beautifully and clearly. 👇
🔥 What Is a Liquidity Trap?
A Liquidity Trap occurs when Smart Money deliberately pushes price into areas loaded with:
❌ Stop-loss orders
📉 Sell-side liquidity
📈 Buy-side liquidity
😰 Emotional retail entries
🔥 Breakout traders placing pending orders
These areas become liquidity pools — perfect fuel for institutions to fill their massive positions.
Retail traders think it’s a breakout…
But Smart Money thinks:
➡️ "Thank you for the liquidity."
🧩 How Smart Money Creates the Trap
1️⃣ Phase 1: Build the Setup
Smart Money guides price slowly toward an obvious level:
A clean high
A clean low
A trendline
A double top/bottom
Retail traders get excited:
📢 “Breakout coming!”
But institutions are simply gathering attention.
2️⃣ Phase 2: The Liquidity Grab ⚡
Price spikes violently above/below the obvious level.
This move triggers:
🟥 Stop-loss hunts
📉 Forced liquidations
💥 Breakouts that fail instantly
This sudden spike gives institutions the liquidity needed to place large buy or sell orders without causing massive slippage.
This is why the spike is often fast and dramatic.
3️⃣ Phase 3: The Real Move Begins 🚀
After the liquidity is collected, price reverses sharply.
This is the moment Smart Money actually commits to the real direction.
Retail traders feel:
🤯 “Why did it reverse?!”
😭 “I got stopped out for nothing!”
😵 “The breakout was fake!”
But Smart Money simply executed their strategy perfectly.
🎯 How to Use Liquidity Traps in Your Trading
Study where retail traders commonly place:
⛔ Stops
📌 Breakout orders
❗ Predictable entries
Then wait for the fast liquidity grab followed by:
A displacement 🎇
A sharp wick rejection
A structure shift (CHoCH / BOS)
These signals often reveal the true direction of the upcoming move.
💡 Key Features of a Smart Money Liquidity Trap
✨ Sudden spike into obvious areas
✨ Fast liquidation and stop-hunting behavior
✨ Sharp wick rejections
✨ Structure shift after the spike
✨ Smooth continuation in the real direction
🚀 Why This Concept Is So Powerful
Recognizing liquidity traps allows you to:
❌ Avoid fake breakouts
🛡️ Protect yourself from stop-hunts
🎯 Enter the market at premium/discount levels
🤝 Align with Smart Money
💼 Improve long-term consistency
This is how professional traders stay on the right side of volatility — by understanding why the market moves, not just where it moves.
Liquidity Hunt: How Whales Move the MarketEver wonder why prices always seem to drop just below your stop loss before bouncing back? It’s not bad luck; it’s liquidity in action. The big players are prowling, hunting for stops, and if you don't understand where they’re lurking, you might just be their next target. Liquidity definition refers to how easily an asset can be bought or sold without significantly affecting its price, and in the world of crypto, this dynamic can make or break your trade. Let’s dig into how these whales work the market and how you can avoid becoming their prey.
What is Liquidity?
Liquidity meaning refers to how easily an asset can be bought or sold without affecting its price. In the context of crypto, it's crucial to know that high liquidity means less slippage, while low liquidity can lead to sharp price moves. Market liquidity is essential for smooth trading, but it also creates opportunities for big players to manipulate price action by targeting stop losses.
Liquidity Risk and Big Players
Liquidity risk arises when there's not enough liquidity to execute trades efficiently, especially during volatile periods. Big players exploit these conditions by pushing prices through key support and resistance levels, triggering stop orders and capturing liquidity. This is why it’s vital to be aware of where liquidity is concentrated — big players often target areas with many stop losses, trapping retail traders in the process.
Tools to Analyze Liquidity
Volume Indicators: Use tools like Accumulation/Distribution or On-Balance Volume (OBV) to spot surges in volume that may indicate manipulation or big players entering the market.
Bitcoin Liquidity Heatmap: A Bitcoin liquidity heatmap shows where large buy and sell orders are placed, helping you avoid areas where liquidity is likely to be targeted by whales.
Liquidity Ratio Formula: Another great tool which helps measure market depth and liquidity. You can calculate it as:
A higher ratio indicates that there is more buying pressure, suggesting the market is more liquid and less prone to manipulation. On the other hand, a lower ratio signals more sell orders, which could expose you to increased liquidity risk and higher chances of price manipulation by big players.
Price Action: Watch for candlestick patterns like pin bars or engulfing candles near key support or resistance levels to anticipate price reversals after stop hunts.
Conclusion
While tools like volume indicators and Bitcoin liquidity heatmaps can help, always stay vigilant. Use wider stop losses to avoid getting trapped at key levels, and stay cautious during periods of low liquidity when whales are most active. This article isn’t trading advice — always DYOR and trade responsibly.

Why Markets Struggle After a Big Drop (NASDAQ Case Study)Understanding liquidity, distribution phases and market-maker behavior
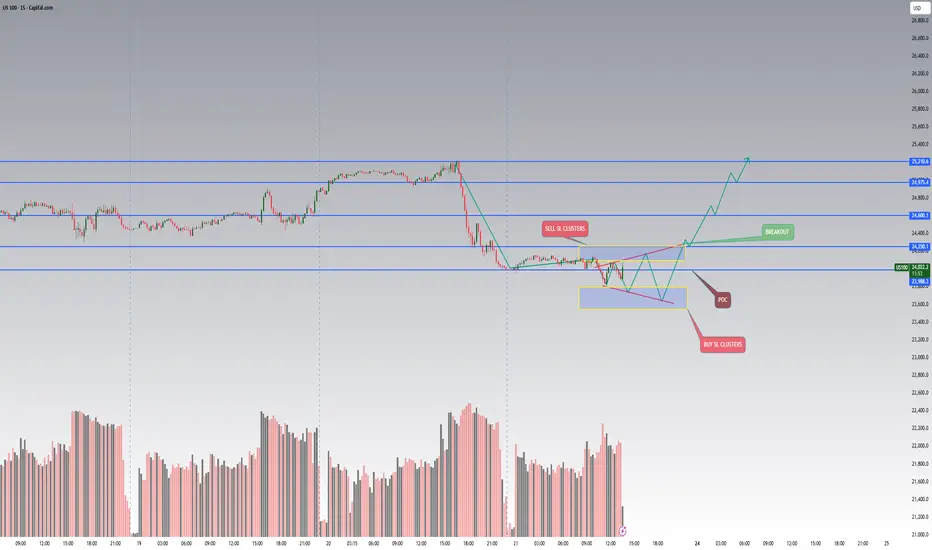
After the NASDAQ fell sharply from 25 000 to 24 000, many traders were surprised why the market suddenly stopped moving and started to “chop” around the same area.
But this behavior is not random — it’s a structural problem inside the order-flow.
1️⃣ Markets can fall fast — but they cannot continue without liquidity
Every trade in the market has a counter-party.
If traders want to buy the dip, someone must sell to them.
After a large drop, fewer participants are willing to sell at the new low prices.
Institutions are often already hedged or already sold during the fall.
Market makers cannot force liquidity out of thin air — they must create it.
This leads to a distribution phase, where price stops trending and starts rotating around a key area.
2️⃣ Why distribution forms around the Point of Control (POC)
When aggressive hedging is finished and volatility slows down, the market enters a phase where:
Price rotates around the Point of Control (POC)
Volume increases
Market makers attempt to rebuild liquidity on both sides of the range
This is not accumulation or re-accumulation — it is a liquidity-engineering phase.
Market makers need enough:
Buy-side liquidity above POC (stop losses of shorts, breakout traders, trapped buyers)
Sell-side liquidity below POC (stop losses of longs, late dip-buyers, liquidation clusters)
Without these pools, the market cannot initiate the next impulsive move.
3️⃣ The problem with sell-side liquidity after a big fall
When NAS dropped from 25k → 24k:
Most weak longs were already liquidated
Many sellers closed positions or took profit
Fresh shorts hesitate to enter at the lows
Institutions are waiting for better prices
This creates a liquidity vacuum.
To solve this vacuum, the market “mirrors” trades inside the range:
Price moves up → build stops above
Price moves down → build stops below
Repeated sweeps → fill both sides of liquidity
Only after enough stop-loss clusters form, the market is capable of moving again with real momentum.
4️⃣ What this means for traders
This is not a buy or sell signal.
It’s an explanation of why the market becomes extremely slow, sideways or manipulative after a big impulsive move.
In this phase:
Breakouts usually fail
Trend trading performs poorly
Range traps occur frequently
Market reacts strongly to liquidity pockets, not fundamentals
The key is to understand what the market is missing:
➡️ Not direction.
➡️ Not fundamentals.
➡️ But liquidity.
Until the liquidity pools are recreated, the next real directional move cannot start.
5️⃣ Final takeaway
A strong decline does not end because “buyers step in.”
It ends because no more sellers exist at those levels, forcing market makers to rotate price and rebuild the order-book.
Learning to identify these liquidity-reset periods helps traders avoid:
Chasing breakouts
Entering too early
Getting trapped during fake momentum
Misreading sideways distribution as a reversal
Inverse Head & Shoulders on USDJPY (Quarterly Chart)Japanese yen is pretty technical on the charts
Its very good for education
This time I spotted for you a textbook
Giant Inverse Head & Shoulders reversal bullish pattern
It was built at the bottom of the move with three consecutive troughs
with the deepest in the middle called the Head and the side parts called the Shoulders
The dotted trendline connecting the peaks of the inverted Head is the Neckline
The latter is a key barrier for the bullish trigger
Price broke above it in 2022 and quickly pushed beyond the 151 level
Then a classic textbook pullback unfolded to accurately retest the broken Neckline
After that price resumed its uptrend to test the crucial resistance at 160.40
built from the peak of distant 1990!
It was a die hard barrier as price was rejected and fell back into the 140 area
And now again we are heading to retest that solid barrier
Back to the pattern
The target for the Inverse Head & Shoulders is set at the depth of the Head
Neckline minus Heads bottom added to the Neckline
It is located at 174 a potential gain of a whopping 11 percent
Price should stay above the Neckline beyond 127 before reaching the target
otherwise the pattern becomes invalidated
And if we zoom in you can see a wide empty space without strong barriers
until price hits the next major resistance at 277.79 the peak of the 80s
That means JPY could lose almost 73 percent of its value to USD

Spot + Hedge — The Fundamental Framework for Investors Who TradeYou don’t have to treat holding and trading as two separate worlds. The most effective market participants combine both. They anchor their strategy in long-term conviction while using short-term tools to manage volatility and protect capital. This balance allows them to participate in structural growth without exposing their portfolio to unnecessary drawdowns.
Spot holdings are the foundation. A well-built spot position compounds through cycles, absorbs volatility, and benefits from every wave of adoption that pushes the market forward. Staking adds an additional layer by generating yield during periods of consolidation. For traders who think in cycles rather than days, spot is the engine that keeps building value in the background.
A hedge position serves a different purpose. It is not designed for aggressive speculation. It is a tactical layer that reduces exposure when conditions become unstable. Futures shorts, when sized properly, act as a defensive tool that preserves the value of your long-term assets without forcing you to sell them. This approach keeps you invested while giving you room to breathe during sharp corrections.
When hedging makes sense:
– After a strong rally pushing into major resistance levels.
– When funding rates are extremely positive and the market is crowded with leveraged longs.
– When macro data shifts, liquidity tightens, or a regulatory event increases uncertainty.
– When your portfolio has grown significantly and you want to lock in part of that increase without taking profits.
The purpose of the hedge is stability. You are not aiming to turn the short into a profit engine. You are using it as portfolio insurance. A well-timed hedge limits the damage during pullbacks and keeps you positioned for the next leg of the cycle.
Simple implementation example: assume you hold $20,000 of ETH spot as your long-term allocation. To hedge, you short 25–30 percent of the position using ETH perpetual contracts. If ETH drops 10 percent, the hedge cushions the downside by generating gains on the short. If ETH continues rising, your spot position captures the upside and the hedge becomes the cost of protection, similar to an insurance premium.
This framework helps traders stay in the market, avoid emotional exits, and preserve capital during volatile periods. It combines conviction with discipline and gives long-term holders a practical way to navigate uncertainty without breaking their overall strategy.

ESG & Green Energy Investments1. What ESG Actually Means
ESG refers to a set of standards for evaluating how responsibly and sustainably a company operates. These three dimensions—Environmental, Social, and Governance—serve as a framework to understand non-financial risks that can influence long-term performance.
Environmental (E)
Focuses on how a company interacts with the natural world. Key considerations include:
Carbon emissions and net-zero commitments
Renewable energy usage
Waste management and circular economy practices
Water conservation
Pollution control
Biodiversity impact
Companies that manage environmental risks well are better positioned for regulatory changes, resource scarcity, and the transition to a low-carbon economy.
Social (S)
Covers how a company manages relationships with employees, suppliers, customers, and communities. Factors include:
Labor standards and worker welfare
Diversity and inclusion
Human rights compliance
Customer safety
Community development
Data privacy and cyber security
Strong social practices improve productivity, reduce legal risks, and enhance brand value.
Governance (G)
Refers to corporate leadership and internal controls. Key governance metrics include:
Board independence and diversity
Executive compensation
Anti-corruption policies
Shareholder rights
Ethical conduct
Transparency and accountability
Good governance reduces fraud, mismanagement, and regulatory penalties—factors that directly influence shareholder returns.
2. Why ESG Matters for Investors
There are several reasons why ESG has become integral to investment decision-making:
a. Risk Mitigation
Companies with strong ESG profiles tend to face fewer controversies, regulatory penalties, or reputational setbacks. Climate-related risks—such as extreme weather, carbon taxes, and energy transition timelines—now directly influence asset prices.
b. Superior Financial Performance
Numerous studies show that companies with strong ESG adherence have:
Lower capital costs
Higher operational efficiency
Better long-term profitability
More stable cash flows
Investors increasingly see ESG not as a cost but as a value-creation strategy.
c. Growing Global Regulations
Governments worldwide are mandating sustainability reporting and emissions reduction, pushing ESG integration into standard business practice. For example, the EU’s Corporate Sustainability Reporting Directive (CSRD) and India’s BRSR framework compel listed companies to disclose ESG metrics.
d. Institutional Investor Influence
Pension funds, sovereign wealth funds, insurance companies, and large asset managers now screen investments using ESG criteria. Their portfolios are shifting toward green sectors, influencing global capital flows.
e. Consumer and Market Sentiment
Consumers prefer companies aligned with sustainability. Firms with strong ESG profiles often benefit from brand loyalty and long-term demand stability.
3. Green Energy Investments: The Core of the ESG Transition
Green energy investments refer to capital allocated to renewable and sustainable energy sources such as:
Solar
Wind
Hydro
Geothermal
Biomass
Green hydrogen
Energy storage solutions
Carbon capture and renewable fuels
The energy transition is accelerating as the world moves away from fossil fuels. Several forces drive this shift:
a. Climate Change Imperatives
Global warming concerns and carbon reduction targets under the Paris Agreement have pushed governments to accelerate renewable energy adoption.
b. Declining Renewable Costs
Technology advancements and economies of scale have drastically reduced the cost per unit of solar and wind power, making them competitive with coal and natural gas.
c. Technological Breakthroughs
Innovations in battery storage, smart grids, electric mobility, and green hydrogen are reshaping the energy sector and creating massive investment opportunities.
d. Corporate Clean Energy Demand
Tech giants, manufacturing companies, and industrial firms are increasingly committing to 100% renewable energy to meet ESG goals.
4. Key Green Energy Investment Themes
1. Solar Energy
Solar remains the fastest-growing renewable sector due to falling panel prices and rising adoption across households, industries, and grid-scale plants. Rooftop solar, floating solar, and utility-scale installations represent major avenues for investors.
2. Wind Energy
Both onshore and offshore wind offer strong long-term growth, with offshore wind emerging as a trillion-dollar market driven by advanced turbine designs and coastal infrastructure investment.
3. Green Hydrogen
Seen as the "fuel of the future," green hydrogen can decarbonize heavy industries like steel, chemicals, and shipping. Massive government subsidies globally are accelerating the sector.
4. Electric Vehicles & Charging Infrastructure
EV adoption is surging, supported by clean energy policies and consumer demand. Charging networks, battery manufacturing, and EV components represent high-potential themes.
5. Energy Storage
As renewable usage increases, storage becomes essential to stabilize grids. Lithium-ion batteries, solid-state batteries, and flow batteries are attracting significant investment.
6. Carbon Capture & Utilization
Companies are developing carbon removal technologies to meet net-zero mandates. This includes direct air capture, storage, and carbon-to-fuels technologies.
5. ESG Investing Strategies
Investors approach ESG in several structured ways:
a. Negative Screening
Excluding harmful sectors such as:
Tobacco
Weapons
Coal
Oil & gas
Gambling
Alcohol
b. Positive Screening
Selecting companies with strong ESG scores or leadership in sustainability practices.
c. ESG Integration
Embedding ESG factors into fundamental financial analysis to improve risk-adjusted return potential.
d. Thematic Investing
Focusing on themes such as renewable energy, clean technology, water conservation, electric vehicles, or circular economy.
e. Impact Investing
Investing specifically to achieve measurable social or environmental outcomes alongside financial returns.
f. Best-in-Class Approach
Investing in industry leaders with the highest ESG performance within their sector.
6. Benefits of ESG & Green Energy Investing
Lower long-term risks
Increased portfolio resilience
Exposure to fast-growing sectors
Regulatory advantages
Improved brand value and stakeholder trust
Alignment with global sustainability goals
Potential for long-term outperformance
7. Challenges and Concerns
While ESG investing is powerful, it is not without challenges:
1. Greenwashing
Some companies exaggerate ESG claims without genuine action. Investors must verify data authenticity.
2. Lack of Standardization
Different ESG rating agencies use different methodologies, creating inconsistencies.
3. Short-Term Costs
Sustainability investments often require high upfront capital.
4. Policy Uncertainties
Changes in government regulations can influence renewable project viability.
8. The Future of ESG & Green Energy Investments
The future is characterized by:
Stricter sustainability regulations
Growth of carbon markets
Increased corporate and investor accountability
Scaling of green hydrogen and storage technologies
AI-driven ESG analytics
Trillions of dollars flowing into the global energy transition
ESG and green energy investments are expected to dominate global markets for decades as climate change, technological innovation, and policy support reshape the global financial landscape.

Derivatives & Options Trading Trends1. Rising Retail Participation and Democratization of Derivatives
One of the most significant trends is the rapid increase in retail participation, especially in markets like India, the U.S., and parts of Asia. Platforms such as Robinhood, Zerodha, Upstox, and Interactive Brokers have made derivatives trading more accessible by offering low-cost or zero-brokerage models, simplified interfaces, and educational tools.
In India, index options volumes on NSE have surged to record highs, driven by weekly and even daily options expiries. Retail traders now actively participate in directional and non-directional strategies including spreads, straddles, strangles, and intraday scalping. Because of lower margin requirements and high leverage, derivatives have become an attractive entry point for younger traders.
This democratization comes with both opportunities and risks. While broader participation enhances market depth and liquidity, it also increases systemic concerns around over-leverage, herd behaviour, and inadequate understanding of derivatives mechanics.
2. Explosive Growth of Weekly and Short-Dated Options
Short-tenor options—weekly, daily, and even zero-day options (0DTE)—have become a global phenomenon. The U.S. S&P 500 Index (SPX) now sees major volumes in 0DTE options, favoured by traders for intraday speculation, gamma exposure, and event-driven strategies.
Similarly, in India, weekly Bank Nifty and Nifty expiries have turned into some of the most traded options worldwide. Traders prefer these contracts for:
Lower premiums
Quick payoff realization
High volatility leading to strong intraday movements
Flexibility to align with macro events (Fed decisions, CPI data, RBI policy, earnings, etc.)
Short-dated options have reshaped intraday volatility patterns, with large swings near expiry due to gamma effects and dealer hedging flows.
3. The Era of Algorithmic and Quantitative Trading in Derivatives
Quantitative models and algorithmic trading systems now dominate global derivatives markets. Hedge funds, proprietary desks, and even retail quants increasingly use:
Market-neutral strategies
Volatility arbitrage
High-frequency scalping
Options-based hedging
Gamma and vega-weighted portfolios
Machine-learning-driven directional trades
In India, algo penetration in derivatives has increased dramatically after regulatory approvals for API-based trading. Low-latency systems allow quants to execute thousands of trades per second, exploiting micro-imbalances, liquidity pockets, and implied-volatility mispricings.
Algo trading is particularly influential in options markets, where pricing inefficiencies emerge frequently due to time decay and volatility shifts.
4. Surge in Volatility Trading and Volatility Derivatives
A major global trend is the rise of volatility as an asset class. Traders now actively trade volatility, not just price direction, through:
VIX futures and options
Implied volatility strategies (IV crush, IV expansion)
Calendar spreads
Vega-neutral portfolios
Volatility arbitrage between indices and individual stocks
During major macro events—geopolitical shocks, central bank decisions, inflation releases—volatility spikes create large opportunities for professional traders.
The global appetite for volatility exposure reflects increasing macro uncertainty in markets shaped by inflation cycles, geopolitical risks, and policy unpredictability.
5. Growing Popularity of Exotic Options and Structured Derivatives
Beyond standard call and put options, demand is rising for exotic derivatives, especially among institutions. These include:
Barrier options
Asian options
Binary options
Lookback options
Range accrual derivatives
Digital payoff structures
Structured product desks in banks use these derivatives to offer tailored risk-return solutions to corporate treasuries, high-net-worth individuals, and offshore investors.
In equity derivatives, structured notes like autocallables are gaining traction globally, especially in European and East Asian markets.
6. Commodities and Currency Derivatives: A Renewed Focus
Commodity and currency derivatives have seen renewed interest due to global supply chain disruptions, geopolitical instability, and inflation pressures.
Key Drivers:
Oil price volatility due to Middle East conflicts
Agricultural supply shocks
Currency fluctuations driven by monetary policy divergence
Rising importance of hedging for import- and export-dependent industries
In India, the launch of new currency derivatives and increased retail interest in crude oil and natural gas options have broadened the market.
7. Interest Rate Derivatives and the Post-Rate-Hike World
As central banks oscillate between tightening and easing cycles, interest rate derivatives (IRDs) such as swaps, futures, and swaptions have gained remarkable importance.
Key themes include:
Hedging long-term debt exposure
Speculation on rate paths
Positioning around government bond yield movements
Managing duration risk for institutional investors
The pricing of interest rate options is now heavily influenced by inflation expectations, forward guidance, and global economic conditions.
8. Regulation, Risk Control & Margining Reforms
Global regulators have tightened rules around derivative trading to ensure transparency and reduce systemic risk. Major reforms include:
Mandatory margining for futures and options
Upfront collection of SPAN + Exposure margin
Position limits for retail participants
Greater disclosures for brokers and exchanges
Risk-based levies on high-frequency trading
Banning of certain high-risk derivatives for retail in some regions
In India, peak margin rules and tightened risk controls have significantly changed intraday derivatives strategies, reducing excessive leverage.
9. Rise of Data-Driven Decision Making
Modern derivatives traders rely heavily on:
Real-time order book analytics
Option Greeks monitoring systems
Volatility surface modelling
Big-data sentiment indicators
AI-driven predictive models
Access to sophisticated analytics platforms—Sensibull, Opstra, TradingView, Bloomberg, Reuters, and broker-provided tools—helps even retail traders adopt institution-grade analysis.
10. Shift Toward Multi-Asset Derivative Strategies
Markets are becoming increasingly interconnected. Traders now prefer multi-asset strategies that combine:
Equity + Currency
Equity + Commodity
Interest Rate + Currency
Options + Futures
Cross-country derivatives
These hybrid strategies help hedge correlated risks and exploit arbitrage opportunities across markets.
Conclusion
Derivatives and options trading are undergoing a profound transformation driven by retail participation, technological advancement, algorithmic dominance, volatility-focused strategies, and regulatory shifts. Markets are faster, more interconnected, and more complex than ever before. Whether used for hedging, speculation, arbitrage, or portfolio diversification, derivatives remain a cornerstone of modern financial markets.
As the global environment becomes more uncertain, derivatives will continue to play a crucial role in risk management and trading innovation—shaping the next era of financial markets.
Global Banking & Financial Stability1. Introduction to Global Banking
Global banking refers to financial institutions that operate across multiple countries and offer a wide range of services—including commercial banking, investment banking, wealth management, and cross-border payment systems. These banks connect global markets by facilitating international trade finance, foreign exchange operations, capital flows, and investment activities.
The world’s large banks—such as JPMorgan Chase, HSBC, BNP Paribas, Mitsubishi UFJ, and Citigroup—are systemically important. They hold trillions in assets and operate in dozens of countries. Their global integration enhances economic connectivity, but it also means that shocks can spread quickly across jurisdictions.
2. Importance of Global Banking in the World Economy
Global banking plays a vital role in:
a) Capital Allocation
Banks direct funds to productive sectors by offering loans, underwriting securities, and supporting business expansions. Efficient allocation helps economies grow.
b) Payment and Settlement Systems
Banking infrastructure enables fast and secure cross-border payments. Systems like SWIFT, CHIPS, Fedwire, and TARGET2 ensure the smooth functioning of global financial markets.
c) Risk Diversification
Banks diversify risk by operating across multiple geographies and asset classes. This lowers the impact of localized economic downturns.
d) Foreign Exchange & Global Trade
Banks facilitate forex trading, hedging, and trade finance instruments (LCs, guarantees). Without them, global trade would slow dramatically.
e) Financial Inclusion and Technology
Through digital banking, fintech collaborations, and mobile payments, global banks accelerate financial inclusion.
3. What Is Financial Stability?
Financial stability means the financial system—banks, markets, institutions, and infrastructure—functions smoothly without widespread disruptions. A stable financial environment:
protects savings and investments
maintains confidence in banking systems
supports credit availability
prevents economic recessions caused by financial crises
When financial stability weakens, it manifest in:
bank failures
liquidity shortages
credit crunch
currency crises
stock market crashes
sovereign debt problems
Ensuring stability is therefore a top priority for central banks and regulators around the world.
4. Key Pillars of Global Financial Stability
a) Strong Banking Regulation
Regulatory frameworks such as Basel I, II, and III set global standards for capital adequacy, risk management, leverage ratios, and liquidity.
Basel III introduced:
Higher capital buffers (CET1 requirements)
Liquidity Coverage Ratio (LCR)
Net Stable Funding Ratio (NSFR)
Countercyclical capital buffers
These measures were strengthened after the 2008 financial crisis to protect banks from insolvency.
b) Effective Central Banking
Central banks maintain financial stability through:
monetary policy (interest rate decisions)
lender-of-last-resort facilities
regulation and supervision
market interventions (bond purchases, liquidity infusion)
Institutions like the Federal Reserve, ECB, Bank of England, and Bank of Japan play critical roles in global stability.
c) Deposit Insurance & Resolution Frameworks
Deposit insurance protects small depositors and prevents bank runs. Resolution frameworks allow failing banks to be wound down without taxpayer bailouts.
d) Global Cooperation
Bodies such as:
IMF
World Bank
Financial Stability Board (FSB)
BIS
Coordinate policies, share information, and manage crisis responses.
5. Major Threats to Global Financial Stability
1. Interest Rate Volatility
Rapid changes in interest rates can affect:
bond markets
bank balance sheets
borrowing costs
debt sustainability
Sharp rate hikes, like those in 2022–2024, exposed vulnerabilities in banks holding long-dated government securities.
2. High Global Debt
Global debt—household, corporate, and sovereign—has reached unprecedented levels. Excessive debt reduces economic resilience and raises default risks.
3. Bank Runs and Liquidity Crises
Digital banking has made withdrawals instantaneous. The collapse of Silicon Valley Bank (SVB) in 2023 showed how quickly liquidity crises can unfold in the modern era.
4. Geopolitical Risks
Events like:
US–China tensions
Russia–Ukraine war
Middle East conflicts
lead to currency volatility, commodity price shocks, sanctions, and capital flight.
5. Cybersecurity Threats
Banks face risks from cyberattacks, ransomware, and data breaches. As banking becomes more digital, systemic cyber risks increase.
6. Shadow Banking System
Non-bank financial institutions (NBFCs), hedge funds, P2P lenders, and money market funds can create risks outside traditional banking regulation.
7. Climate and ESG-Related Risks
Physical climate risks, energy transitions, and carbon pricing affect asset valuations, insurance exposures, and lending portfolios.
6. Lessons from Past Financial Crises
a) 2008 Global Financial Crisis
Triggered by:
excessive leverage
subprime mortgage lending
securitization
lack of oversight
It caused the collapse of major institutions (Lehman Brothers), global recession, and massive bailouts. Stronger regulations were introduced afterward.
b) Eurozone Debt Crisis (2010–2012)
Greece, Portugal, Spain, and Italy faced sovereign debt issues. It highlighted the vulnerability of economies tied by a common currency but not by unified fiscal policy.
c) COVID-19 Crisis (2020)
A global economic shutdown triggered liquidity shortages, but coordinated policy actions (rate cuts, QE, stimulus) helped stabilize markets.
d) US Regional Bank Crisis (2023)
Banks with concentrated deposit bases and interest-rate mismatches faced collapse. It reaffirmed the importance of asset-liability management.
7. Strengthening Financial Stability in the Future
1. Advanced Risk Management
Banks are deploying AI, big data, and machine learning to improve credit scoring, fraud detection, and asset quality monitoring.
2. Technology Regulation
Regulating fintechs, digital banks, crypto exchanges, and stablecoins is essential to prevent new systemic risks.
3. Climate-resilient Banking
Stress testing for climate risk and sustainable finance strategies will be vital.
4. Cross-Border Supervisory Cooperation
As banks operate globally, regulators must share real-time data and jointly manage crises.
5. Modernized Payment Infrastructure
Central bank digital currencies (CBDCs) and faster cross-border payments may improve stability by reducing settlement risks.
Conclusion
Global banking is the lifeline of the world economy, facilitating trade, capital flows, and economic development. Financial stability, on the other hand, ensures that the system can absorb shocks, support growth, and maintain public confidence.
While global banking has become more resilient since the 2008 crisis, new challenges—cyber risks, geopolitical tensions, climate risks, leveraged debt, and technological disruptions—continue to test its strength. Ensuring financial stability requires coordinated global regulation, robust central bank policies, technological safeguards, and disciplined risk management.
In an interconnected world, the stability of one nation’s financial system directly affects others. Therefore, maintaining global banking stability is not just an economic necessity—it is essential for global peace, growth, and long-term prosperity.

Bond Yield Movements (US 10-Year, German Bunds)1. What Bond Yields Represent
A bond’s yield is essentially the return an investor earns for holding that bond. Yields move inversely to prices:
Bond prices rise → yields fall
Bond prices fall → yields rise
This inverse relationship reflects investor demand. When investors seek safety, they buy more bonds, pushing prices up and yields down. When they expect strong growth or higher interest rates, they sell bonds, pushing yields up.
Why the US 10-Year and German Bunds matter
The US 10-year Treasury yield is the world’s primary risk-free benchmark. It influences global bond markets, the US mortgage market, corporate borrowing costs, and equity valuations.
The German 10-year Bund yield is the benchmark for the Eurozone, influencing borrowing costs across Europe, including in countries like France, Italy, and Spain.
These yields act as barometers of economic health and market expectations.
2. Key Drivers of Yield Movements
a. Inflation Expectations
Inflation erodes the real return on bonds. Thus:
Higher expected inflation → higher yields, due to anticipated central bank tightening.
Lower expected inflation → lower yields, reflecting stable prices and easier policy.
Recent years have seen yields swing significantly due to rapid changes in inflation, especially after global supply-chain disruptions and energy shocks.
b. Central Bank Policies
The US Federal Reserve and the European Central Bank (ECB) play a central role.
When central banks raise interest rates, bond yields tend to rise as investors demand higher returns.
When they cut rates or conduct quantitative easing (QE)—buying bonds to inject liquidity—yields decline.
Forward guidance is equally important; even statements about future policy can move yields dramatically.
c. Economic Growth Indicators
Stronger economic data—GDP growth, employment figures, retail sales—pushes yields higher because markets expect tighter monetary policy ahead. Weak data tends to pull yields down due to expectations of lower growth and potential rate cuts.
d. Risk Sentiment and Safe-Haven Flows
During geopolitical tensions, financial instability, or market panics, investors flee to safe assets:
US Treasuries and German Bunds are premium safe-haven assets.
In risk-off environments, demand for these bonds rises → yields fall.
In risk-on environments, capital shifts to equities and risk assets → yields rise.
e. Fiscal Policy and Supply of Bonds
Large government deficits require increased bond issuance, sometimes pushing yields higher if supply outpaces demand. Conversely, fiscal consolidation reduces supply pressure.
3. US 10-Year Treasury Yield: Global Leader
The US 10-year yield is the world’s most influential interest rate. Its movements ripple across global markets.
a. Impact on Global Finance
Dollar strength: Higher yields attract capital into USD assets.
Emerging markets: Rising US yields often pressure EM currencies and stocks.
Equity valuations: Growth stocks, especially tech, are sensitive to yield changes as long-term cash flows are discounted at higher rates.
b. What Drives the US 10-Year Most
Federal Reserve policy
Rate hikes push yields up; dovish policies pull yields down.
Inflation trends
CPI, PCE inflation data strongly influence expectations.
Labor market strength
Strong job numbers raise expectations of Fed tightening.
Fiscal deficits and debt issuance
US Treasury supply can push yields higher if demand weakens.
Global demand
Foreign investors—Japan, China, and global funds—play a huge role in buying Treasuries.
c. Role in US Economy
Mortgage rates closely follow the 10-year.
Rising yields → higher borrowing costs → slowdown in housing.
Corporate debt becomes costlier as yields rise.
Treasury yields serve as a baseline for risk premiums across asset classes.
Thus, the US 10-year yield shapes both domestic and global liquidity conditions.
4. German 10-Year Bund: Europe’s Anchor
The German Bund serves a similar role for the Eurozone.
a. Why Bunds Matter Globally
Seen as the ultimate safe-haven within Europe.
Forms the basis for pricing all European government bonds.
ECB policy heavily influences Bund yields, often more directly than Fed policies affect Treasuries.
b. Drivers of Bund Yields
ECB policy stance
Tightening pushes yields higher; easing pushes them lower.
Eurozone inflation dynamics
Energy prices have historically been key drivers.
Growth divergence within Europe
Bund yields often fall when southern European debt markets show stress.
Global risk sentiment
Bunds act as safe assets during global or European crises.
c. Spread Analysis: The Bund vs. Other European Bonds
A critical aspect of European markets is the spread between the German Bund and other sovereign bonds, such as:
Italian BTPs
Spanish Bonos
French OATs
Wider spreads indicate market stress; narrower spreads imply confidence in the Eurozone’s stability.
5. Correlation Between US and German Yields
While each region has unique fundamentals, the two yields exhibit strong co-movement due to global capital mobility.
a. When US Yields Drive Bund Yields
Often seen when:
US inflation surprises the market.
The Fed adopts an aggressively hawkish stance.
Global investors move capital into or out of bonds collectively.
Because of arbitrage opportunities, global bond yields cannot diverge too much for too long.
b. When Bunds Diverge from Treasuries
This happens when:
European economic weakness contrasts with strong US growth.
ECB policy lags behind the Fed.
Eurozone debt concerns create local safe-haven demand.
Thus, co-movement is strong but not absolute.
6. Macro Implications of Yield Movements
a. For Currency Markets
Rising US yields → stronger USD.
Rising Bund yields → stronger EUR, if driven by growth rather than crisis.
b. For Equities
Higher yields pressure high-valuation sectors.
Lower yields support risk assets, especially tech and growth stocks.
c. For Commodities
Higher yields often coincide with weaker commodity demand, unless inflation is the driver.
Gold tends to fall when yields rise, as bonds offer higher real returns.
d. For Corporate and Government Borrowing
All debt becomes more expensive as benchmark yields rise.
Governments with higher debt burdens face fiscal pressure.
7. Conclusion
Movements in the US 10-year Treasury and German 10-year Bund yields hold immense significance for global markets. They encapsulate expectations about inflation, growth, central bank policy, and risk appetite. As benchmarks for global financing conditions, shifts in these yields determine everything from currency valuations and equity performance to housing markets and government budgets. Understanding their dynamics allows investors, policymakers, and traders to interpret the broader economic landscape and anticipate market trends.

Global Supply Chain Shifts1. The End of Hyper-Globalization and Its Supply Chain Impact
For nearly three decades, globalization thrived on the free movement of capital, labor, and goods. Companies built sprawling cross-border supply chains to minimize costs, often producing components in multiple countries before assembling the final product elsewhere. This system worked well when trade tensions were low and transportation was cheap.
However, recent years have seen disruptions that challenged this model:
US-China trade tensions
Brexit
Rising tariffs and protectionism
Deglobalization trends
Reassessment of political and economic dependencies
This shift has forced businesses to rethink concentrated supply chains and the risks associated with reliance on single geographic hubs.
2. The Pandemic Shock: A Structural Turning Point
COVID-19 acted as a catalyst rather than the root cause of supply chain shifts. Lockdowns disrupted manufacturing hubs, cargo backlogs overwhelmed ports, and shortages hit critical sectors like semiconductors, pharmaceuticals, and electronics. Companies realized that even temporary disruptions could cause global ripple effects.
This led to a strategic pivot toward:
Supply chain resilience over lowest cost
Diversification of suppliers
Multi-sourcing instead of sole sourcing
Inventory buffers over JIT systems
The pandemic introduced a permanent mindset shift: flexibility and resilience now drive supply chain strategy.
3. Geopolitical Realignments and Strategic Decoupling
The sharp escalation of geopolitical competition—particularly between the US and China—has dramatically reshaped supply chain strategies.
Key trends include:
a. China-plus-One Strategy
Companies are reducing dependence on China by adding manufacturing bases in countries like:
India
Vietnam
Thailand
Mexico
Indonesia
China remains a major global producer, but its dominance is slowly declining as firms seek diversification.
b. Regionalization
Regional blocs like USMCA, EU, and ASEAN are gaining importance as companies locate production closer to end markets.
c. Friendshoring and Ally-shoring
Countries increasingly favor supply chain partnerships with political allies to reduce vulnerability to sanctions, trade restrictions, or diplomatic tensions.
4. Technology as a Supply Chain Disruptor
Rapid technological advancements are revolutionizing supply chains, improving transparency, efficiency, and automation.
a. Industry 4.0
Technologies such as:
Robotics
AI
IoT sensors
Digital twins
Autonomous warehousing
Predictive analytics
help reduce labor dependency, improve forecasting, and optimize real-time decision-making.
b. Blockchain
Blockchain enhances security and traceability, especially for high-value or compliance-heavy sectors like pharmaceuticals, food safety, and luxury goods.
c. 3D Printing (Additive Manufacturing)
Local, on-demand production reduces the need for long-distance shipping and large inventories. Sectors adopting 3D printing include aerospace, automotive, and medical devices.
d. E-commerce and last-mile innovation
The boom in e-commerce—accelerated during the pandemic—led companies to strengthen distribution networks, micro-fulfilment centers, and last-mile delivery infrastructure.
5. Sustainability and Green Supply Chain Transformation
Climate change and environmental regulation have become strategic imperatives.
Drivers include:
Rising carbon taxes and emissions regulations
Consumer preference for sustainable brands
Corporate ESG commitments
Climate-related disruptions (heatwaves, floods, storms)
Sustainable supply chain strategies involve:
Electrifying transportation fleets
Switching to renewable energy in factories
Circular economy practices (reuse, recycle, remanufacture)
Measuring and reducing Scope 3 emissions
Greener packaging and logistics
Eco-friendly supply chains are no longer optional—they are becoming a competitive necessity.
6. The Reshoring, Nearshoring, and Friendshoring Wave
In response to rising risks, many companies are relocating or reconfiguring production.
a. Reshoring
Bringing manufacturing back to the company’s home country to reduce geopolitical and transportation risks.
b. Nearshoring
Shifting production to nearby countries for faster delivery and lower logistics costs.
Examples:
US companies moving from China to Mexico
European firms shifting production from Asia to Eastern Europe
c. Friendshoring
Building supply chain networks with nations that share political and economic alignment.
The overall trend reflects a move from global fragmentation to regional integration.
7. Rising Costs and the New Economics of Supply Chains
Several macroeconomic factors have altered global cost structures:
Higher labor costs in China and other major manufacturing hubs
Increased shipping container and freight prices
Energy price volatility
Currency fluctuations
Higher interest rates making inventory and capital-intensive supply chains costlier
To manage these pressures, companies are:
Automating production
Renegotiating supplier contracts
Using digital tools for forecasting and efficiency
Exploring alternative logistics routes (e.g., Middle Corridor, Arctic routes)
8. Supply Chain Risk Management Takes Center Stage
Risk management has shifted from a reactive to a proactive approach.
Modern supply chain risk tools include:
AI-driven risk scoring
Geo-economic risk dashboards
Supplier risk audits
Scenario planning
Business continuity frameworks
Organizations now monitor:
Cyber risks
Natural disasters
Trade disruptions
Political instability
Supplier financial health
This investment aims to minimize disruptions and maintain operational continuity.
9. The Rise of India, Vietnam, and Emerging Manufacturing Hubs
Global supply chain shifts have benefited several emerging economies.
India
Strong government push (PLI schemes)
Expanding electronics, pharmaceuticals, and automotive manufacturing
Large labor force and growing logistics infrastructure
Vietnam
Low labor costs
Attractive for electronics and textiles
Key alternative to China
Mexico
Strategic nearshore hub for North America
Strong manufacturing base (auto, electronics)
Indonesia & Thailand
Growing role in chemicals, automotive, and consumer goods
These shifts represent a rebalancing of global manufacturing power.
10. The Future: What Global Supply Chains Will Look Like
The next decade will reshape supply chains around five strategic pillars:
1. Resilience
Multi-sourcing, regional hubs, and contingency planning.
2. Digitalization
Full integration of AI, automation, and real-time supply chain visibility.
3. Sustainability
Carbon-neutral logistics, green energy, circular manufacturing.
4. Localization
Shorter, regionally connected supply chains.
5. Geopolitical Adaptation
Flexible supply chain designs that can quickly reorient based on political realities.
Supply chains of the future will be shorter, smarter, greener, and more diversified.
Conclusion
Global supply chain shifts represent one of the most transformative changes in modern economic history. Moving away from hyper-globalized, cost-driven models, supply chains are becoming resilient, technologically advanced, and regionally diversified. Driven by geopolitics, technology, climate imperatives, and shifting economic fundamentals, the new supply chain landscape is dynamic, interconnected, and continuously evolving. Companies that adapt to these changes—embracing resilience, digital tools, and sustainability—will gain a strategic advantage in the global marketplace.

Commodity Supercycle Trends1. Understanding the Concept of Supercycles
Commodities traditionally move in cycles based on supply–demand fluctuations, but a supercycle is different in scale and duration. Price trends in supercycles tend to:
Last for 10–20 years
See sustained upward trajectories
Be driven by massive structural demand
Cause large-scale capital investments and supply expansions
Supercycles usually involve multiple commodities rising together, including crude oil, copper, aluminum, iron ore, wheat, corn, and rare earth metals.
2. Historical Commodity Supercycles
Economists identify four major commodity supercycles in the past 150 years:
a. Late 19th-Century Industrialization Supercycle (1890s–1910s)
This era coincided with the rapid industrial expansion in the US and Europe. Demand surged for coal, metals, and agricultural output to support railway construction, electricity expansion, and manufacturing.
b. Post-WWII Reconstruction Supercycle (1945–1970)
After World War II, Europe and Japan undertook large-scale rebuilding. This sharply increased the demand for energy, steel, and industrial metals. The global population was also rising rapidly, driving agricultural commodity consumption.
c. China-Led Supercycle (2000–2014)
Perhaps the most notable modern supercycle, driven by:
China’s industrialization and urbanization
Massive infrastructure investment
Globalization and trade expansion
Strong energy demand, especially crude oil
Metals like copper, iron ore, and aluminum saw exponential price growth during this period.
d. The “Green Transition” and Renewables Supercycle? (2020s–ongoing)
There is debate over whether the post-2020 environment constitutes a new supercycle. Still, strong demand for battery metals, rare earth elements, lithium, nickel, copper, and silver—essential for clean energy technologies—suggests a potential long-duration upward trend.
3. Drivers Behind Commodity Supercycles
Supercycles are created by mega-trends rather than short-term economic fluctuations. Key drivers include:
a. Industrialization and Urbanization
Emerging economies (e.g., China in the 2000s, India in the 2020s) undergo phases where construction, manufacturing, and infrastructure grow at a rapid pace. This increases demand for:
Steel and iron ore
Cement
Base metals
Energy fuels
b. Technological Shifts
New technologies can reconfigure commodity demand:
Electric vehicles → lithium, nickel, cobalt
Solar energy → silver, polysilicon
Semiconductor demand → rare earths
Technological revolutions often create entirely new commodity markets.
c. Population Growth and Changing Consumption Patterns
Growing populations increase demand for:
Food grains (wheat, rice, corn)
Protein (soybean, livestock feed)
Energy (oil, natural gas)
Urban lifestyles also increase per-capita metal and energy consumption.
d. Underinvestment in Supply
Supercycles often begin after years of:
Low commodity prices
Reduced mining investment
Capacity shrinkage
Supply chain disruptions
When demand picks up suddenly, supply cannot catch up, causing prices to surge.
e. Monetary and Fiscal Stimulus
Loose monetary policy or money supply expansion can raise:
Inflation
Liquidity in markets
Investment in commodity funds
This increases speculative and real demand for commodities.
4. The 2020s: Are We in a New Commodity Supercycle?
Analysts worldwide debate whether the 2020s reflect the start of a new supercycle. Several powerful forces suggest this possibility:
a. Energy Transition and Green Technologies
The transition to a low-carbon global economy hugely increases demand for:
Copper (electric grids, EVs)
Lithium (EV batteries)
Nickel, cobalt (battery chemistry)
Silver (solar panels)
Rare earths (wind turbines, electronics)
Estimates show the energy transition may require 3–10 times more metals compared to the current baseline.
b. Supply Constraints
This decade faces:
Mine depletion
Scarcity of high-grade ores
Stringent environmental rules
Slow permitting processes
Geopolitical resource nationalism (Africa, Latin America)
Supply shortages amplify price pressures.
c. Geopolitical Shifts
Conflicts and tensions between major powers affect commodity flows:
US–China rivalry impacts rare earths
Middle East tensions influence oil
Russia’s sanctions affect natural gas and metals
Realignment of supply chains supports longer-term price elevation.
d. Climate Change Disruptions
Extreme weather affects:
Agricultural output
Mining operations
Shipping routes
More frequent droughts, floods, and storms disrupt supply and raise volatility.
5. Major Commodities Likely to Dominate the Coming Supercycle
1. Copper
Considered the “new oil” of the green economy, copper demand is expected to surge due to:
EVs requiring 2–4 times more copper
Renewable energy grids
Electrification of industries
2. Lithium
A core input for batteries, with demand expected to grow 10–15x by 2035.
3. Nickel and Cobalt
Key metals for high-density battery chemistries.
4. Crude Oil
Despite renewable energy growth, oil demand remains strong due to:
Aviation
Petrochemicals
Industrial use
Slow transition in developing countries
5. Natural Gas and LNG
Seen as a “bridge fuel” in the transition away from coal.
6. Agricultural Commodities
Food prices are rising due to climate volatility and rising global population.
7. Precious Metals (Gold, Silver)
Investors hedge against inflation, currency depreciation, and geopolitical uncertainty.
6. Investment and Trading Implications
a. Long-Term Opportunities
A supercycle supports multi-year rallies in:
Mining stocks
Metal ETFs
Energy companies
Commodity indices
b. Volatility Will Remain High
While long-term trend is upward, short-term fluctuations will be sharp due to:
Interest rate swings
Policy changes
Currency volatility
c. The Role of Emerging Markets
India, Indonesia, Vietnam, and parts of Africa are entering new phases of:
Industrialization
Infrastructure spending
Urbanization
This will add structural demand to the global commodity landscape.
d. ESG and Sustainability Constraints
Environmental regulations limit new mining capacity, pushing prices higher.
7. Conclusion
Commodity supercycles represent long-term, structural shifts in global economic dynamics. They arise when powerful forces—industrialization, population growth, technology transitions, geopolitics, and supply constraints—drive sustained commodity demand. The world today is experiencing pressures that resemble previous supercycle conditions, especially with the rise of green energy, supply chain restructuring, and climate-driven disruptions. Whether or not this evolves into a full-fledged supercycle, commodities like copper, lithium, nickel, crude oil, natural gas, and agricultural products are likely to experience elevated demand and significant price appreciation in the years ahead. Understanding these trends helps investors and policymakers strategize effectively in a resource-constrained and rapidly evolving global economy.
Geopolitical Risks: US-China, Middle East, and Russia-Ukraine1. US–China Strategic Rivalry
The US–China geopolitical competition is the single most important strategic rivalry of the 21st century. It extends far beyond military issues and deeply penetrates technology, supply chains, trade policies, cyber security, and political influence.
A. Trade and Economic Decoupling
Since 2018, the US and China have been locked in a trade war that has evolved into a broader process of economic decoupling. The US seeks to reduce its dependency on China in areas such as:
Semiconductors
Critical minerals
Electric vehicle batteries
Pharmaceuticals and APIs
Artificial intelligence and telecommunications
Tariffs, sanctions, and export controls have disrupted global supply chains. Many companies are pursuing “China+1” strategies by shifting production to India, Vietnam, and Mexico. However, true decoupling remains complicated because China is deeply integrated into global manufacturing.
B. Technology War and the AI Race
Technology is at the core of the rivalry. The US is restricting China’s access to:
Advanced semiconductor equipment
AI chips
Quantum computing technologies
Meanwhile, China accelerates investment in self-sufficiency through initiatives like “Made in China 2025” and its national AI strategy. The global tech ecosystem is splitting into two competing blocs, affecting equipment standards, supply networks, and cybersecurity frameworks.
C. Taiwan and Military Tensions
Taiwan remains the most explosive flashpoint. China considers Taiwan a breakaway province and has intensified military activities around the island. The US supports Taiwan’s defense through arms sales and political backing. Any major escalation could disrupt:
Global semiconductor supply (TSMC)
East Asian shipping lanes
Global equity markets
Even minor incidents raise volatility across global markets.
D. Geopolitical Influence in Asia and the Global South
Both nations compete for influence:
The US strengthens alliances through Quad, AUKUS, NATO partners, and Indo-Pacific initiatives.
China expands influence via Belt and Road (BRI) investments, infrastructure financing, and strategic partnerships with Africa, the Middle East, and Latin America.
This rivalry affects voting patterns at the UN, trade agreements, and global governance systems.
Overall, the US–China rivalry increases strategic uncertainty, reshapes supply chains, and compels nations to navigate between two superpowers.
2. Middle East Geopolitical Risks
The Middle East remains a region of enduring conflict, energy dependency, and shifting alliances. Three major developments define current risks:
A. Israel–Palestine and Regional Escalations
The conflict between Israel and Palestinian groups has intensified after recent escalations. The risk lies in the potential regionalization of the conflict involving:
Hezbollah (Lebanon)
Iran
Syria
US interests in the region
Any escalation could disrupt vital energy corridors, oil shipments, and global market stability.
B. Iran–US Tensions and the Gulf
Iran’s nuclear ambitions and proxy networks in Iraq, Yemen, and Lebanon create persistent risk. The Strait of Hormuz—through which 20% of global oil passes—remains one of the most vulnerable chokepoints in the world. Threats to tanker traffic can cause immediate spikes in oil prices.
The US maintains its military presence to secure maritime routes, while Gulf states diversify politically and economically to reduce vulnerability.
C. Saudi Arabia’s Strategic Realignment
Under Vision 2030, Saudi Arabia is diversifying its economy and recalibrating its global alliances:
Improving ties with China
Balancing relations with the US
Leading OPEC+ production strategies
Mediating regional disputes
Saudi Arabia’s decisions on oil output influence global energy markets and inflation trends.
D. Fragmentation and New Alliances
The Middle East is witnessing a major geopolitical reconfiguration:
Abraham Accords brought some Arab countries closer to Israel.
Turkey is becoming more assertive in the Eastern Mediterranean.
China has brokered surprise diplomatic agreements (e.g., Saudi–Iran rapprochement).
These shifts illustrate rising multipolarity, reducing the dominance of Western diplomatic frameworks.
In short, the Middle East remains a source of energy risk, regional power struggles, and global market volatility.
3. Russia–Ukraine War
The Russia–Ukraine conflict is the largest military confrontation in Europe since World War II and has deep global consequences.
A. Energy Shock and Global Commodity Markets
The war triggered massive disruptions in:
Natural gas supply to Europe
Crude oil markets
Fertilizer exports
Grains (Ukraine and Russia are major wheat exporters)
Europe accelerated its shift toward renewables and alternative gas supplies, but global energy markets remain sensitive to military developments.
B. Sanctions and Financial Fragmentation
The US, EU, and allies have imposed comprehensive sanctions on Russia. This has:
Restricted Russia’s access to global banking networks
Frozen central bank assets
Limited technology and military imports
Forced Russia to redirect oil to China and India
Global finance has become more fragmented, accelerating the creation of alternative payment systems such as:
China’s CIPS
Russia’s SPFS
Local-currency trade agreements
This undermines the dominance of the US dollar over the long term.
C. Military Escalation and NATO Expansion
The conflict has reshaped European security:
Finland and Sweden joined NATO
Eastern Europe increased defense budgets
The US reinforced military presence in Europe
Russia has strengthened ties with China, Iran, and North Korea, forming an alternative geopolitical camp.
D. Long-Term Economic Impact
Ukraine’s infrastructure has suffered devastating damage, while Russia faces prolonged isolation. Global investors now factor geopolitical risk into investment decisions, especially in Europe.
The war also accelerates trends such as:
Defense industry investment boom
Energy transition
Rerouting of global commodity flows
The Russia–Ukraine war marks a major shift toward long-term confrontation between Russia and Western powers.
Conclusion
US–China rivalry, Middle East volatility, and the Russia–Ukraine conflict collectively define a new era of global uncertainty and multipolar competition. These conflicts disrupt supply chains, raise commodity prices, accelerate military spending, and reshape global alliances. The world is transitioning from unipolarity (US dominance) to a multipolar order where regional powers assert greater influence. Nations and businesses must navigate these risks carefully, as geopolitics will continue to drive market behavior, trade flows, and strategic decisions in the decade ahead.

Emerging Markets: India, Brazil, and Indonesia1. India: The Fastest-Growing Major Emerging Market
India stands out as one of the most dynamic emerging markets globally. With a population of over 1.4 billion and a young workforce, India provides a huge labor pool and consumer market. Its economic strengths lie in technology, manufacturing, services, and large-scale domestic consumption.
Key Growth Drivers
Demographic Dividend
India has one of the youngest populations in the world, with a median age of about 29. This creates a strong workforce and a large base of consumers driving retail, real estate, technology, and financial services.
Digital & Technological Leadership
India’s digital ecosystem is one of the world’s most advanced.
UPI revolutionized digital payments
Startup ecosystem is among the top 3 globally
IT and BPO services dominate global outsourcing
Manufacturing Push (Make in India)
The government is aggressively promoting domestic manufacturing with incentives for electronics, semiconductors, automobiles, renewable energy, and defense production.
Infrastructure Expansion
Massive investments in highways, airports, railways, ports, and metro networks aim to enhance long-term competitiveness.
Sectors with High Potential
Information Technology and AI
Renewable Energy (solar leadership)
Pharmaceuticals and biotechnology
Financial services and digital payments
Automotive and EV manufacturing
Challenges
Unemployment and uneven income distribution
Infrastructure gaps in rural areas
Regulatory complexities
Dependence on imported fuel
Despite these challenges, India’s growth trajectory is strong. It is expected to become the world’s third-largest economy by 2030, driven by structural reforms, rising consumption, and a booming tech sector.
2. Brazil: Latin America’s Largest Emerging Market
Brazil is the biggest economy in Latin America and a global supplier of commodities, agricultural products, minerals, and energy. Its enormous reserves of natural resources, expanding consumer class, and diversified sectors make it an influential emerging market.
Key Growth Drivers
Abundant Natural Resources
Brazil is a top global exporter of:
Soybeans
Coffee
Sugar
Beef
Iron ore
Oil (deep-water reserves)
Agricultural Powerhouse
Known as the “breadbasket of the world,” Brazil has fertile land, favorable climate, and advanced agribusiness technologies.
Agribusiness contributes significantly to GDP and exports, helping Brazil maintain trade surpluses.
Industrial Capacity
Brazil has strong manufacturing sectors in:
Automobiles
Aircraft (Embraer)
Chemicals
Steel
Textiles
Growing Middle Class
A large domestic consumer market supports retail, banking, and services growth.
Sectors with High Potential
Agriculture and food processing
Mining and metallurgy
Renewable energy (biofuel, hydroelectric)
Oil & gas exploration
Tourism and ecotourism
Challenges
Political instability and frequent policy changes
High public debt and inflationary pressures
Bureaucracy and governance issues
Income inequality and uneven development
Nonetheless, Brazil’s resource wealth and export-driven economy position it as a long-term growth engine for Latin America. Demand from China, the U.S., and Europe continues to shape its global trade profile.
3. Indonesia: Southeast Asia’s Rising Economic Power
Indonesia is the largest economy in Southeast Asia, with over 270 million people and a rapidly expanding middle class. Its strategic location, natural resources, and economic reforms make it a fast-growing emerging market.
Key Growth Drivers
Demographic Advantage
Similar to India, Indonesia has a young population, which fuels consumption, entrepreneurship, and labor supply.
Natural Resource Endowment
Indonesia is rich in:
Nickel (key for EV batteries)
Coal
Palm oil
Natural gas
Copper and gold
The government is encouraging downstream processing, such as nickel-based battery manufacturing, to move from raw material exporter to industrial producer.
Strategic Trade Location
Indonesia sits on major global shipping routes (e.g., the Strait of Malacca), giving it enormous trade potential and geo-economic importance.
Infrastructure Development
Indonesian government spending on ports, airports, roads, and industrial zones is improving connectivity and logistics.
Sectors with High Potential
EV battery and mineral processing
Palm oil and sustainable agriculture
Tourism (Bali, Lombok)
Manufacturing (textiles, electronics)
Digital economy (e-commerce boom)
Challenges
Dependence on commodity exports
Environmental concerns (deforestation & mining)
Bureaucracy and corruption issues
Vulnerability to global commodity prices
Still, Indonesia is on track to become a top 10 global economy by 2040, supported by industrialization, consumption, and its digital ecosystem.
Conclusion
India, Brazil, and Indonesia represent the next wave of global economic powerhouses. Their influence is rising due to strong demographics, natural resources, expanding markets, and reform-driven policies. While each country faces unique challenges—from political instability in Brazil to regulatory hurdles in India and environmental concerns in Indonesia—their long-term prospects remain robust.
As global supply chains shift, multinational companies diversify beyond China, and new technologies emerge, these markets will play a critical role in shaping world trade, investment, and economic growth in the coming decades.

Structure Market Swing Hihg, Swing Low, Uptgrend DownTrend, Range or Consolidation, Resistance, Support, Spport becomes Resistance, Resistance becomes Support,

Rapid ORB ProLive trade using our advanced indicator. This is free for everyone to use in trading view. We are working with guidelines and different ways to enter trade with out indicator. This will make everyone profitable.


Avoiding Good Trades?Why Your Mind Hesitates on High-Quality Setups (But Jumps Into Mediocre Ones)
Be honest with yourself:
How many times has this happened?
A high-quality setup appears → suddenly you feel cautious. You hesitate. You “want to see one more candle.”
A mediocre or unclear setup appears → you feel bold, almost too willing to execute.
If this is you, you’re not alone — this behavior is extremely common.
And it has nothing to do with discipline…
It’s your psychology reacting to the wrong type of risk.
Your mind overprotects you during the good setups (because they appear after long waiting, uncertainty, or drawdown)…
And it underestimates danger during familiar, low-quality ones.
This single distortion silently destroys performance for thousands of traders.
The Fix
1. Define your setups — but verify how often they actually appear.
Most traders try to label confluences or build “A+ setups” without ever checking availability.
They don’t know how frequently those conditions appear in real market data.
So they expect setups that simply don’t exist often enough — which creates frustration and hesitation exactly when a real one finally shows up.
If you don’t know availability, you will always misjudge opportunity.
2. Pre-commit to risk — because structure evolves faster than your emotions.
Traders struggle with pre-commitment because structure changes quickly:
breaks, sweeps, displacements, retracements.
By the time a good setup forms, you may have only a few seconds to make a correct decision.
If you try to calculate risk in the moment, hesitation takes over.
Pre-commitment isn’t about forcing size — it’s about removing the decision fatigue that kills high-quality trades.
3. Build a routine that includes emotional resistance, not just rules.
A real routine is not just a checklist.
It’s understanding the emotional friction you’ll face every single time:
hesitation
fear spikes
overthinking
temptation to micro-time entries
the urge to wait for one more confirmation
When you anticipate these reactions, they stop controlling you.
Your routine becomes a stabilizing mechanism that protects your best trades from your worst impulses.
If this resonates… follow this account.
I share insights on structure, availability, psychology, and execution — the real stuff traders actually struggle with.
And drop a comment:
👉 What’s ONE thing you know you should do consistently, but still feel resistance toward?
Your answer might be the next topic.

Why Set and Forget Can Be Costly: A Judas Swing Recap on $EURUSDThis week offered a powerful reminder that even a strong setup can turn into a losing trade if you rely solely on a set-and-forget approach. While the Judas Swing strategy continues to deliver consistent opportunities, this particular FX:EURUSD setup showed us why active trade management matters especially in fast-moving sessions.
Going into the session, FX:EURUSD presented a clean range with well-defined liquidity above and below. As expected, price swept the Judas Swing zone lows, the first step in our Judas Swing framework which immediately shifted our attention to potential buying opportunities
Once price took liquidity from the lows and broke structure to the upside, all the pieces aligned:
- Liquidity sweep
- Break of structure
- Retracement into FVG
Everything checked out, and we entered the long position with our standard 1% risk and a 2% target.
The trade moved beautifully in our direction. In fact, we came within just a few pipettes of hitting our take-profit level. At this point, a trader who is actively managing the trade may consider scaling partial profits, reducing risk, or adjusting stops to protect open equity especially when price delivers most of the move.
But with a pure set-and-forget approach, none of those protective actions take place.
And that’s where the trouble began.
After almost reaching our TP, momentum shifted. Price stalled and slowly pushed back against us. What looked like a clean continuation setup turned into a full reversal, and the market drove straight through our stop loss. Instead of closing the week with a solid win, we took a loss not because the strategy failed, but because we didn’t adapt to the information the market was giving us in real time.
A set-and-forget approach sounds appealing:
- No emotions
- No second-guessing
- No screen time
But here’s the reality markets aren’t static. They evolve candle by candle.
Sometimes the difference between a +2% week and a –1% week is simply staying engaged enough to protect partial profits or take action when price hesitates near your target.
This trade wasn’t a failure. We followed our rules and we don't regret it. Do you prefer to set and forget or you manage the trade
