Why Support and Resistance are Made to Be Broken ?Hello fellow traders! Hope you're navigating the markets smoothly. As we go through the daily dance of price action, one thing becomes clear support and resistance are just moments, not walls. They're temporary. Momentum and trend strength? Now that’s where the real story lies.
This publication dives into how these so-called key levels break and more importantly, how to position yourself smartly when they do. Stay flexible, trade with confidence, and let the market lead. Let’s get into it.
Why Support and Resistance Levels Break
Support and resistance are some of the most talked-about tools in technical analysis. But here's the truth they’re not meant to last forever.
No matter how strong a level may appear on your chart, it eventually gets tested, challenged, and often broken. Why? Because the market is dynamic. The real edge for a trader lies not in hoping a level holds, but in reading when it’s about to fail and being ready for it.
No Resistance in a Bull, No Support in a Bear
Ever seen a strong bull market pause just because of a resistance line? It doesn’t. Price keeps pushing higher as buyers keep stepping in. Same goes for a strong bear market support levels collapse as fear takes over and selling snowballs.
Instead of clinging to lines on a chart, think bigger: Where is the momentum? What’s the trend saying? That’s where your trading decisions should come from.
Support and Resistance: Not Fixed, Always Shifting
Yes, these levels matter but only as zones, not exact prices. They’re areas where price has reacted in the past, where traders might expect something to happen again. But they’re not magic numbers.
When traders treat these levels as absolute, they fall into traps false confidence, poor entries, tighter than-needed stop losses. Always remember: market sentiment, liquidity, and institutional activity are constantly changing. So should your interpretation of the chart.
The Temporary Nature of These Levels
Markets move on supply and demand. A level that acted as resistance last week could easily become support next week. Or break completely.
Take the classic example support turning into resistance. When support breaks, former buyers might now be sellers, trying to get out on a bounce. That flip happens because behavior and sentiment have shifted. And as traders, that’s the real pattern we need to track not just price levels, but the psychology behind them.
“Strong” Support? It’s Mostly an Illusion
We all love the idea of a strong level something we can lean on. But large players? They don’t think like that.
Institutions don’t place massive orders at a single price point. They spread across a zone building positions slowly without moving the market too much. What looks like a strong level to us might just be an accumulation or distribution range for them. Always think beyond what’s visible on the surface.
How to Spot Breakouts Before They Hit
Here’s what separates seasoned traders from the rest the ability to spot potential breakouts before they explode.
🔹 Volume Confirmation: If a resistance level is tested repeatedly on rising volume, that’s a big clue buyers are serious.
🔹 Structure Shifts: Higher highs in an uptrend or lower lows in a downtrend signal that the old levels are being challenged.
🔹 Liquidity Traps: Watch out for fakeouts. These are designed to trap impatient traders just before the real move.
🔹 News & Events: Never ignore macro triggers. Earnings, economic data, or geopolitical surprises can fuel breakouts that crush technical levels.
🔹 Break & Retest: A solid strategy — wait for the level to break, then get in on the retest.
🔹 Momentum Tools: Indicators like RSI, MACD, or even EMAs can offer extra confidence that a move has legs.
3 Practical Trading Setups
1. Breakout Trading
Mark key levels on daily or weekly charts.
Watch for volume and momentum confirmation.
Enter after a clear breakout or retest.
Stop-loss: Just below resistance (for longs) or above support (for shorts).
2. Range Trading
If price is stuck between support and resistance, trade the range.
Look for price rejection (wicks, pin bars, etc.).
Use RSI or Stochastics to time entries.
3. Trend Following
Identify the dominant trend using moving averages or price structure.
Avoid going against the trend unless reversal signs are very clear.
Let profits run use trailing stops instead of fixed targets.
Mind Over Market: Psychology of S&R
One of the biggest traps in trading? Overtrusting support and resistance.
We get emotionally attached. We want the support to hold or the resistance to reject. And that bias clouds our judgment. How many times have you seen price break a level — and you freeze because it “wasn’t supposed to”?
To break free of that:
✅ Trade with a plan.
✅ Set your risk before the trade, not after.
✅ Don’t treat any level as sacred.
✅ Stay open to what the market is telling you not what you want it to say.
Final Thoughts
Support and resistance are great tools but they’re just one part of the puzzle. The real power lies in reading price action, watching volume, and understanding market sentiment. Don’t ask, “Will this level hold?” Ask instead, “What happens if it breaks?”
That shift in thinking? It can make all the difference.
Stay sharp, stay adaptive, and keep evolving with the market.
Wishing you green trades and growing accounts!
Best Regards- Amit Rajan.
Community ideas

Why I Only Buy Dips / Sell Rallies When I Trade GoldWhen it comes to trading Gold (XAUUSD), I’ve learned one key truth: breakouts lie, but dips/rallies tell the truth.
That’s why I stick to one rule that has kept me consistently profitable:
I only buy dips in an uptrend and only sell rallies in a downtrend.
Let me explain exactly why this approach works so well—especially on Gold, a notoriously tricky market.
________________________________________
1. 🔥 Gold is famous for fake breakouts
Breakouts on Gold often look amazing… until they trap you.
You enter just as price breaks a key level—then suddenly it reverses and stops you out.
This happens because Gold loves to tease liquidity. It breaks highs or lows just enough to activate stop losses or attract breakout traders, only to reverse.
Buying dips or selling rallies protects you from these traps by entering from value, not hype.
________________________________________
2. ✅ I get better stop-loss placement and risk:reward
When I buy a dip, I can place my stop below a strong level (like a support zone or swing low).
That gives me tight risk and allows for big reward potential—often 1:2, 1:3 or more.
Breakout trades, on the other hand, often require wider stops or result in poor entries due to emotional execution.
________________________________________
3. ⏳ I get time to assess the market
False breakouts happen fast. But dips usually form more gradually.
That gives me time to analyze price action, spot confirmation signals, and even scratch the trade at breakeven if it starts to fail.
This reduces emotional decisions and increases my accuracy.
________________________________________
4. 🎯 Gold respects key levels more than it respects momentum
Even in strong trends, Gold often retraces deeply and retests zones before continuing.
That means entries near key levels—on a dip or rally—are more reliable than chasing price.
I’d rather wait for the zone than jump in mid-air.
________________________________________
5. 🔁 Even in aggressive trends, Gold often reverts to the mean
Lately, Gold has been trending hard—no doubt.
But even during explosive moves, it frequently pulls back to key moving averages or demand zones.
That’s why mean reversion entries on dips or rallies continue to offer excellent setups, even in fast-moving markets.
________________________________________
6. 🧠 I benefit from retail trader mistakes
Most traders get excited on breakouts.
But what usually happens? The breakout fails, and the price returns to structure.
By waiting for the dip/rally (when others are panicking or taking losses), I can enter at a discount and ride the move in the right direction.
________________________________________
7. 🧘♂️ This strategy forces patience and discipline
Waiting for dips or rallies requires patience.
You don’t jump in randomly. You plan your entry, your stop, your take profit—calmly.
That mental discipline is a trading edge on its own.
________________________________________
8. 📊 I align myself with probability, not emotion
In an uptrend, buying a dip is logical.
In a downtrend, selling a rally is natural.
Trying to “chase the breakout” is emotional—trying to get in on the action, fearing you'll miss the move.
I trade with the trend, from the right zone, and with a clear plan.
________________________________________
9. 🕒 I can use pending limit orders and walk away
One of the most underrated benefits of trading dips and rallies?
I don’t need to chase the market or be glued to the screen.
When I see a clean level forming, I simply place a buy limit (or sell limit) with my stop and target predefined.
This saves time, reduces overtrading, and keeps my emotions in check.
It’s a set-and-forget approach that fits perfectly with Gold’s tendency to return to key zones—even during high volatility.
________________________________________
🔚 Final thoughts
There’s no perfect trading strategy. But when it comes to Gold, buying dips and selling rallies consistently keeps me on the right side of probability.
I avoid the emotional traps. I get better entries. And most importantly, I protect my capital while maximizing reward.
Next time you see Gold breaking out, ask yourself:
“Is this real… or should I just wait for the dip/rally?”
That question might save you a lot of pain.

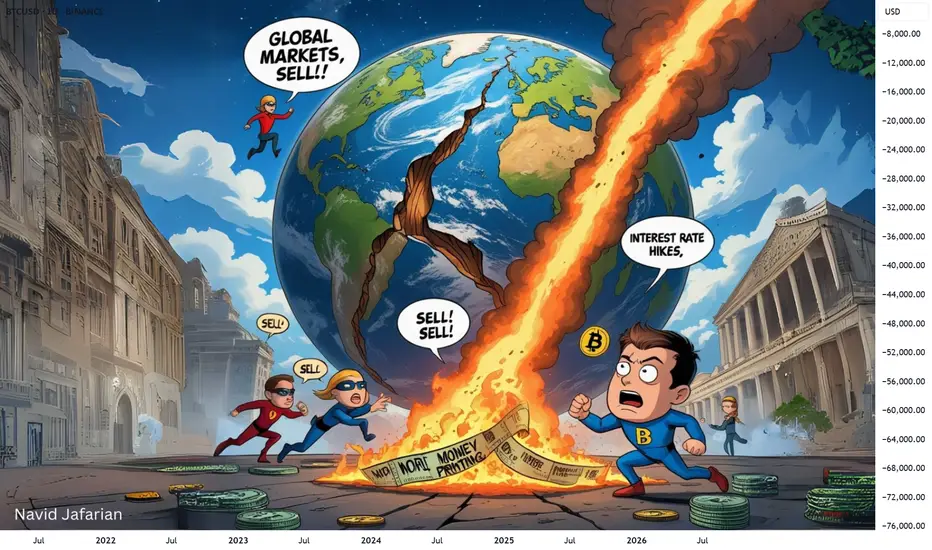
Global Markets Crashing: What Now?⚠️ Global Markets Crashing: What Now?
Don't panic , this is a worldwide event . Even big players are affected.
The important thing is to be patient and focus on future opportunities . We're hoping for a recovery in 2025.
We're holding on! ⏳
If you're experiencing losses right now , don't get discouraged, almost everyone is in the same boat . Even the largest funds managing billions of dollars are in trouble. Trillions of dollars are being wiped out from the world economy. Every country and every stock market is crashing. If you're thinking, 'My altcoin is dropping,' just look at how much ETH has fallen (18% in just one day).
Everything across the globe is falling , so it's natural that our market and investments will also fall. Don't feel bad if you didn't sell at the top in November or December; these are learning experiences for the future. Remember to take profit in the next uptrend.
Right now, all we can do is wait and hope for global issues to be resolved. Interest rate cuts and printing more money could bring a recovery in 2025.
S tay strong and make sure to take your profits if we see a big pump towards the end of the year.
We are also holding all our assets and waiting.
OptionsMastery: This is the "h" DayTrading Pattern.This is the "h" pattern. A highly successful daytrading pattern!
🔉Sound on!🔉
📣Make sure to watch fullscreen!📣
Thank you as always for watching my videos. I hope that you learned something very educational! Please feel free to like, share, and comment on this post. Remember only risk what you are willing to lose. Trading is very risky but it can change your life!

Foundation of Technical Trading: What Makes a Chart Tradable?The Foundation of Technical Trading
There is an abundance of information on price charts, technical methods, indicators, and various tools. However, the required first step is to understand basic market structure. Without this foundational knowledge, technical applications risk becoming inconsistent and disconnected from broader market behavior.
It is also important to question whether technical charts and tools are effective at all. What makes the market responsive to a trendline, a pattern, or an indicator? And why, at other times, do these tools seem entirely irrelevant? Is the market random? If certain events are predictable, under what conditions can such occurrences be expected?
Experiment: Random Charts
Here is an illustration of four charts; two showing real price data and two randomly generated. While some visual distortion gives away subtle differences, there are more refined methods to construct this experiment that makes telling the difference between real and random almost impossible.
All these charts show viable patterns and possible applications. When presented with these, even experienced people tend to construct narratives, whether or not structure is present. This raises a fundamental question; how can one distinguish real occurrences from coincidental formations on a chart? In case all movements are considered random, then this should indicate that applied methods perform no better than coincidence?
Bias and Distortion
It’s also important to comprehend the influence our perception. As humans we are wired to find patterns, even in random data, which can lead to various cognitive biases that distort our interpretation. For example, confirmation bias may lead us to focus only on evidence that supports our expectations, while apophenia causes us to see patterns where none exist. Similarly, hindsight bias can trick us into believing past patterns were obvious, which can develop overconfidence in future decisions. Awareness of these biases allows us to approach technical tools and charts with greater objectivity, with more focus on probabilistic methods and calculated risks.
Experiment: Random Levels
Perform the following experiment; open a chart and hide the price data. Then draw a few horizontal lines at random levels.
Then reveal the price again. You’ll notice that price can touch or reverse near these lines, as if they were relevant levels.
The same thing can happen with various indicators and tools. This experiment shows how easy it is to find confluence by chance. It also raises an important question, is your equipment and approach to the markets more reliable than random?
Market Disorder
Financial markets consist of various participants including banks, funds, traders and algorithmic systems. These participants operate with different objectives and across multiple timeframes resulting in a wide range of interpretations of market behavior. Trades are executed for various reasons such as speculation, hedging, rebalancing, liquidation or automation; directional intent could be unclear. For instance, the prior may serve to offset exposure, and portfolio rebalancing could require the execution of large orders without directional intent.
Technical and chart-based trading likely makes up a minor segment of the overall market; even within this subset, there is considerable variation in perception and interpretation. There could be differences in timeframe, reference points, pattern relevance and responses to similar information. The market is broader, more complex and less definitive than it appears. The point is that markets contain a high degree of structural disorder, which means most assumptions should be questioned and perceived as estimative.
The effect of buying and selling pressure on multiple timeframes sets the foundation for oscillation in price movements, rather than linear and monotonic movements. This pattern of rising and falling in a series of waves sets the points for where the current structure transitions between balance and imbalance. An overall equilibrium between buying and selling pressure results in consolidative price movement, whereas dominance leads to trending or progressive movement.
Volatility Distribution
To answer the main question: What differentiates real market behavior and charts from random data, and ultimately makes it tradable, is the distribution of volatility. This forms the basis for the phenomenon of volatility clustering, where periods of high volatility tend to follow high volatility, and low volatility follows low volatility. It is rare for the market to shift into a volatile state and then immediately revert to inactivity without some degree of persistence. Research supports the presence of this volatility persistence, though with the important caveat that it does not imply directional intent.
Volatility Cycles
These phases tend to occur in alternation, known as volatility cycles, which set the foundation for tradable price structures. This sequence consists of a contractive phase, marked by compression in price movements, followed by an expansive phase, characterized by increased volatility and directional movement. The alternation reflects shifts in underlying buying and selling pressure. This behavior offers a practical approach to interpret market behavior. A more detailed explanation of the concept could be explored in a future post.
Conclusion
While the idea of profitability through technical trading is often questioned, it remains a viable approach when based on sound principles. The edges available to the average trader are smaller and less frequent than commonly presumed. The concepts of volatility and the ability to locate areas of imbalance forms the basis for identifying conditions where market behavior becomes less random and more structured. This sets the foundation for developing technical edges.
The content in this post is adapted from the book The Art of Technical Trading for educational purposes.
The Trump PatternWhen Donald Trump took office in 2017, the U.S. stock market experienced dramatic fluctuations—marked by steep declines followed by eventual rebounds.
This pattern, which we'll call the "Trump Pattern," repeated itself during his presidency and is now emerging again as a point of interest for investors.
While the specific causes of these market shifts varied, key factors—particularly tariffs, inflation concerns, and Federal Reserve (FED) actions—played critical roles in the market's rise and fall during Trump’s presidency.
The Trump Pattern: The Market Fall and Recovery
🏁 1. The Start of the Trump Presidency (2017)
When Donald Trump was elected in 2016, the market responded with a combination of excitement and uncertainty. Initially, the market surged due to tax cut expectations, deregulation, and optimism about a business-friendly administration. But as Trump's presidency fully began in January 2017, concerns over trade wars and tariff policies began to dominate investor sentiment.
The market initially dipped after Trump began pursuing a protectionist trade agenda, especially with China.
As concerns about tariffs escalated, stock markets reacted negatively to potential trade wars.
💶 2. The Tariff Crisis of 2018
The first major example of the "Trump Pattern" emerged in 2018 when Trump began implementing tariffs, particularly on Chinese imports, and announced new tariffs on steel and aluminum. This caused major market disruptions.
The S&P 500 fell dramatically during this period, dropping by as much as 8.6% from its February peak in 2019.
Companies that relied heavily on international trade, like Apple, General Motors, and Ford, experienced significant stock price declines. In fact, Apple’s stock fell 9.5% on days when new tariffs were announced, as their costs for manufacturing overseas rose.
The uncertainty surrounding the global economy, combined with rising tariffs, created fears of a trade war, leading to sharp market declines.
📈 3. Market Recovery: FED Rate Cuts and Tax Cuts
Despite the tariff-induced volatility, the market didn’t stay down for long. After significant market falls, the Federal Reserve (FED) began implementing interest rate cuts to combat slowing economic growth. These actions helped stabilize the market and even fueled a rebound.
FED rate cuts made borrowing cheaper for consumers and businesses, stimulating economic activity and boosting investor confidence.
Additionally, tax cuts, a cornerstone of Trump’s economic policy, provided further support, particularly for corporations.
As a result, after the initial market drop in 2018 and early 2019, the market rebounded, continuing to climb as investors reacted positively to these fiscal and monetary policies.
🎯 The 2024 and 2025 "Trump Pattern" Emerges Again
Fast forward to 2024 and 2025, and we’re seeing echoes of the "Trump Pattern" once again. New tariffs, introduced in 2025, have reignited concerns about a trade war. These tariffs, particularly on Chinese imports, have once again caused market volatility.
The stock market has fallen in recent months due to concerns about these tariffs and the impact they might have on global trade. For example, when new tariffs were introduced in early 2025, the market saw a sharp sell-off, with the S&P 500 falling by over 1.8% in a single day.
Companies that rely on international trade, like Tesla and Ford, have seen their stock prices drop in response to concerns about increased production costs.
The broader market decline, much like in 2018, was driven by fears that tariffs could slow down the global economy and hurt corporate profits.
However, there is optimism that the same pattern will unfold, where the market eventually recovers after these initial drops.
⚠️ 4. FED Rate Cuts Again?
As inflation concerns persist, the Federal Reserve is likely to step in once again. Like previous cycles, we expect the FED to cut interest rates to stimulate the economy. This would be aimed at reducing borrowing costs, encouraging investment, and helping businesses weather the impact of higher tariffs and global uncertainty.
The FED’s actions are typically a key driver of market recovery in the "Trump Pattern." Investors have come to expect that a market downturn triggered by political or economic disruptions can be offset by the FED’s supportive monetary policies.
⚖️ Navigating the Trump Pattern: What Should Investors Do?
The "Trump Pattern" highlights that during periods of heightened uncertainty, especially due to trade policies like tariffs, the market will often experience short-term declines followed by long-term recovery. Here are a few strategies investors might want to consider:
Stay Diversified : During periods of volatility, having a diversified portfolio can help cushion against the risks posed by market swings.
Invest in Domestic Companies : Companies that rely less on international supply chains might fare better during periods of trade policy changes and tariff uncertainty.
Focus on Growth : Once the initial market decline subsides, look for sectors that stand to benefit from a recovering economy, such as tech or consumer discretionary stocks.
Look for Inflation Hedges : Given the potential for inflation, consider investments that tend to perform well during these times, such as real estate or commodities like gold.
📝 Conclusion: The Trump Pattern in Action
The "Trump Pattern" demonstrates how the market tends to react in cycles during the early months of each presidency. Typically, the market falls at the start due to the uncertainty surrounding Trump’s trade policies, particularly tariffs. However, after these initial drops, the market often rebounds thanks to FED rate cuts and other policies aimed at stimulating the economy.
Looking ahead to 2025, we're already seeing signs of this pattern in action as tariffs are back on the table and market volatility has followed. However, history suggests that patience might pay off. Once the FED steps in and cuts rates, a market rebound is likely, following the same trend we saw in 2017-2019.

Dogecoin Daily Chart Analysis: A Fresh Start Ahead ?Hello friends, let's analyze Dogecoin, a cryptocurrency, from an Elliott Wave perspective. This study uses Elliott Wave theory and structures, involving multiple possibilities. The analysis focuses on one potential scenario and is for educational purposes only, not trading advice.
We're observing the daily chart, and it appears we're nearing the end of Wave II, a correction. The red cycle degree Wave I ended around 2024 December's peak. Currently, we're nearing the end of red Wave II, which consists of black ((W)), ((X)), and ((Y)) waves. Black ((W)) and ((X)) are complete, and black ((Y)) is nearing its end.
Within black ((Y)), we have Intermediate degree blue (W), (X), and (Y) waves. Blue (W) and (X) are complete, and blue (Y) is nearing its end. Inside blue (Y), red A and B are complete, and red C is nearing its end. Once red C completes, blue (Y) will end, Once blue (Y) completes, means black ((W)) will end that means higher degree cycle wave II in red will end.
If our view remains correct, the invalidation level for this Elliott Wave count is 0.04913. If this level holds and doesn't touch below it, we can expect a significant reversal to unfold wave III towards new highs. This is an educational analysis, and I hope you've learned something by observing the chart and its texture.
I am not Sebi registered analyst.
My studies are for educational purpose only.
Please Consult your financial advisor before trading or investing.
I am not responsible for any kinds of your profits and your losses.
Most investors treat trading as a hobby because they have a full-time job doing something else.
However, If you treat trading like a business, it will pay you like a business.
If you treat like a hobby, hobbies don't pay, they cost you...!
Hope this post is helpful to community
Thanks
RK💕
Disclaimer and Risk Warning.
The analysis and discussion provided on in.tradingview.com is intended for educational purposes only and should not be relied upon for trading decisions. RK_Charts is not an investment adviser and the information provided here should not be taken as professional investment advice. Before buying or selling any investments, securities, or precious metals, it is recommended that you conduct your own due diligence. RK_Charts does not share in your profits and will not take responsibility for any losses you may incur. So Please Consult your financial advisor before trading or investing.

How Can You Use the STRAT Method in Trading?How Can You Use the STRAT Method in Trading?
The STRAT method is a unique trading approach that is supposed to simplify market analysis by breaking price action into clear, actionable scenarios. Developed by Rob Smith, it focuses on candlestick patterns, scenarios, and timeframe alignment to help traders better understand market structure. This article explores the key components of the STRAT method, its practical application, and how it can potentially refine trading strategies.
What Is the STRAT Trading Method?
The STRAT method is a trading strategy created by Rob Smith. It’s designed to simplify technical analysis by focusing on price action and breaking down market movements into clear, actionable steps. At its core, the STRAT strategy categorises price behaviour into three scenarios—inside bars (1), directional bars (2), and outside bars (3)—helping traders identify potential opportunities and understand the market structure.
One of the STRAT’s standout features is its emphasis on timeframe continuity, where traders examine how price movements align across different timeframes, such as daily, weekly, and monthly charts. This alignment helps traders gauge the broader market direction, potentially improving their analysis.
The STRAT trading method also uses specific candlestick patterns to signal potential reversals or continuations. For example, an inside bar (Scenario 1) indicates price consolidation, often preceding a breakout. A directional bar (Scenario 2) suggests trending movement, while an outside bar (Scenario 3) reflects heightened volatility by capturing both higher and lower price ranges.
Unlike some trading approaches that rely heavily on indicators, the STRAT focuses on raw price action, giving traders a clearer, no-nonsense view of market dynamics. It’s an accessible and structured way to analyse charts and make decisions based on what the market is doing right now.
Key Components of the STRAT Trading Strategy
The STRAT trading strategy stands out because of its straightforward approach to breaking down price action. As mentioned above, inside bars, directional bars, and outside bars are central scenarios. These scenarios categorise how the price behaves within a given timeframe, providing a framework for traders to interpret the market. Let’s delve into each component in detail.
Scenario 1: Inside Bar
An inside bar forms when the current candlestick's high and low remain within the range of the previous candlestick. In other words, the market is consolidating, showing no breakout beyond the prior candle’s extremes. Traders often interpret this as a pause or a moment of indecision in the market.
What makes inside bars significant is their potential to precede larger price movements. For example, after a series of inside bars, a breakout often occurs when the price breaks above or below the consolidation range. While this pattern alone doesn’t confirm direction, it signals the market is storing energy for a potential move.
Scenario 2: Directional Bar
A directional bar, also called a “2” in STRAT terminology, occurs when the price breaks either the high or low of the previous candle but not both. This creates a clear directional move—either upward (2 up) or downward (2 down).
These bars are essential because they indicate that the market has picked a direction. A “2 up” shows bullish momentum, while a “2 down” signals bearish activity. These movements are especially useful when aligned with other factors, such as larger trends or support and resistance levels.
Scenario 3: Outside Bar
The outside bar is the most volatile of the three. It forms when the current candlestick's high exceeds the previous candle’s high, and its low breaks below the previous low. Essentially, the price covers both sides of the prior range, capturing significant market activity.
Outside bars often suggest a battle between buyers and sellers, leading to volatility. These bars can provide insights into reversals or continuing trends, depending on their context within the broader market structure.
Expanding and Contracting Markets
The STRAT method also places significant emphasis on understanding the expanding and contracting market phases, which offer critical insights into market dynamics. These phases reflect shifts in volatility and price behaviour, helping traders interpret broader market conditions.
Expanding markets occur when price action creates both higher highs and lower lows compared to previous bars or ranges. This phase often signals heightened volatility as buyers and sellers battle for control, creating larger swings. Scenario 3 (outside bars) typically appears during this phase, capturing the market’s attempt to push in both directions. Expanding markets can provide potential opportunities for traders who are prepared to navigate rapid price movements.
Contracting markets, on the other hand, are characterised by shrinking ranges, with lower highs and higher lows. This consolidation phase often results in inside bars (Scenario 1) and suggests indecision or reduced momentum. Traders frequently watch for potential breakouts as the market transitions out of contraction.
Combining Scenarios and Context
Ultimately, there are many combinations of these bars under the STRAT method, each with names like the 3-2-2 Bearish Reversal, 2-2 Bearish Continuation, 1-2-2 Bullish Reversal, and so on. For traders new to this system, it might be easier to start with a handful of patterns and practice them before adding others to their arsenal.
Some of the basic starting patterns include:
2-1-2 Reversal
3-1-2 Reversal
2-1-2 Continuation
2-2 Continuation
However, each of these scenarios becomes even more meaningful when paired with other market data, such as higher timeframes or candlestick structures. For instance, patterns like hammers or shooting starts often emerge within these scenarios, offering specific signals to traders.
Timeframe Continuity: A Core Pillar
Timeframe continuity is a fundamental aspect when interpreting the STRAT candle patterns, offering traders a way to align their analysis across multiple timeframes. It’s about ensuring that the price action on smaller timeframes complements what’s happening on larger ones. When all timeframes “agree,” it can provide a clearer picture of market direction and potentially improve the decision-making process.
In practice, traders using the STRAT in stocks, forex, commodities, and other assets often look at three primary timeframes: the daily, weekly, and monthly charts. Each represents a piece of the puzzle. For example, if a trader sees a bullish “Scenario 2” (directional bar) on the daily chart, but the weekly chart shows a bearish pattern, this misalignment might signal caution. However, when the daily, weekly, and monthly timeframes all show bullish directional movement, it creates a stronger case for a trend continuation.
Timeframe continuity also helps traders filter out noise. Shorter timeframes, like the 15-minute or hourly charts, can produce conflicting signals, leading to overtrading or confusion. By focusing on the larger timeframes first, traders can ground their analysis in broader market trends and avoid reacting impulsively to minor fluctuations.
Practical Application of the STRAT Method
Applying the STRAT method involves a systematic approach to analysing charts and identifying potential opportunities. While every trader may adapt the method to their own style, the process generally follows a logical flow. Here’s how it can be broken down:
Step 1: Understanding the Current Scenario
Traders typically start by identifying the active scenario (1, 2, or 3) on their chosen timeframe. This initial classification helps to set the context. For instance, in the EUR/USD daily chart above, we initially see an outside bar (Scenario 3), followed by two inside bars (Scenario 1)—a 3-1-1 Bullish Reversal pattern; this transitions into a 1-2 Bullish Reversal before a 2-2 Bullish Continuation. In other words, the market is seen as entering a bullish phase.
Step 2: Aligning Multiple Timeframes
The next step involves assessing how the current scenario fits within the larger market structure by checking higher timeframes. In the EUR/USD example, the monthly chart shows three consecutive bullish directional bars (Scenario 2), also known as a 2-2 Bullish Continuation. This is supported by the weekly chart. Initially, there are two bearish directional bars before a bullish outside bar (Scenario 3) and a bullish directional bar. This indicates an alignment of bullish momentum, indicating a higher probability for the daily chart setup.
Step 3: Identifying Supporting Patterns and Signals
Within the scenario, specific candlestick patterns, like hammers or shooting stars, alongside key support and resistance levels, often provide additional context. These signals are believed to be more effective when they align with the broader market direction and timeframe continuity.
In the EUR/USD example, the weekly chart shows a candle resembling a hammer (the outside bar), while the daily chart shows a pattern resembling a Three Stars in the South formation (the 3, 1, 1 candles). While rare, the three stars in the south pattern can signal sellers are losing momentum, when:
The first candle features a long body and long lower wick.
The second candle has a shorter body and closes above the first candle’s low.
The third candle has another short body with minimal wicks and a range inside the second candle.
While both formations don’t meet the technical criteria for their respective patterns, a trader might consider them to add weight to the bullish idea. The weekly chart also shows the price breaking past a previous resistance level, which adds confluence.
Step 4: Entering and Exiting
A trader would typically enter as the candle on their chosen timeframe closes. A stop loss could be set beyond the entry candle or a nearby swing high/low. Some traders prefer to close the position depending on the next candle close and corresponding scenario, while others might target a particular support/resistance level or use multi-timeframe analysis to find a suitable exit point.
Advantages and Challenges of the STRAT Method
The STRAT method offers a unique, structured approach to trading, but like any strategy, it comes with both advantages and challenges. Understanding these can help traders decide how to integrate it into their approach.
Advantages
- Clarity in Analysis: By categorising price action into simple scenarios, the STRAT’s patterns simplify market behaviour, reducing ambiguity.
- Focus on Price Action: The method relies on raw price data rather than indicators, offering a direct view of market dynamics.
- Adaptability Across Markets: Whether trading equities, forex, or commodities, the STRAT applies universally to any market with candlestick data.
- Improved Consistency: Its rules-based framework helps traders avoid impulsive decisions and stay aligned with their analysis.
Challenges
- Learning Curve: Understanding the nuances of scenarios and timeframe continuity requires time and practice.
- Patience Required: Waiting for alignment across multiple timeframes may lead to fewer trade opportunities, which may frustrate active traders.
- Context Dependency: While structured, the STRAT still requires interpretation, and outcomes depend on how well traders incorporate broader market factors.
The Bottom Line
The STRAT method offers traders a structured way to analyse price action, combining scenarios, candlestick patterns, and timeframe continuity to navigate markets with confidence. While it requires discipline to master, its clear framework can potentially improve decision-making.
FAQ
What Is the STRAT Strategy by Rob Smith?
Rob Smith developed the STRAT strategy, a trading method that simplifies technical analysis by categorising price action into three STRAT candle scenarios: inside bars, directional bars, and outside bars. It focuses on understanding market structure, using timeframe continuity and actionable signals to interpret trends and reversals.
What Is the STRAT Method of Trading?
The STRAT method is a rules-based approach to trading that prioritises price action over indicators. It uses specific candlestick patterns and scenarios to identify potential trading opportunities and aligns multiple timeframes to provide a cohesive market view.
What Is a Rev Strat?
According to Rob Smith, a “rev strat” refers to particular setups. First is a 1-2-2, initially with an inside bar, then a directional bar in one direction, and finally a directional bar in the opposite direction, marking a possible reversal. The second is a 1-3 setup, with an inside bar followed by an outside bar. This signals an expanding market in the STRAT, meaning a period of heightened volatility, and is considered bullish or bearish based on the outside bar’s direction.
This article represents the opinion of the Companies operating under the FXOpen brand only. It is not to be construed as an offer, solicitation, or recommendation with respect to products and services provided by the Companies operating under the FXOpen brand, nor is it to be considered financial advice.

Trump’s Tariffs & the Silent Setup — Why This Could Be Bigger ?Hello Traders 🐺
I hope you enjoyed yesterday’s Black Monday 😂 because honestly, it was brutal for all investors.
But corrections like this are always necessary — and I want to talk about that in this idea with a bit more detail.
Also, I’ll update you on the current situation of BTC.D, because as I told you in my last update, the market is about to create a bear trap on the BTC.D chart.
I already shared the proof for this prediction before the dump — you can check it here:
So now, let’s talk about the economic reason behind the dump, and then I’ll go over the technical side of the chart.
This idea I’ll explain how we can use macroeconomic data in our trading decisions.
So make sure to read it carefully and see how you can apply it to your strategy ✅
Do deep corrections always mean danger?
Not necessarily.
Let’s go back and remember some of the biggest crashes in financial history —
The COVID dump or even the famous Black Monday.
If you ask yourself now, “What was the smartest move back then?”
You’ll probably say:
Buy. Accumulate. Because that was the bottom — and we never saw those prices again.
And guess what?
The current state of the market is no different.
So why do I believe Trump’s new tariff policy could actually be bullish?
Let me break it down simply for you:
🔥 The Tariff War: Why it started
For years, most countries had easy access to the U.S. consumer market — the largest in the world — with little or no tariffs.
But U.S. manufacturers didn’t enjoy the same freedom when exporting abroad — they faced heavy tariffs, while also struggling with intense competition inside their own borders due to lack of import restrictions.
So what happened?
✅ The new tariffs brought two key benefits:
1️⃣ Forced negotiations:
Other countries now have to either remove or reduce their own export tariffs to keep trading with the U.S.,
or else they lose access to a market that’s extremely consumption-driven.
2️⃣ Advantage to U.S. domestic production:
If foreign exporters lose access, U.S. producers finally get room to breathe,
and can grow competitively inside their own market.
💰 What happened after tariff fears hit?
In the past month, markets reacted with fear.
A massive amount of capital flew out of financial markets and inflation-hedged assets,
the dollar strengthened, and recession fears grew.
But here’s the twist...
What if Trump had started printing money before this shakeout?
If liquidity was still high, printing more would’ve:
Crushed the dollar
Destroyed consumer buying power
Sparked inflation again
But right now, after money has already been squeezed out of markets and the dollar is strong,
the Fed has a clean path to restart QE (quantitative easing) without tanking the dollar’s value.
So what's next?
Lower interest rates, stimulus packages, subsidies — all will likely come soon.
This time, Trump can inject liquidity exactly where he wants it to go:
Straight into U.S. industry, not into meme coins and junk assets.
With fewer export tariffs, American factories will be more competitive,
U.S. exports could rise, and the country will rely less on foreign production.
And what does this mean for the markets?
Simple.
Once the Fed pivots back to easing, markets will react violently to the upside.
So, as I always say:
Don’t waste this opportunity. Use these prices wisely.
now let's come back into the chart :
As I told you before , BTC.D now is testing the blue monthly resistance line and also hit the rising wedge upward resistance line and in my opinion there is a big chance to see a massive bull market incoming...
I hope you find this idea valuable and as always remember :
🐺 Discipline is rarely enjoyable , but almost always profitable 🐺
🐺 KIU_COIN 🐺

Tutorial on how I use stoch few other tricksVideo on how I use stoch 15 Min daily weekly
few other TA tricks hope u enjoy

TESLA Always Pay YOURSELF! Tsla Stock were you PAID? GOLD Lesson
⭐️I want to go into depth regarding the this topic but it is a long one with PROS & CONS for doing and not doing it.
Every trader must choose what's best for them but you will SEE when I finally get to the write up that MANY OF THE PROS are NOT FINANCIAL but PSYCHOLOGICAL❗️
Another of 🟢SeekingPips🟢 KEY RULES!
⚠️ Always Pay YOURSELF.⚠️
I know some of you chose to HOLD ONTO EVERYTHING and place your STOP at the base of the WEEKLY CANDLE we entered on or the week priors base.
If you did that and it was in your plan GREAT but... if it was NOT that is a TRADING MISTAKE and You need to UPDATE YOUR JOURNAL NOW.
You need to note EVERYTHING. What you wanted to see before your exit, explain why not taking anything was justified to you, were there EARLY exit signals that you did not act on. EVERYTHING.
🟢SeekingPips🟢 ALWAYS SAYS THE BEST TRADING BOOK YOU WILL EVER READ WILL BE YOUR COMPLETE & HONEST TRADING JOURNAL ⚠️
📉When you read it in black amd white you will have YOUR OWN RECORD of your BEST trades and TRADING TRIUMPHS and your WORST TRADES and TRADING ERRORS.📈
✅️ KEEPING an UPTO DATE JOURNAL is STEP ONE.
STUDYING IT IS JUST AS IMPORTANT👍
⭐️🌟⭐️🌟⭐️A sneak peek of the LESSON after will be HOW & WHEN TO ENTER WHEN THE OPEN BAR IS GOING THE OPPOSITE WAY OF YOUR IDEA.👌
🚥Looking at the TESLA CHART ABOVE you will see that we were interested in being a BUYER when the weekly bar was BEARISH (GREEN ARROW) and we started to consider TAKE PROFITS and EXITS when the (RED ARROW) Weekly bar was still BULLISH.🚥

A Practical Framework for Overcoming Fear in Trading“Fear is not real. The only place that fear can exist is in our thoughts of the future. It is a product of our imagination, causing us to fear things that do not at present and may not ever exist. Do not misunderstand me, danger is very real, but fear is a choice.” - Will Smith, After Earth
Although I firmly agree with this statement, I also have to acknowledge that while fear is a choice, it’s also a biological response to perceived threats like uncertainty, lack of control, and experience.
When faced with these threats the brain activates the amygdala which triggers the fight or flight response releasing hormones like cortisol and adrenaline, preparing the body to respond quickly and instinctively.
If left alone, traders consumed with fear will either seek to take vengeance against the markets, typically referred to as “Revenge Trading” or they’ll hesitate when taking the next position fearing that it would be a repeat of the last. Either way, it never ends well.
In today’s article we’re going to be breaking down fear both figuratively and literally, by gaining a deeper understanding on how it works and what steps we should take to overcome it.
Three Types of Fears in Trading:
Now I’m sure most of you reading this article are familiar with the three types of fears related to trading, so I’ll go through these quite briefly but for those of you who might not be that familiar I’ll leave a short explanation for each of the fears highlighted.
Fear of Missing Out (FOMO):
The apprehension of missing profitable opportunities leads traders to enter trades impulsively without proper analysis, often resulting in poor outcomes. Traders experiencing FOMO generally find themselves in trading signal groups or rely on social media for direction, see my previous article on Trading Vs. Social Media
Fear of Losing Money:
The anxiety associated with potential financial loss can cause traders to exit positions prematurely or avoid taking necessary risks. This fear is closely linked to loss aversion, where the pain of losing is felt more intensely than the pleasure of equivalent gains.
Fear of Being Wrong:
The discomfort of making incorrect decisions can deter traders from executing trades or cause them to hold onto losing positions in an attempt to prove their initial decision was right.
In many respects, traders try to deal with these fears directly but usually without much success. This is because they’re treating the symptom but not the cause.
In order to deal with any of these fears either independently or collectively you’d need to first learn to become comfortable in three very specific areas.
Uncertainty - At its core, trading is a game of probabilities, not certainties. Certainty in trading comes only when you’re able to shift your focus from the outcome of any one trade to your ability to take any one trade regardless of the outcome. Remember, it's not your job to predict the future, rather you should prepare for it.
Past Losses - The outcome of one trade has absolutely no impact on the outcome of the next, and the best way to deal with past losses is to embrace the lessons that came with it.
Lack of Control - Although we cannot control the outcome of a trade, we do control the type of trade we take. We can control when we enter, exit, and how much we risk, which when examined closely carries far more significance than merely seeking to control the outcome.
Debunking The Biggest Myth In Trading
If you won then you were right, if you lost then you were wrong. This is the biggest myth in trading today and one of the main reasons why so many traders chose being right over being profitable.
Instead of accepting a loss, they’ll remove whatever stop loss they had in place in the hope that the market will eventually turn in their favor, refusing to accept that they may have been wrong.
There are very good reasons for this type of behaviour which is tied directly to our identity, social belonging and self-worth. When we’re faced with the possibility of being wrong our intellect, competency and self-image is challenged.
In order to protect ourselves from this challenge, we begin to resist any new information that could conflict or even threaten our existing belief, creating discomfort even when the evidence is clear.
This can trigger emotions like anxiety and avoidance behaviour which can show up in the form of hesitation, overthinking, or avoiding placing trades altogether. However, I’m about to share a framework with you that will help you overcome the fear of being wrong and instead of avoiding it, if you follow this framework, you’ll begin to embrace it.
3 Step Process To Profit From Being Wrong
In trading Losses are inevitable. In fact, some of the most successful traders lose far more times than they actually win, and yet they’re still able to make money. This is because you don’t need to be a winning trader in order to be a profitable one.
It’s under this principle that you’ll apply the 3 step process to profit from being wrong.
1. Reframe “Wrong” as “Feedback”
Generally being wrong comes with consequences, in trading those consequences comes in the form of losses. However, you determine how much you’re willing to lose on any given trade. This means that because you control how much you’re willing to lose, you ultimately control the consequences.
The market is a nearly endless pool of trade opportunities and no one trade can determine the outcome of the next. Therefore, a losing trade cannot mean you were wrong, because as long as you still have capital to trade there is another opportunity lining up.
Instead, what the losing trade does uncover is the market conditions in relation to your plan. It’s at this point where you review your initial analysis and see if anything has changed. If nothing changed, then it's likely you may have gotten in a bit too early and you’d just have to wait for the next setup.
However, upon your review, you discover the market conditions have changed, and you now have to re-evaluate your approach, then this is the feedback the market is giving you. This is what it means to take feedback from the markets and this is what it takes to be profitable instead of being right.
2. Separate Identity From Outcome
The mistake many trades tend to make is measuring their success on the outcome of a trade. This is a recipe for disaster because in order for them to feel successful they’d have to win every single time.
This of course is impossible, instead I’d encourage you to separate yourself from the outcome of the trade and focus on just trading. There are only one of three outcomes you can experience in a trade. 1. Loss, 2. Win, 3. Breakeven. When you’re able to accept 1. Loss then you don’t have to worry about numbers 2,3.
Because you control how much you’re willing to lose you should be able to accept what you’re willing to lose, and by accepting what you're willing to lose you’ve then separated yourself from the outcome of the trade and you can now focus on just trading.
To keep you in check with this step here is a very simple but highly effective practice:
✅ Practice saying: “This was a good trade with a bad outcome — and that’s okay.”
3. Celebrate The Process, Not Perfection
“That which gets rewarded gets repeated” If you’re only rewarding yourself when you close a winning trade then you’re simply reinforcing the notion of viewing the markets through the lens of right and wrong.
As we’ve already discovered this view is detrimental to your longevity as a trader and so I would argue that instead of celebrating a winning trade, celebrate your process. Reward yourself every time you follow your plan regardless if the trade resulted in a win, loss or breakeven.
This approach will help you improve your process which in turn will improve your overall returns and performance.
Conclusion
📣 You are not here to be perfect. You’re here to grow, to learn, and to keep showing up — fear and all.
The market rewards the trader who is calm under pressure, humble in defeat and focused on the long game.
Go into this week knowing that fear may still show up — but you’re more prepared than ever to handle it.
Let fear be a signal, not a stop sign.
You've got this. 🚀

Careful Trusting "News" | Fake News TradingOn Monday, April 7th, 2025 amidst incredible market volatility, you'd expect your most trusted news outlet to report on-the-minute news. But most importantly, accurate news .
With the markets down nearly 20% in ~4 trading days, every piece of information matters. But with the age of fast (social) media, news outlets will do anything possible to be the first to report. Even .... posting fake news. The way this works is they get news that's "probably true", they post it, then it's verified to be true. This may work often for them and when it doesn't, nobody really cares. But when you're talking about times of volatility unseen since COVID, all this nonsense gets exposed.
So - at roughly 10:10 AM EST, CNBC reported that there will be a "90-day pause on tariffs". A ground-breaking report that likely caused John Doe to buy $10M in NASDAQ:NVDA calls dated end of July because that's a no-brainer right? It surely cannot be false since CNBC is his go-to trusted news-source and there is just NO WAY that they would ever post any news without being 100% true and verified. ESPECIALLY news about TARIFFS -- the talk of the town (psh, the world actually) at the moment. 90 day pause? That's not something you report lightly. You know the ripple effect that'll have on the markets.
Result of that news report? The markets (e.g. CME_MINI:NQ1! ) jumped 6.60% in under 10 minutes.
Jane Doe likely saw that jump, looked at that news, and rebought her shares that she sold at the bottom earlier this morning.
Surely that news cannot be fake. It's a 90-day tariff pause. That's huge. Surely the White House will see "Yeah baby! We take credit for that".
Nope, at roughly 10:18 AM EST, the same CNBC reported that, "the 90-day pause on tariffs was fake news according to the White House". Results? Market right back down -6.5% in 20 minutes.
Suppose you FOMO'd into AMEX:SPY NASDAQ:QQQ calls.. well, you lost almost everything depending on the strike and date. In this market, manage your RISK and always hedge. Don't forget to thank CNBC, your most trusted news-source for that capital gain loss.
Welcome to trading in 2025. The age of report-first, verify-later. Welcome home.
Be careful listening to the news and take everything they say with a grain of salt. And as always, don't chase the news. KD out.

Wall Street's Difficulties: How It Impacts the Forex Market
Hello, I am Andrea Russo, Forex Trader, and today I want to discuss how the recent difficulties on Wall Street are influencing the global forex market.
The Storm on Wall Street
In recent days, Wall Street has experienced significant turbulence, with major indices sharply declining. This scenario has been driven by several factors, including:
Rising Interest Rates in the U.S.: The Federal Reserve, concerned about persistent inflation, has hinted at potential monetary tightening.
Geopolitical Tensions: Global uncertainties are unsettling investors and reducing risk appetite.
Signs of Economic Slowdown: Recent macroeconomic data have fueled fears of an imminent recession.
These elements have resulted in a decline in investor confidence, leading to heavy sell-offs in equity markets.
Effects on the Forex Market
The repercussions of this turbulence are already manifesting in the forex market. Here are the key implications:
Strengthening of the U.S. Dollar: The dollar has gained momentum as a safe-haven currency, particularly against emerging market currencies like the Brazilian real and Turkish lira.
Japanese Yen and Swiss Franc Rising: These haven currencies have seen increased demand, drawing monetary flows.
Pressure on Emerging Market Currencies: Reduced risk appetite has triggered sell-offs in the major currencies of emerging markets.
What Should Forex Traders Do Now?
In such a volatile environment, it's crucial for traders to:
Analyze the Data: Keep a close watch on U.S. economic indicators and Federal Reserve announcements.
Diversify Risk: Consider hedging strategies to reduce exposure to volatility.
Observe Safe Havens: Explore trading opportunities involving the yen and Swiss franc, which remain stable during uncertainty.

What’s the Most Valuable Token in the Crypto World?Hello and greetings to all the crypto enthusiasts,✌
Spend 3 minutes ⏰ reading this educational material. The main points are summarized in 3 clear lines at the end 📋 This will help you level up your understanding of the market 📊 and Bitcoin💰.
🎯 Analytical Insight on Bitcoin: A Personal Perspective:
Regarding the movement of the Bitcoin market, I'll briefly mention that the price is currently near a very strong monthly support, which I’ve marked on the chart for you. I believe now is not the time to break this support, and the price will likely retest it. I foresee at least a 10% increase from here, with a short-term target of $83,000. 📈
Now, let's dive into the educational section, which builds upon last week's lesson (linked in the tags of this analysis). Many of you have been eagerly waiting for this, as I have received multiple messages about it on Telegram.
What’s the Most Valuable Token in the Crypto World?
If we were to simplify things, one could argue that the most important token in the world of crypto is... the Gold Token.
Yes — a digital representation of gold itself. 🪙✨
Why Gold, and Why Now?
With the return of Donald Trump to the presidency of the United States, global markets are likely to face renewed uncertainty and directional shifts. Historically, political shake-ups like this have had a profound effect on financial systems, commodity prices, and investor sentiment.
In times of unpredictability, gold has always been a safe haven. It's trusted, time-tested, and globally valued. That’s why it makes sense for investors to allocate a portion of their capital to gold — especially now.
But what if you didn’t have to deal with storing physical gold? What if you could hold it digitally, within the same crypto ecosystem you’re already familiar with? That’s where gold-backed tokens come into play.
What Are Gold Tokens? 🌐
Gold tokens are digital assets built on blockchain networks (typically Ethereum) and backed by real, physical gold held in secure vaults. These tokens offer a modern bridge between traditional wealth preservation and decentralized finance.
They’re designed to let users enjoy the benefits of gold investment — without the inconvenience of owning, storing, or securing physical bars.
Key Features of Gold-Backed Tokens:
🔹 Real Asset Backing: Each token typically represents a fixed amount of gold (like 1 gram or 1 troy ounce).
🔹 Transparency & Security: Since they're built on blockchain, transactions are traceable, secure, and publicly verifiable.
🔹 Redeemability: Some platforms allow users to exchange their tokens for physical gold if identity verification conditions are met.
🔹 Liquidity: Unlike physical gold, these tokens can be traded instantly on major crypto exchanges.
🔹 Divisibility: You can own fractions of an ounce — making gold more accessible than ever.
Leading Gold Tokens to Know About:
Here are three of the most recognized gold-backed tokens in the crypto market:
PAX Gold (PAXG) : 1 token = 1 ounce of London Good Delivery gold
Tether Gold (XAUT) : Issued by the same company behind USDT, backed by Swiss vault gold
AurusGOLD (AWG) : A decentralized token fully backed by gold, built on Ethereum
Let’s focus on the two most dominant players: PAXG and XAUT.
1. PAX Gold (PAXG) 🏛
Issuer: Paxos Trust Company, regulated by the New York Department of Financial Services
Backing: Each token equals 1 troy ounce (≈31.1g) of high-purity gold stored in secure London vaults
✅ Users can redeem for physical gold
✅ Supports micro-investments — ideal for beginners
✅ Full transparency: Regular audits and proof of reserves
✅ Traded on top-tier exchanges like Binance, Kraken, and Coinbase
Why people trust PAXG:
Its regulatory status and institutional backing make it one of the most secure ways to gain gold exposure in the crypto world.
2. Tether Gold (XAUT) 🇨🇭
Issuer: Tether, the company behind the widely used USDT stablecoin
Backing: 1 token equals 1 ounce of physical gold held in Swiss vaults
🔐 Focuses heavily on privacy and robust asset protection
🔁 Tokens are redeemable for physical gold by verified users
📉 Less transparent than PAXG in terms of regulation and audit trails
💹 Listed on popular platforms like Bitfinex
Worth noting:
Despite Tether’s past controversies around asset disclosures, XAUT remains popular due to its ease of use and the strong brand behind it.
Which One Should You Choose?
If regulation and transparency matter most to you, PAXG may be the better fit. It’s trusted by institutions, backed by U.S. regulators, and offers detailed audits of gold reserves.
If you value brand recognition and a more flexible approach, XAUT offers a credible alternative — just be aware of the differences in oversight.
Final Thoughts 💼🪙
Gold-backed tokens combine the timeless value of gold with the flexibility and innovation of blockchain. They're an excellent way to hedge against economic uncertainty without stepping outside the crypto ecosystem.
If you’re building a diversified portfolio, allocating a portion of your investment to digital gold could be a smart move — both for stability and long-term value.
Let your crypto holdings shine with a touch of gold. 🌟
However , this analysis should be seen as a personal viewpoint, not as financial advice ⚠️. The crypto market carries high risks 📉, so always conduct your own research before making investment decisions. That being said, please take note of the disclaimer section at the bottom of each post for further details 📜✅.
🧨 Our team's main opinion is: 🧨
Gold-backed tokens, like PAXG and XAUT, let you invest in gold digitally without the hassle of storing physical gold. They’re built on blockchain, offering transparency, security, and easy trading. PAXG is more regulated, making it ideal for cautious investors, while XAUT offers privacy and is backed by Tether, a big name in crypto. These tokens represent real gold and can be redeemed for it. If you're looking to diversify and hedge against economic uncertainty, they’re a solid option in your portfolio.
Give me some energy !!
✨We invest countless hours researching opportunities and crafting valuable ideas. Your support means the world to us! If you have any questions, feel free to drop them in the comment box.
Cheers, Mad Whale. 🐋

Candlestick Pattern Trading: Reading the Market in ColorHello, traders!
Let’s face it — price charts can feel overwhelming at first. Red. Green. Wicks. Shadows. Bodies. It’s like abstract art for traders. But once you understand candlestick pattern trading, you’ll start to see structure in the chaos—and maybe even profit from it.
Candlestick patterns are one of the most popular tools in technical analysis. They don’t just show price data; they tell a story about market sentiment. Whether you’re a beginner or an experienced trader, knowing your candlestick pattern chart basics is essential. So, grab your coffee (or matcha, we don't judge), and let’s break this down.
What Is a Candlestick Pattern?
A candlestick pattern is a visual formation that appears on a price chart and helps traders predict future market movement based on past price behavior. Each candle represents the open, high, low, and close price for a specific time frame.
When grouped, candlestick chart patterns help traders spot potential reversals, continuations, and areas of indecision. These formations work across all time frames and are used in stocks, crypto, and forex – you name it.
Candles don’t just represent price; they reflect emotion. Greed. Fear. FOMO. Panic selling. It’s all there in the pattern candlestick formations. Learning to read them is like learning a new language—except this one helps you protect your capital.
Whether you're a scalper or a swing trader, the best part of candlestick pattern trading is that it gives you context. It shows who’s in control — buyers or sellers— and offers clues on what might come next.
Candlestick Patterns Cheat Sheet for Cryptomarkets
To help you better navigate, here's a handy visual reference that breaks down key candlestick chart patterns by category: bullish, bearish, and neutral. Whether you're spotting a potential reversal or riding a continuation, this cheat sheet covers some of the most reliable formations used in candlestick pattern trading.
🔵 Bullish Patterns (Reversal & Continuation)
These patterns typically appear at the bottom of a downtrend and signal potential upside momentum.
Key Bullish Patterns Shown Include:
Hammer and Inverted Hammer – Reversal patterns that signal buyer strength.
Bullish Engulfing, Morning Star, and Tweezer Bottom – These are Strong indications of a trend reversal.
Rising Three Methods, Bullish Three Line Strike, and Bullish Mat Hold – Continuation patterns that suggest a bullish trend is likely to resume.
🔴 Bearish Patterns (Reversal & Continuation)
Found at the top of uptrends, these patterns often warn of downward pressure:
Hanging Man and Shooting Star – Classic bearish reversals.
Bearish Engulfing, Evening Star, and Tweezer Top – Indicate a shift from bullish to bearish control.
Falling Three Methods, Bearish Three Line Strike, and Bearish Mat Hold – Patterns that imply the downtrend is resuming after a pause.
🟠 Neutral Patterns
These patterns signal indecision in the market and require confirmation:
Doji – A candle where the open and close are nearly the same, reflecting balance.
Gravestone Doji and Dragonfly – Unique forms of the Doji that lean toward reversals depending on their position.
This cheat sheet is a great visual companion for understanding candlestick pattern charts at a glance — especially useful in fast-moving markets like crypto.
Final Thoughts: Learn the Language of the Market
Candlestick pattern trading is like learning to read between the lines—but in chart form. Once you recognize the key candlestick chart patterns, you’ll stop guessing and start interpreting what the market is really trying to say.
So, next time you open a chart, don’t just stare at it. Ask questions:
❓ Is that a bullish candlestick pattern forming?
❓ Is this a breakout or a trap?
❓ Is the candlestick flag pattern just pausing, or is momentum dying?
When you start seeing candles not as just red and green bars but as signals of crowd behavior… well, that’s when the magic begins.
Have a favorite candlestick pattern chart setup you swear by? Drop it in the comments, and let’s compare notes. 🔥

Easy tricks to master you mind during correctionsHello,
The markets have been correcting, and fear seems to be creeping in. What most investors fail to understand is that big corrections such as this are the best opportunities handed to them. This is the best time to buy since markets are trading at the bottom. Additionally, for this time earnings season is about to kick in while this time the market is trading at the bottom. We compiled a few things that can help you remain composed in the current market environment.
A transformative book I would recommend is Trading in the Zone by Mark Douglas. Douglas brilliantly compares elite traders to world-class athletes, revealing that both achieve greatness not through luck, but through rigorous mental discipline and robust, repeatable systems. To guide you toward this coveted "zone" of peak performance, here are four indispensable strategies:
Craft a Rock-Solid Trading Plan
A well-defined trading plan is your compass in the chaotic wilderness of the markets. It spells out precise conditions for entering trades, selecting opportunities, and exiting positions. By faithfully following this blueprint, you anchor yourself in accountability, sidestepping the pitfalls of reckless, emotion-driven moves.
Maintain a Detailed Trading Journal
Think of your trading journal as a mirror reflecting your journey. Record every trade, emotion, and market insight. This disciplined habit empowers you to evaluate your performance, pinpoint weaknesses, and sharpen your approach—unlocking a deeper understanding of your own psychological triggers.
Cultivate Confidence Through Realistic Goals
Confidence isn’t bravado—it’s the quiet strength to take calculated risks and embrace the results. Build it by practicing on a demo account with the seriousness of real stakes, setting attainable targets, and celebrating small wins. This foundation turns uncertainty into opportunity.
Master the Art of Risk Management
In trading, protecting your capital is paramount. Embrace proven techniques like setting risk/reward ratios, deploying stop losses, and sizing positions sensibly. These habits don’t just shield you from ruin—they pave the way for consistent, long-term gains.
With the above rules we believe you should be able to invest or remain invested during these volatile moments. Again, remember the tariffs that have been set are the ceiling and we expect concessions to come once negotiations between countries begin.
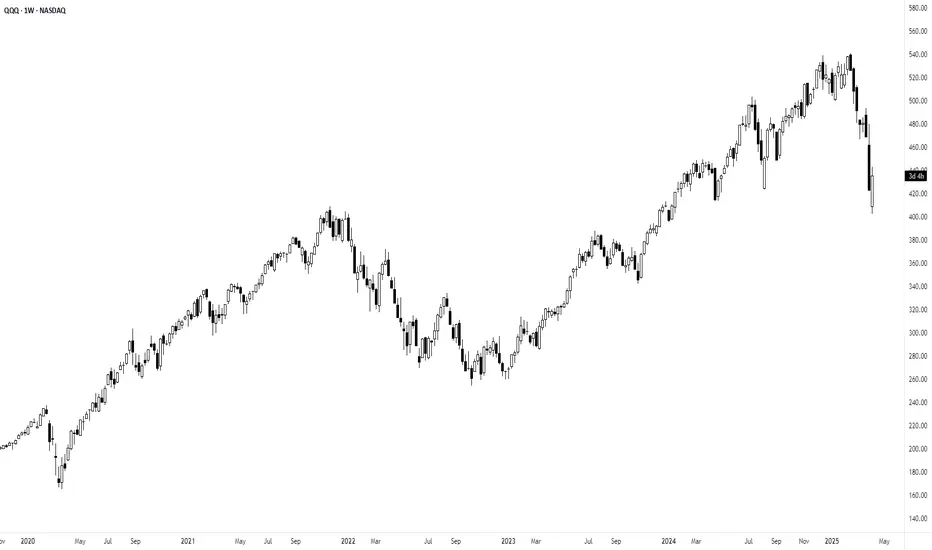
Good luck and stay invested. As shown in the chart, this is not the first time the market is undergoing a significant correction. What's clear is that markets always recover from corrections and continue pushing higher. This further reinforces our conviction that this are the best times to begin buying.
Disclosure: I am part of Trade Nation's Influencer program and receive a monthly fee for using their TradingView charts in my analysis.

There's a Time to Trade and a Time to Watch Lately, the market has been in chaos – indices are dropping like there’s no tomorrow, and when it comes to Gold, what used to be a normal fluctuation of 100 pips has now turned into a 500-pip swing. In such a volatile environment, many traders feel compelled to be constantly active, believing that more trades mean more profit. But the truth is, there’s a time to trade and a time to watch.
Conservation of Capital is Essential 💰
The best traders understand that their capital is their lifeline. It’s not about making trades; it’s about making the right trades.
The market doesn’t reward effort; it rewards patience and precision.
Instead of jumping into mediocre setups, learn to appreciate the value of patience .
Every time you enter a trade that doesn’t meet your criteria, you risk your capital unnecessarily. And every loss chips away at your ability to capitalize on the real opportunities when they come. Capital preservation should be your priority.
Focus Only on A+ Signals 📌
Not every setup is worth your time and money. The goal should be to only enter positions that offer a clear edge – signals that you’ve identified as high-probability opportunities through your experience and strategy.
A + setups are those that offer:
• A clear technical pattern or setup you've mastered.
• A favorable risk-to-reward ratio, ideally 3:1 or better.
• Alignment with your overall strategy and market context.
If these criteria aren't met, it’s often better to do nothing. Waiting for the right setup and market conditions is part of the game.
The Power of Doing Nothing 🤫
Inaction is a skill. It requires discipline to avoid the urge to "force" trades. But the market will always be there tomorrow , and so will the opportunities.
By learning to watch rather than trade during uncertain or suboptimal conditions, you avoid unnecessary losses and conserve your capital for when the market truly presents an edge.
Conclusion 🚀
Trading is about quality, not quantity. Respect your capital and recognize that sometimes, the smartest move is to wait. Let the market be clear.
Remember, there’s a time to trade and a time to watch. Master this balance, and you’ll be miles ahead of most traders.

RSI + BB strategy - the strong duo you will ever need to win Hello traders!
This article shares with you a strategy employing two famous indicators that have stood the test of time and used by professionals and amateurs alike. A solid trading plan needs at least one solid strategy which will be your bread and butter. You can always add more strategies or game plans to your repertoire but you need to master one. Trading can be as complicated or simple as you make it. To make sense of it all, you should always try to be realistic and stick to a trading plan which is "simple and stupid" so that you free your mind from overthinking and focus on the market movements instead. A good strategy, along with constant market trend analysis, good risk management, news awareness and emotion control can ultimately transition you to being a consistent profitable trader. Indeed, there are times where the odds will not be in your favour and you will have losing trades. However, the key to success is to think of trading as a game of probability and developing a winning edge that ensures you are profiting more than losing. A 1:2 RRR is the least you have to accept when entering a trade, else sit tight and wait for the next opportunity. As Jesse Livermore quoted, "It never was my thinking that made the big money for me. It always was my sitting. Got that? My sitting tight!".
RSI
Developed by J. Welles Wilder Jr. In 1978, the relative strength index is a momentum indicator that measures the speed and magnitude of price changes. At 70+, RSI is considered overbought and a retracement in price may occur. At 30-, RSI is considered oversold and price may go up. The middle line is the mean of recent prices, usually during a 14 days period.
BB
Developed by John Bollinger much later in the 1980s, BB is a volatility indicator which measures the speed and extent of price changes. A wider band signals high volatility and a narrow band signals low volatility. When price reaches the upper band, the asset is considered overbought and price may retract. When price reaches the lower band, the asset is considered oversold, meaning there are less and less sellers in the market and price may go up. The middle line is usually a simple moving average, showing the mean price across a time period.
RSI + BB strategy
The combination relies, and truthfully so, on the fact that the price of an asset usually hovers around its mean. Unless there are significant macroeconomic changes and news are strong (ultimately forming a new trend), price does not deviate much from its mean. It continues and builds its existing trend and moves up and down the moving average. By meauring both the momentum and volatility of the price, while keeping an eye on the direction of the trend, a trader can place small trades with a minimum 1:2 RRR as the asset moves in a range, an uptrend or a downtrend. The indicators give you insight on where to buy and place your SL and TP.
Trading set ups
- RSI 70+, BB touching upper band, no news, BB horizontal (showing a ranging market), price at major resistance zone - sell because price is likely to move through the moving average towards to lower band
- RSI 30-, BB touching lower band, no news, BB horizontal (showing a ranging market), price at major support zone- buy because price is likely to move through the moving average towards to upper band
- RSI 70+, BB touching upper band (price climbing up the BB ladder), BB moving upwards (uptrend), strong good news - buy because price is in uptrend and trend is likely to continue
- RSI 30-, BB touching lower band (price falling off the BB cliff), strong bad news - sell because price is in downtrend and trend is likely to continue
Sitting tight
-Playing on a 1hr timeframe, there won't be many instances when all these stars align. That is when you sit tight and wait.
- When price is hovering in between the RSI grid and BB band - sit tight and wait because the odds are not in your favour and it is impossible to predict which way price will move. Let the market do its thing, protect your capital and wait for the market to show you what to do next.
Note
- When the conditions are met, always enter the trade as soon as you get confirmation. If you are late in entry, skip the trade and wait
- Place your SL just above the upper BB if selling or just below the lower BB if buying
- TP is essential so you can lock in profits, especially in ranging markets where price quickly touches the BB band and bounces back. If you are in a trade and not able to monitor it, a TP ensures you have closed your trade at your desired and predicted price. TP is placed close to the lower band if selling or close to the upper band if buying
-Ensure that all your other criteria such as news, RRR and emotion control are met to enter a trade. If one is not met, this trade is not for you.
- Familiarise yourself using alerts. You have to be able to be present when the opportunity presents itself. Tradingview's lowest paid plan gives you 20 alerts, which is more than sufficient if you are focusing on 4-5 assets only. Alerts add to your winning edge and enable you to be trading the best set ups when they form.
Please do not hesitate to share your thoughts if you do use RSI and/or BB and have had positive outcomes. :)
GL to all!

Position Sizing StrategiesPosition sizing is one of the most important aspects in risk management for traders. Proper position sizing helps manage the risk effectively by maximizing profits and limiting the losses. In this publication, we will explore popular position sizing strategies and how to implement them in pinescript strategies
🎲 Importance of Position Sizing in Trading
Let's take an example to demonstrate the importance of position sizing. You have a very good strategy that gives you win on 70% of the times with risk reward of 1:1. If you start trading with this strategy with all your funds tied into a single trade, you have the risk of losing most of your fund in the first few trades and even with 70% win rate at later point of time, you may not be able to recoup the losses. In such scenarios, intelligent position sizing based on the events will help minimize the loss. In this tutorial, let us discuss some of those methods along with appropriate scenarios where that can be used.
🎲 Position Sizing Strategies Available in Tradingview Strategy Implementation
🎯 Fixed dollar amount position sizing In this method, trader allocate a fixed value of X per trade. Though this method is simple, there are few drawbacks
Does not account for varying equity based on the trade outcomes
Does not account for varying risk based on the volatility of the instrument
🎯 Fixed Percentage of Equity In this method, percent of equity is used as position size for every trade. This method is also simple and slightly better than the Fixed dollar amount position sizing. However, there is still a risk of not accounting for volatility of the instrument for position sizing.
In tradingview strategies, you can find the position sizing settings in the properties section.
In both cases, Pinescript code for the entry does not need to specify quantity explicitly, as they will be taken care by the framework.
if(longEntry)
strategy.entry('long', strategy.long)
if(shortEntry)
strategy.entry('short', strategy.short)
🎲 Advanced Position Sizing Strategies
There are not directly supported in Tradingview/Pinescript - however, they can be programmed.
🎯 Fixed Fractional Method
The Fixed Fractional Method is similar to the fixed percentage of equity method/fixed dollar amount positioning method, but it takes into account the amount of risk on each trade and calculate the position size on that basis. This method calculates position size based on the trader’s risk tolerance, factoring in stop-loss levels and account equity. Due to this, the trader can use any instrument and any timeframe with any volatility with fixed risk position. This means, the quantity of overall trade may vary, but the risk will remain constant.
Example.
Let's say you have 1000 USD with you and you want to trade BTCUSD with entry price of 100000 and stop price of 80000 and target of 120000. You want to risk only 5% of your capital for this trade.
Calculation will be done as follows.
Risk per trade = 5% of 1000 = 50 USD
Risk per quantity = (entry price - stop price) = 20000
So, the quantity to be used for this trade is calculated by
RiskQty = Risk Amount / Risk Per Quantity = 50 / 20000 = 0.0025 BTC
To implement the similar logic in Pinescript strategy by using the strategy order quantity as risk, we can use the following code
riskAmount = strategy.default_entry_qty(entryPrice)*entryPrice
riskPerQty = math.abs(entryPrice-stopPrice)
riskQty = riskAmount/riskPerQty
With this, entry and exit conditions can be updated to as follows
if(longEntry)
strategy.entry('long', strategy.long, riskQty, stop=entryPrice)
strategy.exit('ExitLong', 'long', stop=stopPrice, limit=targetPrice)
if(shortEntry)
strategy.entry('short', strategy.short, riskQty, stop=entryPrice)
strategy.exit('ExitShort', 'short', stop=stopPrice, limit=targetPrice)
🎯 Kelly Criterion Method
The Kelly Criterion is a mathematical formula used to determine the optimal position size that maximizes the long-term growth of capital, considering both the probability of winning and the payoff ratio (risk-reward). It’s a more sophisticated method that balances risk and reward in an optimal way.
Kelly Criterion method needs a consistent data on the expected win ratio. As and when the win ratio changes, the position sizing will adjust automatically.
Formula is as follows
f = W - L/R
f: Fraction of your capital to bet.
W : Win Ratio
L : Loss Ratio (1-W)
R : Risk Reward for the trade
Let's say, you have a strategy that provides 60% win ratio with risk reward of 1.5, then the calculation of position size in terms of percent will be as follows
f = 0.6 - 0.4/1.5 = 0.33
Pinescript equivalent of this calculation will be
riskReward = 2
factor = 0.1
winPercent = strategy.wintrades/(strategy.wintrades+strategy.losstrades)
kkPercent = winPercent - (1-winPercent)/riskReward
tradeAmount = strategy.equity * kkPercent * factor
tradeQty = tradeAmount/entryPrice
🎲 High Risk Position Sizing Strategies
These strategies are considered very high risk and high reward. These are also the strategies that need higher win ratio in order to work effectively.
🎯Martingale Strategy
The Martingale method is a progressive betting strategy where the position size is doubled after every loss. The goal is to recover all previous losses with a single win. The basic idea is that after a loss, you double the size of the next trade to make back the lost money (and make a profit equal to the original bet size).
How it Works:
If you lose a trade, you increase your position size on the next trade.
You keep doubling the position size until you win.
Once you win, you return to the original position size and start the process again.
To implement martingale in Pine strategy, we would need to calculate the last consecutive losses before placing the trade. It can be done via following code.
var consecutiveLosses = 0
if(ta.change(strategy.closedtrades) > 0)
lastProfit = strategy.closedtrades.profit(strategy.closedtrades-1)
consecutiveLosses := lastProfit > 0? 0 : consecutiveLosses + 1
Quantity can be calculated using the number of consecutive losses
qtyMultiplier = math.pow(2, consecutiveLosses)
baseQty = 1
tradeQty = baseQty * qtyMultiplier
🎯Paroli System (also known as the Reverse Martingale)
The Paroli System is similar to the Anti-Martingale strategy but with more defined limits on how much you increase your position after each win. It's a progressive betting system where you increase your position after a win, but once you've won a set number of times, you reset to the original bet size.
How it Works:
Start with an initial bet.
After each win, increase your bet by a predetermined amount (often doubling it).
After a set number of wins (e.g., 3 wins in a row), reset to the original position size.
To implement inverse martingale or Paroli system through pinescript, we need to first calculate consecutive wins.
var consecutiveWins = 0
var maxLimit = 3
if(ta.change(strategy.closedtrades) > 0)
lastProfit = strategy.closedtrades.profit(strategy.closedtrades-1)
consecutiveWins := lastProfit > 0? consecutiveWins + 1 : 0
if(consecutiveWins >= maxLimit)
consecutiveWins := 0
The quantity is then calculated using a similar formula as that of Martingale, but using consecutiveWins
qtyMultiplier = math.pow(2, consecutiveWins)
baseQty = 1
tradeQty = baseQty * qtyMultiplier
🎯D'Alembert Strategy
The D'Alembert strategy is a more conservative progression method than Martingale. You increase your bet by one unit after a loss and decrease it by one unit after a win. This is a slow, incremental approach compared to the rapid growth of the Martingale system.
How it Works:
Start with a base bet (e.g., $1).
After each loss, increase your bet by 1 unit.
After each win, decrease your bet by 1 unit (but never go below the base bet).
In order to find the position size on pinescript strategy, we can use following code
// Initial position
initialposition = 1.0
var position = initialposition
// Step to increase or decrease position
step = 2
if(ta.change(strategy.closedtrades) > 0)
lastProfit = strategy.closedtrades.profit(strategy.closedtrades-1)
position := lastProfit > 0 ? math.max(initialposition, position-step) : position+step
Conclusion
Position sizing is a crucial part of trading strategy that directly impacts your ability to manage risk and achieve long-term profitability. By selecting the appropriate position sizing method, traders can ensure they are taking on an acceptable level of risk while maximizing their potential rewards. The key to success lies in understanding each strategy, testing it, and applying it consistently to align with your risk tolerance and trading objectives.

Skirt Lengths as Market Indicators: A Socionomics PerspectivePart of the #Socionomics series.
How fashion and societal moods shifted in the first half of the 20th century.
1900–1910
Economy: The rise of industrialization in the U.S. — Ford’s assembly line (1908), booming cities, and a growing wealth gap between the elite and the working class. In Europe, colonial powers raced for survival, fueling military spending (sound familiar?).
Mood: Faith in technological progress clashed with protests against exploitation. Suffragettes smashed London storefronts (1908), while New York’s Triangle Shirtwaist Factory fire (1911) galvanized labor rights movements.
Fashion: Rigid corsets and floor-length skirts symbolized Victorian morality. Yet rebels like designer Paul Poiret introduced hobble skirts — a tentative step toward freedom of movement.
1910–1920
Economy: World War I (1914–1918) reshaped the globe: Europe lay in ruins, while the U.S. profited from arms sales. Postwar hyperinflation crippled Germany, and the Spanish Flu (1918–1920) claimed millions.
Mood: Women replaced men in factories, only to be pushed back into domestic roles after the war. A feminist explosion: American women won voting rights in 1920.
Fashion: Skirts rose to ankle-length for practicality. By the decade’s end, the flapper emerged — straight-cut dresses, beaded necklaces, and cigarettes in hand, defying tradition. A sign of the stock market’s brewing boom.
1920–1929
Economy: The "Roaring Twenties" — jazz, speculation, and Prohibition. The stock market quadrupled; ordinary Americans borrowed heavily to invest, then borrowed again against rising shares.
Mood: Hedonism reigned. Speakeasies and Gatsby-esque parties masked pre-crash euphoria.
Fashion: Knees on display! Fringed dresses, bobbed haircuts, and gartered stockings. By 1929, subdued silhouettes crept in — an omen of crisis.
1930–1940
Economy: The 1929 bubble burst: Wall Street crashed, triggering the Great Depression (1929–1939). U.S. unemployment hit 25%. Europe veered toward fascism and war.
Mood: Despair from Dust Bowl migrations and hunger marches. Yet Hollywood’s Golden Age offered escapism.
Fashion: Skirts lengthened — modesty returned. Long dresses dominated, while cheap fabrics and turbans (to hide unwashed hair) became staples.
1940–1950
Economy: World War II (1939–1945). Postwar Europe rebuilt via the Marshall Plan; the U.S. embraced consumerism.
Mood: Patriotism ("Rosie the Riveter") and postwar hope. The baby boom idealized domesticity.
Fashion: War mandated minimalism: knee-length skirts and padded shoulders. In 1947, Christian Dior’s New Look rebelled — voluminous ankle-length skirts symbolized postwar opulence.
1950–1960
Economy: America’s "Golden Fifties" — middle-class expansion, cars, and TV. Europe recovered, but colonial wars (Algeria, Vietnam) exposed crises.
Mood: Conformity (suburban perfection) vs. teenage rebellion (James Dean, Elvis’s rock ‘n’ roll).
Fashion: Sheath dresses and midi skirts emphasized femininity. By the late 1950s, Mary Quant experimented with mini-skirts — a harbinger of the sexual revolution.
1960s: Peak of Postwar Prosperity
Economy: U.S. GDP grew 4-5% annually; unemployment dipped below 4%. Baby boomers (1946–1964) fueled suburban housing and education demand.
Fashion: The mini-skirt became an era-defining manifesto of freedom, paired with bold go-go boots. Economic optimism bred experimentation: neon synthetics (nylon, Lycra) and psychedelic hues.
Conclusion
Women’s fashion mirrors its era. Crises (1930s) hide knees; liberating times (1920s, 1960s) bare them. Even war skirts (1940s’ knee-length pragmatism) carried hope.
💡 Like and subscribe for insights your economics textbook won’t reveal!
#beginners #learning_in_pulse #interesting
#socionomics #history #fashiontrends

$MSTR Model Book Example - 2024 - Continuation Set-upGreat example of continuation set-up on MSTR in 2024. Capturing the second leg following a shorter consolidation after digesting the first leg.

How to Set Stop LossesViolating stop losses is like alcoholism.
There are 3 basic ways to set stop losses in trading:
1. Price-Based Stop
This can be a fixed monetary or percentage loss.
This is the most common and comfortable method — trading becomes a game with predictable outcomes. Knowing your maximum risk keeps emotions in check.
How to choose the price level?
Set a loss limit you're comfortable with — for example, 1% for a short-term trade or up to 12% for an investment position.
I don’t recommend anything over 15% — that usually signals a bad position that starts draining your energy and dominates your thoughts: “When will this finally recover?!”
Alternatively, use a support/resistance level, previous high/low — but don’t place the stop exactly on the level. Put it slightly above/below (e.g. 0.5%) and make sure the potential loss is still acceptable.
Or base it on volatility — for example, the Volatility Stop indicator on TradingView. Again, place your stop slightly beyond the indicated level.
Avoid setting stops based on moving averages — they’re trend indicators, not stop-loss tools.
2. Indicator-Based Stop
Used when a price breaks a key technical level or indicator signal — useful in trend or pattern-based strategies.
3. Time-Based Stop
Often used around news events or major announcements. The market needs time to digest the info, so a time stop lets you exit if the move doesn’t happen within a set timeframe.
❗️Match your stop-loss to the timeframe of your entry❗️
If you entered based on the daily chart — use daily levels, volatility, and context for your stop. Don’t mix timeframes.
