Advanced Trading Dashboard📊 Advanced Trading Dashboard - Multi-Indicator Analysis Tool
Comprehensive Market Analysis at a Glance
This professional trading dashboard consolidates multiple technical indicators into a single, easy-to-read overlay table that provides instant market insights for informed trading decisions.
✨ Key Features:
📈 Multi-Indicator Analysis:
Real-time Price Action vs EMA8 with percentage strength
RSI momentum with overbought/oversold signals
MACD trend confirmation with bullish/bearish status
Multi-timeframe trend analysis (EMA50/200 + Supertrend)
Volume analysis with ratio to moving average
Bollinger Bands positioning with band width metrics
ATR volatility measurements with percentage levels
Stochastic oscillator for entry/exit timing
🎯 Advanced Market Intelligence:
Automated Market Structure detection (Higher Highs/Lower Lows)
Dynamic Support & Resistance level identification
Smart Overall Signal generation based on 5+ confluence factors
Color-coded status indicators for quick visual assessment
⚙️ Customization Options:
Repositionable dashboard (6 position options)
Toggle visibility on/off
Clean, professional interface with intuitive color coding
💡 Perfect For:
Day traders seeking quick market assessment
Swing traders analyzing trend strength
Multi-timeframe analysis confirmation
Risk management and volatility assessment
Entry/exit signal confluence
The dashboard eliminates the need to switch between multiple indicators, providing all essential market data in one consolidated view. Each metric includes both numerical values and interpretive status, making it suitable for both novice and experienced traders.
Compatible with all markets and timeframes. Best used as a supplementary analysis tool alongside your existing trading strategy.
Indicators and strategies

Custom HA-MACD-SMA-RSI ScannerScript To Find Stocks that show the best momentum layout using;
1. Find stocks, where the MACD signal line sloop is positive.
2. For those that are positive, is it above the signal line or not? If no, discard
3. In these companies, is the 9 day SMA larger than 50 day SMA which is larger than 180 SMA? If not, discard
4. Is yesterday's lowest price action on the market close that day - is it above the 9 day SMA? If no, discard
6. For the distilled companies that fit this criteria, is the RSI over 80% overbought? If yes, discard.
Show me a list of stocks that pass this criteria list

50-100-200 MA Crosses with Priority (Open Source)Shows MA-EMA-WMA crosses with priority. Also has 2 additional customizable options you can add for scalping and such. It's an open source code so you can change 50-100-200 moving averages to your personal use by just changing the code.
TB DayProfile (stabil)TB DayProfile Indicator
The TB DayProfile plots intraday price movements relative to the current day’s opening price. Each bar is shifted so that the daily open acts as a fixed zero line, making it easy to see how far the market has moved above or below the open during the session.
The indicator includes:
Relative intraday bars (iOpen, iHigh, iLow, iClose): Displayed as a custom bar chart, showing price action normalized to the day’s open.
Zero line with color signals: Turns green if the number of consecutive bars above the open exceeds a user-defined threshold, or red if below.
ATR reference bands: Daily ATR(5) from the previous day (scaled by 0.25) is plotted as upper and lower bands, helping to gauge typical intraday ranges.
This tool helps traders quickly identify whether the market is trending strongly away from the daily open, or if price is reverting back toward it, independent of the chosen chart timeframe.


Ultimate📖 Indicator Description – Ultimate
The Ultimate Indicator is a complete charting framework that combines linear regression channels, dynamic deviation bands, EMA ribbons, volatility spreads, and entry/exit markers. It is designed to help traders visualize trend direction, potential reversals, and trade setups with precision.
🔹 What You See on the Chart
Channel Lines (Linear Regression Bands)
Green dotted line (median): Fair value trendline based on regression.
Red dashed line (upper band): Dynamic resistance zone.
Blue dashed line (lower band): Dynamic support zone.
Mid-bands (thin dotted red/blue): Halfway between median and outer bands, useful for scaling entries or partial exits.
🔹 EMA Ribbon (Light Green Shades)
Multiple EMAs (5, 8, 13, 21, 34) plotted in progressively lighter green.
Helps visualize momentum shifts and trend strength.
Ribbon turns more aqua/green when short-term EMAs align bullishly.
🙌Markers on Price
🔴 Red Circle (Dot): Short entry signal (price rejecting upper deviation band).
🔵 Blue Circle (Dot): Long entry signal (price bouncing off lower deviation band).
❌ Red X: Peak formation detected, potential short setup (not always valid).
🔷 Blue Diamond: Trough formation detected, potential long setup (not always valid).
Numbers Above/Below Candles
🔴Red numbers (above peaks): % spread from the bottom to the peak, showing upward volatility.
🔵 Blue numbers (below troughs): % spread from the top to the trough, showing downward volatility.
These values help traders gauge the strength of recent swings and compare volatility expansions.
🔹 Signal Logic🔹
🔵Long Signal (Blue Circle):
Forms when price makes a trough and crosses back above the lower regression band.
Confirms potential upside reversal with stop-loss guided by ATR or swing low.
🔴Short Signal (Red Circle):
Forms when price makes a peak and crosses below the upper regression band.
Confirms potential downside reversal with stop-loss guided by ATR or swing high.
❌ Peaks (Red X):
Indicate local tops. Not all peaks convert into shorts, but they warn of resistance zones.
🔹Troughs (Blue Diamonds):
Indicate local bottoms. Not all troughs convert into longs, but they warn of support zones.
🔹 Alerts
When a valid long or short setup is confirmed, an alert fires with:
Ticker name
Entry price
Suggested position size (Quantity)
Stop loss level (ATR-based or HL-based)
Take profit level (calculated by reward multiple)
🔹 Inputs & Customization
Quantity: Lot size suggestion.
Deviation: Multiplier for regression channel width.
Take Profit: Risk-to-reward multiplier.
Stop Loss: ATR or High/Low based.
Trend Lines: Choose between extended or fixed channels.
Period: Lookback window for regression.
Spread Percentages: Toggle volatility labels on/off.
🔹 How to Use
Trend Following: Ride price inside the channel using EMA ribbon alignment.
Reversal Trading: Enter at deviation extremes with confirmation signals.
Volatility Mapping: Use spread % labels to measure the strength of market swings.
Risk Management: ATR-based stops adapt to volatility, while HL stops give structural support/resistance.
✅ In summary:
The Ultimate Indicator is not just a regression channel—it’s a multi-layered system that highlights trend bias, entry/exit signals, volatility spreads, and adaptive risk levels. It allows traders to see at a glance whether the market is trending, ranging, or preparing for a reversal.

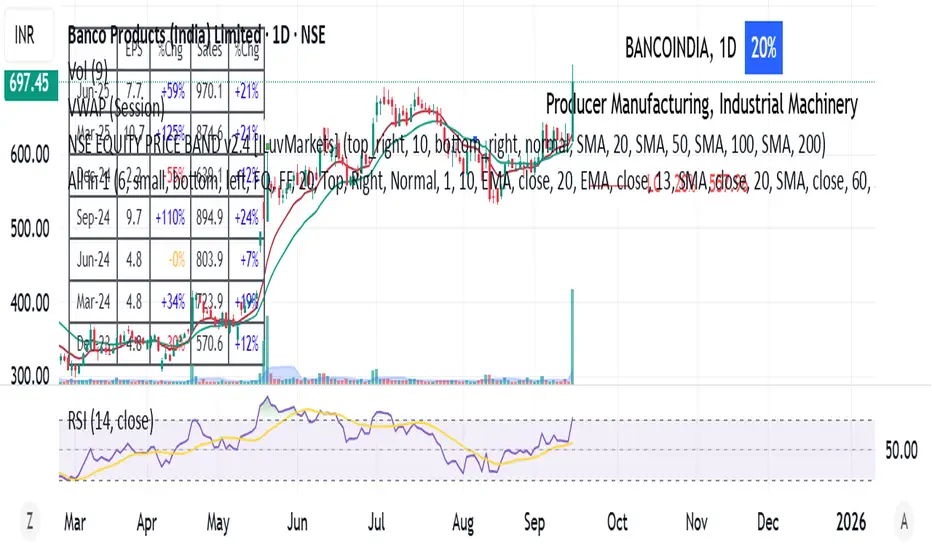
All in 1 by trading spell_kkall in one indicator sharing a mix of ema, quarterly earnings, adr, and market cap
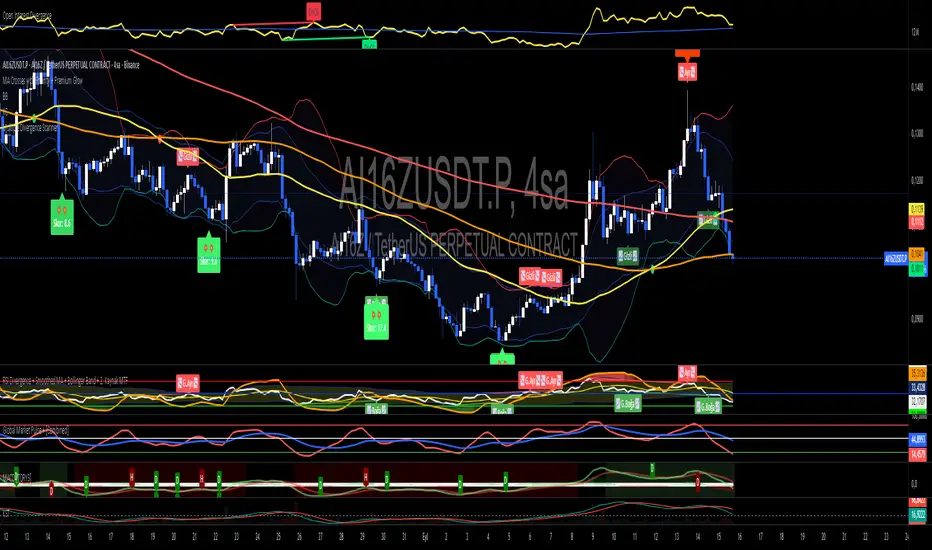
AlgoGram Trend Identifier📊 Algogram Trend Identifier (ATI)
The Algogram Trend Identifier (ATI) is a powerful trend-following oscillator designed to help traders identify market direction, momentum strength, divergences, and consolidation zones across multiple timeframes.
🔑 Key Features:
Multi-Timeframe Presets – Choose from 5m, 15m (default), 30m, 1h, and Daily for optimized settings.
Adaptive ALMA Calculation – Uses ALMA smoothing with dynamic thresholds to detect clean trend shifts.
Trend Highlighting – Visual coloring of oscillator and optional bar coloring for quick market bias recognition.
Customizable Thresholds & Bands – Fine-tune upper/lower thresholds, consolidation zones, and band multipliers.
Consolidation Detection – Highlights when the market is moving sideways with adjustable parameters.
Divergence Detection – Automatically detects bullish & bearish divergences with optional lines and dots.
Dynamic Alerts – Built-in alerts for:
Crossing thresholds
Zero line crosses
Uptrend / Downtrend detection
Bullish / Bearish divergences
RMS consolidation breakouts
🎯 How to Use:
Above Zero Line → Bullish trend bias.
Below Zero Line → Bearish trend bias.
Consolidation Zone → Market may range or prepare for breakout.
Bullish Divergence → Potential reversal to upside.
Bearish Divergence → Potential reversal to downside.
⚡ Best For:
Swing Traders, Scalpers, and Positional Traders
Identifying trend strength, early reversals, and breakout opportunities
Works on stocks, crypto, forex, and indices

Weighted Sector ADD (sign-weighted)What it is
A true, cap-weighted advances/declines (ADD) proxy for the S&P 500 using sector ETFs. Each sector contributes +1 if it’s up on the bar, −1 if it’s down, 0 if flat. Those signals are then weighted by your sector weights (auto-normalized to 100%) and summed into a single breadth line. The result is a fast, low-noise read of how much of the S&P (by sector weight) is advancing vs. declining right now.
- Tracks participation, not price magnitude—perfect for spotting “broad vs. narrow” moves
- Heavily weighted sectors (e.g., Tech) matter proportionally more, reflecting real index impact
- Simple scale: ~−1 to +1 (all weight down → all weight up)
Chart Elements
- Green/Red Columns – “Weighted ADD”: Current bar’s weighted breadth (sign-based by default)
- Blue Line – “Weighted MA”: SMA of the weighted ADD (regime filter)
- Zero/Guide Lines (optional): 0.0, ±0.2 (mild), ±0.6 (strong)
- Labels (optional): Text markers at those guide levels
- Advancing Weight % (optional): Label showing ((ADD+1)/2)*100 → share of total sector weight advancing
How to Read (Quick Guide)
- +0.60 to +1.00 → Broad, one-sided risk-on (most sector weight advancing)
- +0.20 to +0.60 → Moderate, supportive breadth
- −0.20 to +0.20 → Mixed/choppy; rotation
- −0.60 to −1.00 → Broad, one-sided risk-off
- MA above/below zero → Simple regime indicator; zero-crosses could be potential alert triggers
- Divergence: Strong price move with a weak/flat ADD could potentially warn of narrow participation
Inputs & settings
Calculation
- Use returns instead of up/down sign?
OFF (default): true weighted participation (+1/−1/0)
ON: weighted sector returns (winsor-capped). Use if you want magnitude, not just direction
- Winsor cap (returns mode): Caps per-sector contribution in returns mode (e.g., 0.02 = ±2%)
- Smoothing MA length: SMA period for the blue “Weighted MA” line
- Source timeframe: Compute signals on another TF (e.g., “60”) but plot on your chart TF
Visibility
- Show Weighted ADD (bars): Toggle the green/red columns
- Show Weighted ADD MA: Toggle the blue SMA line
- Show Zero Line (0): Toggle the 0.0 reference line
- Show ±0.2 / ±0.6 guide lines: Toggle the helper levels
- Show guide labels: Draw small text labels at 0, ±0.2, ±0.6
- Guide label offset (bars left): Move labels left if they overlap the right edge values
- Show Advancing Weight % label: Toggle the % of sector weight currently advancing
Sector Symbols (ETF proxies)
- XLK, XLY, XLF, XLV, XLC, XLI, XLP, XLE, XLB, XLU, XLRE: Defaults to the SPDR sector ETFs. You can swap for alternative proxies if desired.
Sector Weights (auto-normalize)
- Weight inputs for each sector (e.g., Tech 0.30, Financials 0.13…). These auto-normalize to 1.0 so you can paste rough numbers; the script scales them.
- Keep weights fresh. GICS sector weights drift; update periodically (e.g., quarterly).
Alerts included
- “Weighted ADD crossed above 0”
- “Weighted ADD crossed below 0”
Version
v1.0 – Initial release (weighted sign-based ADD + SMA, zero/guide lines & labels, Adv % label, alerts).

Zenova Z-ScorePlots the Z-Score of price over a configurable lookback period as an area.
Overlays a Z-Score Moving Average (default: HULL) with slope-based coloring: green when rising, red when falling.
Highlights key zones with clouds: green below 0, red above 0.
Detects first-cycle buy/sell signals based on the Z-Score MA slope and historical extremes, plotting them as small triangles directly on the MA line.
Signals help identify potential trend reversals or momentum shifts while avoiding repeated alerts during the same cycle.

VIM (Volume in Money)Volume in Money + MA (Short Numbers & Coloring)
This indicator visualizes the monetary volume traded in each candle, calculated as:
Money Volume
=
Volume
×
Close Price
Money Volume=Volume×Close Price
🔹 Features:
Plots bars representing the money volume (total traded value).
Coloring options:
• Prev Close → Green if the current close is higher than the previous close, Red if lower.
• Candle Direction → Green if the candle is bullish (close > open), Red if bearish (close < open).
Moving Average (default length: 14) applied on the money volume for trend analysis.
Axis values and labels displayed in a shortened format (K, M, B, T) for readability.
📊 This helps traders quickly identify whether large amounts of money flowed into or out of the asset, making it easier to detect unusual activity compared to regular volume indicators.

sarbesh tiwari- Separate ATRprice action. itv shows good result. donate if make profit.contact at mitthu497@gmail.com

Front Contract Roll Detector (TV-mapped 1!)This script looks at the security.instrument and finds the current best matching price for the current instrument on a front loaded contract.
This is very useful for detecting when TradingView rolls over contracts and an alert can be put in place for this.

Trading Activity Index (Zeiierman)█ Overview
Trading Activity Index (Zeiierman) is a volume-based market activity meter that transforms dollar-volume into a smooth, normalized “activity index.”
It highlights when market participation is unusually low or high with a dynamic color gradient:
Light Blue → Low Activity (thin participation, low liquidity conditions)
Red/Orange → High Activity (active markets, large trades flowing in)
Additional percentile bands (20/40/60/80%) give context, helping you see whether the current activity level is in the bottom quintile, mid-range, or near historical extremes.
█ How It Works
⚪ Dollar Volume Transformation
Each bar, dollar volume is computed:
float dlrVol = close * volume
float dlrVolAvg = ta.sma(dlrVol, len_form)
Dollar volume = price × volume, smoothed by a configurable SMA window.
The result is log-transformed, compressing large outliers for a more stable signal.
⚪ Rolling Percentiles & Ranking
The log-dollar-volume series is compared to its rolling history (len_hist bars):
float p20 = ta.percentile_linear_interpolation(vscale, len_hist, 20)
float p40 = ta.percentile_linear_interpolation(vscale, len_hist, 40)
float p60 = ta.percentile_linear_interpolation(vscale, len_hist, 60)
float p80 = ta.percentile_linear_interpolation(vscale, len_hist, 80)
A normalized rank (0–1) is produced to color the main Trading Activity line.
█ How to Use
⚪ Detect High-Impact Sessions
Quickly see if today’s session is active or quiet relative to its own history — great for filtering setups that need activity.
⚪ Spot Breakouts & Traps
Combine with price action:
High activity near breakouts = strong follow-through likely.
Low activity breakouts = vulnerable to fake-outs.
⚪ Market Regime Context
Percentile bands help you assess whether participation is building up, in the middle of the range, or drying out — valuable for timing mean-reversion trades.
Above 80th percentile (red/orange) → Market is highly active, breakout trades and trend strategies are favored.
Below 20th percentile (light blue) → Market is quiet; fade moves or wait for expansion.
Watch transitions from blue → orange as a signal of growing institutional participation.
█ Settings
Formation Window (bars) – Number of bars used to average dollar volume before log transform.
History Window (bars) – Lookback period for percentile calculations and rank normalization.
-----------------
Disclaimer
The content provided in my scripts, indicators, ideas, algorithms, and systems is for educational and informational purposes only. It does not constitute financial advice, investment recommendations, or a solicitation to buy or sell any financial instruments. I will not accept liability for any loss or damage, including without limitation any loss of profit, which may arise directly or indirectly from the use of or reliance on such information.
All investments involve risk, and the past performance of a security, industry, sector, market, financial product, trading strategy, backtest, or individual's trading does not guarantee future results or returns. Investors are fully responsible for any investment decisions they make. Such decisions should be based solely on an evaluation of their financial circumstances, investment objectives, risk tolerance, and liquidity needs.

RSI (8 & 13) + Fibonacci LevelsIndicator Description: RSI (8 & 13) + Fibonacci Levels
This custom indicator is designed to provide a dual-speed RSI framework with embedded Fibonacci retracement levels for advanced momentum and reversal analysis. It combines the power of relative strength measurement with the natural harmony of Fibonacci ratios to give traders a structured approach to market timing and confluence trading.
The indicator plots two RSI lines on a dedicated sub-chart:
RSI Fast (8) → short-term momentum, highly sensitive to price action, helps identify quick shifts and micro-trends.
RSI Slow (13) → smoother and less volatile, acts as confirmation of broader trend direction and underlying strength.
By combining both RSI speeds, traders can spot alignment, divergences, and crossover signals between fast and slow momentum. When both lines move in sync, it reflects strong conviction; when they diverge, it signals potential exhaustion or trend shifts.
Overlaying Fibonacci retracement levels on RSI adds an extra dimension of precision. Instead of using arbitrary zones, the indicator relies on mathematically significant levels tied to natural market cycles:
23.6% → shallow pullbacks, early momentum pauses.
38.2% → minor retracements, often signaling trend continuation.
50% → balance point between strength and weakness.
61.8% → golden ratio, strong correction or reversal zone.
78.6% → deep retracement, last line before full reversal.
In addition, the script marks the classic RSI boundaries:
70 (Overbought) → potential profit-taking, stretched bullish conditions.
30 (Oversold) → potential accumulation, stretched bearish conditions.
Together, these zones help traders gauge not only when the RSI is “too high” or “too low,” but also where price momentum aligns with natural Fibonacci retracement zones. This approach transforms RSI from a simple oscillator into a multi-layered momentum map.
Practical Uses:
Trend Confirmation → When RSI(8) and RSI(13) are both above 50 and rising, bullish strength is confirmed.
Divergence Detection → If price makes higher highs but RSI(8) fails to confirm, it warns of weakening momentum.
Reversal Hunting → Look for RSI rejection candles at Fib levels (e.g., fast RSI hitting 61.8 and rolling over).
Entry/Exit Timing → Use fast RSI crossovers with slow RSI as tactical entries within the broader structure.
Confluence Trading → Strong signals occur when RSI rejection coincides with price structure (double tops/bottoms, Fibonacci levels on chart, Bollinger Band rejections).
This indicator is especially powerful when paired with Bollinger Bands or price action rejection patterns, creating a system where price extremes are validated against RSI Fib zones.
Ultimately, the RSI (8 & 13) + Fibonacci Levels indicator acts as a precision filter — helping traders separate noise from genuine turning points and reinforcing entries/exits with multiple layers of confluence.

Bollinger Bands (SMA 21, 2.618σ)Indicator Description: Bollinger Bands (2.618σ, 21 SMA) + RSI with Fibonacci
This custom indicator combines Bollinger Bands and Relative Strength Index (RSI), enhanced with Fibonacci-based configurations, to provide confluence signals for rejection candles, reversal setups, and continuation patterns.
Bollinger Bands Settings (Customized)
Middle Band → 21-period Simple Moving Average (SMA)
Upper Band → SMA + 2.618 standard deviations
Lower Band → SMA − 2.618 standard deviations
These parameters expand the bands compared to the traditional (20, 2.0) settings, making them better suited for volatility extremes and higher timeframe swing analysis.
Color Scheme
Middle Band = Orange
Upper Band = Red
Lower Band = Green
This color-coding emphasizes key rejection levels visually.
Candle Rejection Logic
The indicator is designed to highlight potential rejection candles when price interacts with the outer Bollinger Bands:
At the Upper Band, rejection signals suggest overextension and potential downside reaction.
At the Lower Band, rejection signals suggest oversold conditions and potential upside reaction.
Rejection Candle Types Tracked
Hammer (bullish reversal, lower rejection wick at bottom band)
Inverted Hammer (bearish reversal, upper rejection wick at top band)
Doji candles (indecision at band extremes)
Double Top formations near the upper band
Double Bottom formations near the lower band
Relative Strength Index (RSI) Settings
RSI is configured with Fibonacci retracement levels instead of traditional 30/70 thresholds.
Fibonacci sequence levels used include:
23.6% (0.236)
38.2% (0.382)
50% (0.5)
61.8% (0.618)
78.6% (0.786)
This alignment with Fibonacci ratios provides deeper market structure insights into momentum strength and exhaustion points.
Trading Confluence Zones
Upper Band + RSI at 0.618–0.786 zone → High probability bearish rejection.
Lower Band + RSI at 0.236–0.382 zone → High probability bullish reversal.
Band interaction + Doji or Hammer candles → Stronger signal confirmation.
Use Cases
Identifying trend exhaustion when price repeatedly fails to break above the upper band.
Spotting accumulation or distribution phases when price consolidates around Fibonacci-based RSI zones.
Detecting false breakouts when candle patterns (like Doji or Inverted Hammer) occur beyond the bands.
Why 2.618 Deviation & 21 SMA?
Standard Bollinger Bands (20, 2.0) capture ~95% of price action.
By widening to 2.618σ, we target extreme volatility outliers — areas where reversals are statistically more likely.
A 21-period SMA aligns better with common cycle lengths (3 trading weeks on daily charts) and Fibonacci-related time cycles.
Practical Strategy
Step 1: Watch when price touches or pierces the upper/lower band.
Step 2: Check for candle rejection patterns (Hammer, Inverted Hammer, Doji, Double Top/Bottom).
Step 3: Confirm with RSI Fibonacci levels for confluence.
Step 4: Trade with the prevailing trend or look for reversal setups if multiple confluence factors align.
Cautions
Not all touches of the bands signal reversals — strong trends can ride along the bands for extended periods.
Always combine with price action structure, volume, and higher timeframe trend bias.
📌 Summary
This indicator blends volatility-based bands with Fibonacci momentum analysis and classical candle rejection patterns. The combination of Bollinger Bands (21, 2.618σ) and RSI Fibonacci levels helps traders detect high-probability rejection zones, reversal opportunities, and overextended conditions with improved accuracy over traditional default settings.

Weekly Session BreakThis indicator plots a vertical line at the end of the trading week (Friday) to mark the weekly session break. It is designed to be used on intraday charts (sub-1 hour timeframes).
The line's appearance is fully customizable via the Inputs tab, allowing you to change its color, style (solid, dotted, or dashed), and thickness.
Key Features:
End-of-Week Marker: Accurately draws a vertical line on the last bar of the trading week.
Timeframe Specific: Lines are only visible on intraday charts (1-minute to 59-minute timeframes) to prevent clutter on higher timeframes.
Customizable: Adjust the line's color, style, and thickness from the Inputs menu.

Sentinel Nexus Dashboard [AGP] Ver.1.5Sentinel Nexus Dashboard is a versatile Pine Script designed as a comprehensive technical analysis tool. It condenses a variety of key indicators and metrics into a single, intuitive visual dashboard, providing an integrated view of market trends, momentum, volatility, and liquidity, all neatly organized on your TradingView chart.
Key Features and Benefits
All-in-One Dashboard: This script centralizes relevant information, offering a clean, efficient control panel that helps you make quick decisions without cluttering your chart with multiple overlays.
Trend Analysis with ADX: It incorporates the Average Directional Index (ADX) to measure trend strength. The dashboard displays ADX, DI+, and DI- values with dynamic color-coding to highlight trend intensity (e.g., blue for a very strong trend).
Momentum Analysis with MACD: The dashboard shows MACD line and signal line values in a table. The background color of the MACD values reflects the histogram's direction, allowing you to quickly identify crosses and shifts in market momentum.
Multi-Timeframe RSI Analysis: The RSI (Relative Strength Index) dashboard displays values across multiple timeframes (from 1 minute to 1 month). Overbought (77) and oversold (23) levels are color-coded for immediate identification of market conditions, making it an ideal tool for multi-timeframe analysis.
Smart and Dynamic Volume: The script uses a bar coloring algorithm based on average volume. Chart bars change color according to volume magnitude (extreme, high, average, or low) relative to the average, distinguishing between bullish and bearish bars. This helps you identify significant, liquidity-driven price movements.
Fair Value Analysis: The script calculates an asset's "fair value" using a noise filter (similar to a Kalman filter) on recent highs and lows to determine a midpoint. The price dashboard's background color changes to indicate if the current price is above or below this fair value.
Fibonacci EMA Analysis: A table displays several Exponential Moving Averages (EMAs) based on the Fibonacci sequence. The values are color-coded to show whether the current price is above (white) or below (orange) each EMA, helping you quickly identify dynamic support and resistance levels.
CME Futures Data Integration: For Bitcoin, the script can show a chart label with the Bitcoin futures price (CME:BTC1!), allowing you to compare the spot price with the CME futures market.
Potential Uses and Applications
The Sentinel Nexus Dashboard is an excellent support tool for trading. It is not a signal system but rather a suite of confirmation tools that can be used to:
Confirm Trend Strength: Before entering a trade, use the ADX data to ensure the trend has enough strength for your expected move.
Detect Reversal Points: Multi-timeframe RSI data can alert you to potential overbought or oversold conditions, indicating possible exhaustion of a price move.
Validate Price Movements: Bar coloring based on volume helps you determine if a price move is genuine and supported by strong market participation. High volume can confirm a breakout or reversal.
Identify Support and Resistance: The Fibonacci EMAs allow you to quickly visualize key levels where price might find support or resistance, aiding in planning entries and exits.
In short, this script is perfect for traders who want a comprehensive market overview without chart clutter. It efficiently integrates trend, momentum, and volume analysis in one place.
Legal Disclaimer
RISK WARNING:
This Pine Script is a technical analysis tool and should not be considered financial advice. Past performance of any indicator is no guarantee of future results. Trading in financial markets involves a high risk of loss and is not suitable for all investors. By using this indicator, you accept full responsibility for your trading decisions and acknowledge that any financial loss is your sole responsibility.
IMPORTANT:
Some script functions, such as the CME price label, may not work correctly if your TradingView subscription plan is not a paid one. Please check your plan's limitations to ensure the indicator's optimal functionality.

Harmonic Super GuppyHarmonic Super Guppy – Harmonic & Golden Ratio Trend Analysis Framework
Overview
Harmonic Super Guppy is a comprehensive trend analysis and visualization tool that evolves the classic Guppy Multiple Moving Average (GMMA) methodology, pioneered by Daryl Guppy to visualize the interaction between short-term trader behavior and long-term investor trends. into a harmonic and phase-based market framework. By combining harmonic weighting, golden ratio phasing, and multiple moving averages, it provides traders with a deep understanding of market structure, momentum, and trend alignment. Fast and slow line groups visually differentiate short-term trader activity from longer-term investor positioning, while adaptive fills and dynamic coloring clearly illustrate trend coherence, expansion, and contraction in real time.
Traditional GMMA focuses primarily on moving average convergence and divergence. Harmonic Super Guppy extends this concept, integrating frequency-aware harmonic analysis and golden ratio modulation, allowing traders to detect subtle cyclical forces and early trend shifts before conventional moving averages would react. This is particularly valuable for traders seeking to identify early trend continuation setups, preemptive breakout entries, and potential trend exhaustion zones. The indicator provides a multi-dimensional view, making it suitable for scalping, intraday trading, swing setups, and even longer-term position strategies.
The visual structure of Harmonic Super Guppy is intentionally designed to convey trend clarity without oversimplification. Fast lines reflect short-term trader sentiment, slow lines capture longer-term investor alignment, and fills highlight compression or expansion. The adaptive color coding emphasizes trend alignment: strong green for bullish alignment, strong red for bearish, and subtle gray tones for indecision. This allows traders to quickly gauge market conditions while preserving the granularity necessary for sophisticated analysis.
How It Works
Harmonic Super Guppy uses a combination of harmonic averaging, golden ratio phasing, and adaptive weighting to generate its signals.
Harmonic Weighting : Each moving average integrates three layers of harmonics:
Primary harmonic captures the dominant cyclical structure of the market.
Secondary harmonic introduces a complementary frequency for oscillatory nuance.
Tertiary harmonic smooths higher-frequency noise while retaining meaningful trend signals.
Golden Ratio Phase : Phases of each harmonic contribution are adjusted using the golden ratio (default φ = 1.618), ensuring alignment with natural market rhythms. This reduces lag and allows traders to detect trend shifts earlier than conventional moving averages.
Adaptive Trend Detection : Fast SMAs are compared against slow SMAs to identify structural trends:
UpTrend : Fast SMA exceeds slow SMA.
DownTrend : Fast SMA falls below slow SMA.
Frequency Scaling : The wave frequency setting allows traders to modulate responsiveness versus smoothing. Higher frequency emphasizes short-term moves, while lower frequency highlights structural trends. This enables adaptation across asset classes with different volatility characteristics.
Through this combination, Harmonic Super Guppy captures micro and macro market cycles, helping traders distinguish between transient noise and genuine trend development. The multi-harmonic approach amplifies meaningful price action while reducing false signals inherent in standard moving averages.
Interpretation
Harmonic Super Guppy provides a multi-dimensional perspective on market dynamics:
Trend Analysis : Alignment of fast and slow lines reveals trend direction and strength. Expanding harmonics indicate momentum building, while contraction signals weakening conditions or potential reversals.
Momentum & Volatility : Rapid expansion of fast lines versus slow lines reflects short-term bullish or bearish pressure. Compression often precedes breakout scenarios or volatility expansion. Traders can quickly gauge trend vigor and potential turning points.
Market Context : The indicator overlays harmonic and structural insights without dictating entry or exit points. It complements order blocks, liquidity zones, oscillators, and other technical frameworks, providing context for informed decision-making.
Phase Divergence Detection : Subtle divergence between harmonic layers (primary, secondary, tertiary) often signals early exhaustion in trends or hidden strength, offering preemptive insight into potential reversals or sustained continuation.
By observing both structural alignment and harmonic expansion/contraction, traders gain a clear sense of when markets are trending with conviction versus when conditions are consolidating or becoming unpredictable. This allows for proactive trade management, rather than reactive responses to lagging indicators.
Strategy Integration
Harmonic Super Guppy adapts to various trading methodologies with clear, actionable guidance.
Trend Following : Enter positions when fast and slow lines are aligned and harmonics are expanding. The broader the alignment, the stronger the confirmation of trend persistence. For example:
A fast line crossover above slow lines with expanding fills confirms momentum-driven continuation.
Traders can use harmonic amplitude as a filter to reduce entries against prevailing trends.
Breakout Trading : Periods of line compression indicate potential volatility expansion. When fast lines diverge from slow lines after compression, this often precedes breakouts. Traders can combine this visual cue with structural supports/resistances or order flow analysis to improve timing and precision.
Exhaustion and Reversals : Divergences between harmonic components, or contraction of fast lines relative to slow lines, highlight weakening trends. This can indicate liquidity exhaustion, trend fatigue, or corrective phases. For example:
A flattening fast line group above a rising slow line can hint at short-term overextension.
Traders may use these signals to tighten stops, take partial profits, or prepare for contrarian setups.
Multi-Timeframe Analysis : Overlay slow lines from higher timeframes on lower timeframe charts to filter noise and trade in alignment with larger market structures. For example:
A daily bullish alignment combined with a 15-minute breakout pattern increases probability of a successful intraday trade.
Conversely, a higher timeframe divergence can warn against taking counter-trend trades in lower timeframes.
Adaptive Trade Management : Harmonic expansion/contraction can guide dynamic risk management:
Stops may be adjusted according to slow line support/resistance or harmonic contraction zones.
Position sizing can be modulated based on harmonic amplitude and compression levels, optimizing risk-reward without rigid rules.
Technical Implementation Details
Harmonic Super Guppy is powered by a multi-layered harmonic and phase calculation engine:
Harmonic Processing : Primary, secondary, and tertiary harmonics are calculated per period to capture multiple market cycles simultaneously. This reduces noise and amplifies meaningful signals.
Golden Ratio Modulation : Phase adjustments based on φ = 1.618 align harmonic contributions with natural market rhythms, smoothing lag and improving predictive value.
Adaptive Trend Scaling : Fast line expansion reflects short-term momentum; slow lines provide structural trend context. Fills adapt dynamically based on alignment intensity and harmonic amplitude.
Multi-Factor Trend Analysis : Trend strength is determined by alignment of fast and slow lines over multiple bars, expansion/contraction of harmonic amplitudes, divergences between primary, secondary, and tertiary harmonics and phase synchronization with golden ratio cycles.
These computations allow the indicator to be highly responsive yet smooth, providing traders with actionable insights in real time without overloading visual complexity.
Optimal Application Parameters
Asset-Specific Guidance:
Forex Majors : Wave frequency 1.0–2.0, φ = 1.618–1.8
Large-Cap Equities : Wave frequency 0.8–1.5, φ = 1.5–1.618
Cryptocurrency : Wave frequency 1.2–3.0, φ = 1.618–2.0
Index Futures : Wave frequency 0.5–1.5, φ = 1.618
Timeframe Optimization:
Scalping (1–5min) : Emphasize fast lines, higher frequency for micro-move capture.
Day Trading (15min–1hr) : Balance fast/slow interactions for trend confirmation.
Swing Trading (4hr–Daily) : Focus on slow lines for structural guidance, fast lines for entry timing.
Position Trading (Daily–Weekly) : Slow lines dominate; harmonics highlight long-term cycles.
Performance Characteristics
High Effectiveness Conditions:
Clear separation between short-term and long-term trends.
Moderate-to-high volatility environments.
Assets with consistent volume and price rhythm.
Reduced Effectiveness:
Flat or extremely low volatility markets.
Erratic assets with frequent gaps or algorithmic dominance.
Ultra-short timeframes (<1min), where noise dominates.
Integration Guidelines
Signal Confirmation : Confirm alignment of fast and slow lines over multiple bars. Expansion of harmonic amplitude signals trend persistence.
Risk Management : Place stops beyond slow line support/resistance. Adjust sizing based on compression/expansion zones.
Advanced Feature Settings :
Frequency tuning for different volatility environments.
Phase analysis to track divergences across harmonics.
Use fills and amplitude patterns as a guide for dynamic trade management.
Multi-timeframe confirmation to filter noise and align with structural trends.
Disclaimer
Harmonic Super Guppy is a trend analysis and visualization tool, not a guaranteed profit system. Optimal performance requires proper wave frequency, golden ratio phase, and line visibility settings per asset and timeframe. Traders should combine the indicator with other technical frameworks and maintain disciplined risk management practices.

vwap inside bar jmrjm vwap inside bar which helps to take guage trend with vwap and and help to understand when market taking pause due to bulls and bears fight. Then we can take a trade in trend with winners.

Simple Trading SessionsThis indicator highlights the major global trading sessions (Tokyo, London, and New York) directly on your chart with clean background shading.
Tokyo Session (default 00:00–09:00 exchange time)
London Session (default 07:00–16:00 exchange time)
New York Session (default 12:30–21:00 exchange time)
Each session is displayed as a different shaded block, making it easy to:
Spot when the market is most active.
Identify overlapping periods (e.g., London–New York overlap).
Backtest strategies that depend on session timing.
⚙️ How to Use
Add the indicator to any intraday chart.
Adjust session times in the settings panel to match your broker or preferred timezone.
Use the shading to guide your trading around regional liquidity zones.
✅ Notes
By default, session times follow the chart’s exchange timezone.
You can change the inputs to match your own session definitions.
Very lightweight and designed for traders who want a simple, uncluttered session map without extra calculations.

CCI Stochastic - YOSI
CCI Stochastic (Pro v6) – MTF, Adaptive Bands & Live Label
What it does
This indicator applies a Stochastic calculation on the CCI (K/D lines) to highlight momentum shifts, overbought/oversold zones, and adaptive market regimes. It comes with optional higher-timeframe confirmation, adaptive volatility bands, a live value label, and built-in alerts.
Key Features
Core Signal: Choose between D or K line of the Stoch-CCI.
Extreme Zones: Customizable OB/OS thresholds (default 80/20) and a midline (50), with dynamic background shading.
Adaptive Bands (optional): Mean ± k·standard deviation of the signal, to capture cyclic extremes.
MTF Confirmation (optional): Fetches the same signal from a higher timeframe via request.security.
Arrows/Signals:
Enter – Cross above OS (Buy) / below OB (Sell).
Center – Cross of the 50 midline (momentum shift).
Exit – Exit from extreme zones.
Alerts: All arrow signals + adaptive band crosses.
Live Value Label: Shows the latest signal value near the last bar, customizable decimals/offset/background colors.
Visuals: Red line above OB, green below OS, gray neutral; adaptive band fills.
Use Cases
Momentum / Reversals: Enter with OS/OB crosses confirmed by MTF.
Trend validation: Combine with moving averages (e.g., EMA200) or support/resistance.
Mean Reversion: Fade extreme zones, especially with adaptive band or OB/OS exit alerts.
Inputs
CCI Period, Stoch Period, Smooth K/D – core calculation.
Overbought / Oversold – thresholds (default 80/20).
Line to plot – K or D.
Show Arrows (Enter, Center, Exit) – visual control.
Adaptive Bands – length and k multiplier.
Higher TF – optional confirmation timeframe.
Live Label – decimals, offset, colors.
Quick Tips
For scalping/short-term setups: tighten OB/OS (e.g., 85/15) to filter noise.
In high volatility: increase adaptLen or decrease k to smooth bands.
Reduce false signals: require local + MTF alignment (e.g., only long if MTF > 50).
Disclaimer
This is a technical analysis tool – not a standalone buy/sell signal. Always use with proper risk management, key levels, and confluence from multiple factors.
מה זה עושה?
האינדיקטור מחשב Stochastic על CCI (קו K/D) ומציג אזורי קיצון, חציות ומשטרי שוק. הוא כולל אופציה לאישור מטיימפריים גבוה, בנדים אדפטיביים, תווית ערך חיה והתרעות מוכנות.
יכולות עיקריות
סיגנל מרכזי: בחירה בין קו D או K של Stoch-CCI.
אזורי קיצון: קווים ניתנים להגדרה (ברירת מחדל 80/20) וקו אמצע 50, עם צביעת רקע דינמית כשנכנסים לקיצון.
Adaptive Bands (אופציונלי): ממוצע ± k·סטיית תקן של הסיגנל—מסייע לזהות overheat ומחזוריות.
אישור MTF (אופציונלי): אותו סיגנל מטיימפריים גבוה באמצעות request.security.
חיצים/סיגנלים:
Enter – חציה מלמטה מעל OS (קנייה) / מלמעלה מתחת OB (מכירה).
Center – חציה של 50 (שינוי מומנטום).
Exit – יציאה מאזורים קיצוניים (OS/OB).
Alerts: לכל הסיגנלים לעיל + כניסה/יציאה לבנדים האדפטיביים.
תווית ערך חיה: מציגה את ערך הסיגנל האחרון ליד הנקודה (ספרות ו־offset ניתנים להגדרה).
עיצוב קריא: צבע קו אדום מעל OB, ירוק מתחת OS, אפור ניטרלי; מילוי אזורים.
שימוש מומלץ
מומנטום/היפוכים: כניסה עם חציה מה-OS/OB ואישור מה-MTF.
ממוצע נע/רמות מחיר: חברו לאימות מגמה (למשל EMA200 או תמיכה/התנגדות).
Mean Reversion: חיפוש חזרה מאזורי קיצון, במיוחד כשיש התרעת יציאה מ-OB/OS או נגיעה בבנד אדפטיבי.
קלטים מרכזיים
CCI Period, Stoch Period, Smooth K/D – פרמטרי חישוב.
Overbought / Oversold – ספי קיצון (ברירת מחדל 80/20).
Line to plot – בחירה בין K או D.
Show Arrows/Center/Exit/Enter – שליטה בתצוגת החיצים.
Adaptive Bands (len, k) – חלון ורגישות לבנדים.
Higher TF – טיימפריים לאישור (אופציונלי).
Live Label – ספרות, היסט ברים, צבעי רקע.
טיפים מהירים
בסקלפים/טווחים קצרים: הקשיחו ספי קיצון (למשל 85/15) להפחתת רעש.
בשוק תנודתי: העלו את adaptLen או הורידו את k כדי לקבל בנדים רגישים פחות.
להקטנת אותות שווא: דרשו התאמה בין הסיגנל המקומי ל-MTF (לדוגמה, לונג רק כשה-MTF מעל 50).
הערה חשובה
זהו כלי ניתוח טכני—לא אות קנייה/מכירה בפני עצמו. שלבו אותו עם ניהול סיכונים (SL/TP), בדיקת רמות מפתח ואימות ממספר אינדיקטורים או טיימפריימים.

Breakout + VWAP + Bollinger Bands BackgroundIt detects buy and sell bias for the trader to understand buy and sell openning. Try it...
