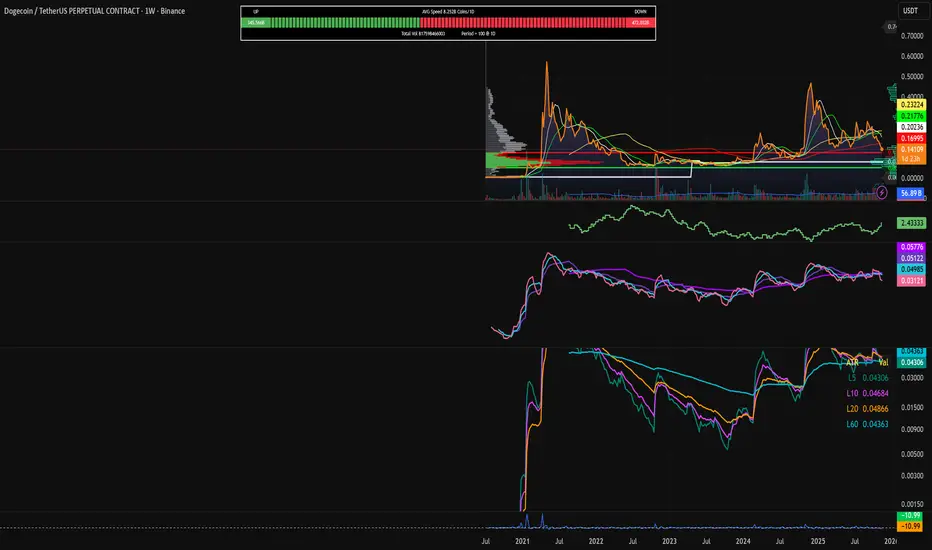
EMA 5/10/20/34/55/60/120/255Overview
- Plots eight Exponential Moving Averages on the price chart: EMA(5/10/20/34/55/60/120/255) .
- Designed for light (white) theme with high-contrast colors and uniform linewidth=1 .
- Written in Pine Script v6 ( overlay=true ), no alerts or extra visuals.
Why These Lengths
- 5, 10 : Short-term momentum and intraday rhythm.
- 20, 34 : Swing trend and pullback structure (34 is Fibonacci-based).
- 55, 60 : Deeper swing/weekly alignment commonly used by trend traders.
- 120, 255 : Mid/long-term trend filters (~half-year and ~annual trading days).
How To Read
- Trend filter: Price above EMA(120/255) favors bullish context; below favors bearish.
- Alignment: Strong bull trend when 5 > 10 > 20 > 34 > 55 > 60 > 120 > 255 and slopes up; inverse for bear trends.
- Pullbacks: Shallow pullbacks often respect 5/10 ; standard pullbacks 20/34 ; deeper tests 55/60 .
- Slope matters: Up/flat/down slopes of the longer EMAs ( 120/255 ) reflect trend strength more reliably than single crossovers.
Typical Use Cases
- Trend following: Trade in the direction of 120/255 and the stacked EMA order.
- Pullback entries: Look for stabilizing price action around 20/34 within a trend.
- Breakout confirmation: Sustain above/below a key EMA, then retest and hold.
- Risk management: Place stops beyond nearby EMAs, optionally buffered by ATR.
Tips
- Use the Data Window to identify each EMA line by its title ( EMA(5) , EMA(10) , etc.).
- Combine with volatility/strength filters (e.g., ATR, ADX) to reduce range-bound noise.
- Multi-timeframe consistency (e.g., higher TF EMA(255) aligned with current TF EMA(55/60) ) improves selectivity.
Limitations
- All moving averages are lagging by design; expect delayed signals.
- In consolidations, frequent crossovers can create whipsaws; apply filters or focus on slope and structure.
Disclaimer
- For educational purposes only. Not financial advice. Always validate on your instruments and timeframes and manage risk accordingly.
Indicators and strategies

Five Moving Averages (5, 10, 21, 50, 200)This helps to use multiple Moving averages . Using this indicator you can able to user 5 time frames at time .

Time-Decay Liquidity Zones [BackQuant]Time-Decay Liquidity Zones
A dynamic liquidity map that turns single-bar exhaustion events into fading, color-graded zones, so you can see where trapped traders and unfinished business still matter, and when those areas have finally stopped pulling price.
What this is
This indicator detects unusually strong impulsive moves into wicks, converts them into supply or demand “zones,” then lets those zones decay over time. Each zone carries a strength score that fades bar by bar. Zones that stop attracting or rejecting price are gradually de-emphasized and eventually removed, while the most relevant areas stay bright and obvious.
Instead of static rectangles that live forever, you get a living liquidity map where:
Zones are born from objective criteria: volatility, wick size, and optional volume spikes.
Zones “age” using a configurable decay factor and maximum lifetime.
Zone color and opacity reflect current relative strength on a unified clear → green → red gradient.
Zones freeze when broken, so you can distinguish “active reaction areas” from “historical levels that have already given way”.
Conceptual idea
Large wicks with strong volatility often mark areas where aggressive orders met hidden liquidity and got absorbed. Price may revisit these areas to test leftover interest or to relieve trapped positions. However, not every wick matters for long. As time passes and more bars print, the market “forgets” some areas.
Time-Decay Liquidity Zones turns that idea into a rule-based system:
Find bars that likely reflect strong aggressive flows into liquidity.
Mark a zone around the wick using ATR-based thickness.
Assign a strength score of 1.0 at birth.
Each bar, reduce that score by a decay factor and remove zones that fall below a threshold or live too long.
Color all surviving zones from weak to strong using a single gradient scale and a visual legend.
How events are detected
Detection lives in the Event Detection group. The script combines range, wick size, and optional volume filters into simple rules.
Volatility filter
ATR Length — computes a rolling ATR over your chosen window. This is the volatility baseline.
Min range in ATRs — bar range (High–Low) must exceed this multiple of ATR for an event to be considered. This avoids tiny bars triggering zones.
Wick filters
For each bar, the script splits the candle into body and wicks:
Upper wick = High minus the max(Open, Close).
Lower wick = min(Open, Close) minus Low.
Then it tests:
Upper wick condition — upper wick must be larger than Min wick size in ATRs × ATR.
Lower wick condition — lower wick must be larger than Min wick size in ATRs × ATR.
Only bars with a sufficiently long wick relative to volatility qualify as candidate “liquidity events”.
Volume filter
Optionally, the script requires a volume spike:
Use volume filter — if enabled, volume must exceed a rolling volume SMA by a configurable multiplier.
Volume SMA length — period for the volume average.
Volume spike multiplier — how many times above the SMA current volume needs to be.
This lets you focus only on “heavy” tests of liquidity and ignore quiet bars.
Event types
Putting it together:
Upper event (potential supply / long liquidation, etc.)
Occurs when:
Upper wick is large in ATR terms.
Full bar range is large in ATR terms.
Volume is above the spike threshold (if enabled).
Lower event (potential demand / short liquidation, etc.)
Symmetric conditions using the lower wick.
How zones are constructed
Zone geometry lives in Zone Geometry .
When an event is detected, the script builds a rectangular box that anchors to the wick and extends in the appropriate direction by an ATR-based thickness.
For upper (supply-type) zones
Bottom of the zone = event bar high.
Top of the zone = event bar high + Zone thickness in ATRs × ATR.
The zone initially spans only the event bar on the x-axis, but is extended to the right as new bars appear while the zone is active.
For lower (demand-type) zones
Top of the zone = event bar low.
Bottom of the zone = event bar low − Zone thickness in ATRs × ATR.
Same extension logic: box starts on the event bar and grows rightward while alive.
The result is a band around the wick that scales with volatility. On high-ATR charts, zones are thicker. On calm charts, they are narrower and more precise.
Zone lifecycle, decay, and removal
All lifecycle logic is controlled by the Decay & Lifetime group.
Each zone carries:
Score — a floating-point “importance” measure, starting at 1.0 when created.
Direction — +1 for upper zones, −1 for lower zones.
Birth index — bar index at creation time.
Active flag — whether the zone is still considered unbroken and extendable.
1) Active vs broken
Each confirmed bar, the script checks:
For an upper zone , the zone is counted as “broken” when the close moves above the top of the zone.
For a lower zone , the zone is counted as “broken” when the close moves below the bottom of the zone.
When a zone breaks:
Its right edge is frozen at the previous bar (no further extension).
The zone remains on the chart, but is no longer updated by price interaction. It still decays in score until removal.
This lets you see where a major level was overrun, while naturally fading its influence over time.
2) Time decay
At each confirmed bar:
Score := Score × Score decay per bar .
A decay value close to 1.0 means very slow decay and long-lived zones.
Lower values (closer to 0.9) mean faster forgetting and more current-focused zones.
You are controlling how quickly the market “forgets” past events.
3) Age and score-based removal
Zones are removed when either:
Age in bars exceeds Max bars a zone can live .
This is a hard lifetime cap.
Score falls below Minimum score before removal .
This trims zones that have decayed into irrelevance even if their age is still within bounds.
When a zone is removed, its box is deleted and all associated state is freed to keep performance and visuals clean.
Unified gradient and color logic
Color control lives in Gradient & Color . The indicator uses a single continuous gradient for all zones, above and below price, so you can read strength at a glance without guessing what palette means what.
Base colors
You set:
Mid strength color (green) — used for mid-level strength zones and as the “anchor” in the gradient.
High strength color (red) — used for the strongest zones.
Max opacity — the maximum visual opacity for the solid part of the gradient. Lower values here mean more solid; higher values mean more transparent.
The script then defines three internal points:
Clear end — same as mid color, but with a high alpha (close to transparent).
Mid end — mid color at the strongest allowed opacity.
High end — high color at the strongest allowed opacity.
Strength normalization
Within each update:
The script finds the maximum score among all existing zones.
Each zone’s strength is computed as its score divided by this maximum.
Strength is clamped into .
This means a zone with strength 1.0 is currently the strongest zone on the chart. Other zones are colored relative to that.
Piecewise gradient
Color is assigned in two stages:
For strength between 0.0 and 0.5: interpolate from “clear” green to solid green.
Weak zones are barely visible, mid-strength zones appear as solid green.
For strength between 0.5 and 1.0: interpolate from solid green to solid red.
The strongest zones shift toward the red anchor, clearly separating them from everything else.
Strength scale legend
To make the gradient readable, the indicator draws a vertical legend on the right side of the chart:
About 15 cells from top (Strong) to bottom (Weak).
Each cell uses the same gradient function as the zones themselves.
Top cell is labeled “Strong”; bottom cell is labeled “Weak”.
This legend acts as a fixed reference so you can instantly map a zone’s color to its approximate strength rank.
What it plots
At a glance, the indicator produces:
Upper liquidity zones above price, built from large upper wick events.
Lower liquidity zones below price, built from large lower wick events.
All zones colored by relative strength using the same gradient.
Zones that freeze when price breaks them, then fade out via decay and removal.
A strength scale legend on the right to interpret the gradient.
There are no extra lines, labels, or clutter. The focus is the evolving structure of liquidity zones and their visual strength.
How to read the zones
Bright red / bright green zones
These are your current “major” liquidity areas. They have high scores relative to other zones and have not yet decayed. Expect meaningful reactions, absorption attempts, or spillover moves when price interacts with them.
Faded zones
Pale, nearly transparent zones are either old, decayed, or minor. They can still matter, but priority is lower. If these are in the middle of a long consolidation, they often become background noise.
Broken but still visible zones
Zones whose extension has stopped have been overrun by closing price. They show where a key level gave way. You can use them as context for regime shifts or failed attempts.
Absence of zones
A chart with few or no zones means that, under your current thresholds, there have not been strong enough liquidity events recently. Either tighten the filters or accept that recent price action has been relatively balanced.
Use cases
1) Intraday liquidity hunting
Run the indicator on lower timeframes (e.g., 1–15 minute) with moderately fast decay.
Use the upper zones as potential sell reaction areas, the lower zones as potential buy reaction areas.
Combine with order flow, CVD, or footprint tools to see whether price is absorbing or rejecting at each zone.
2) Swing trading context
Increase ATR length and range/wick multipliers to focus only on major spikes.
Set slower decay and higher max lifetime so zones persist across multiple sessions.
Use these zones as swing inflection areas for larger setups, for example anticipating re-tests after breakouts.
3) Stop placement and invalidation
For longs, place invalidation beyond a decaying lower zone rather than in the middle of noise.
For shorts, place invalidation beyond strong upper zones.
If price closes through a strong zone and it freezes, treat that as additional evidence your prior bias may be wrong.
4) Identifying trapped flows
Upper zones formed after violent spikes up that quickly fail can mark trapped longs.
Lower zones formed after violent spikes down that quickly reverse can mark trapped shorts.
Watching how price behaves on the next touch of those zones can hint at whether those participants are being rescued or squeezed.
Settings overview
Event Detection
Use volume filter — enable or disable the volume spike requirement.
Volume SMA length — rolling window for average volume.
Volume spike multiplier — how aggressive the volume spike filter is.
ATR length — period for ATR, used in all size comparisons.
Min wick size in ATRs — minimum wick size threshold.
Min range in ATRs — minimum bar range threshold.
Zone Geometry
Zone thickness in ATRs — vertical size of each liquidity zone, scaled by ATR.
Decay & Lifetime
Score decay per bar — multiplicative decay factor for each zone score per bar.
Max bars a zone can live — hard cap on lifetime.
Minimum score before removal — score cut-off at which zones are deleted.
Gradient & Color
Mid strength color (green) — base color for mid-level zones and the lower half of the gradient.
High strength color (red) — target color for the strongest zones.
Max opacity — controls the most solid end of the gradient (0 = fully solid, 100 = fully invisible).
Tuning guidance
Fast, session-only liquidity
Shorter ATR length (e.g., 20–50).
Higher wick and range multipliers to focus only on extreme events.
Decay per bar closer to 0.95–0.98 and moderate max lifetime.
Volume filter enabled with a decent multiplier (e.g., 1.5–2.0).
Slow, structural zones
Longer ATR length (e.g., 100+).
Moderate wick and range thresholds.
Decay per bar very close to 1.0 for slow fading.
Higher max lifetime and slightly higher min score threshold so only very weak zones disappear.
Noisy, high-volatility instruments
Increase wick and range ATR multipliers to avoid over-triggering.
Consider enabling the volume filter with stronger settings.
Keep decay moderate to avoid the chart getting overloaded with old zones.
Notes
This is a structural and contextual tool, not a complete trading system. It does not account for transaction costs, execution slippage, or your specific strategy rules. Use it to:
Highlight where liquidity has recently been tested hard.
Rank these areas by decaying strength.
Guide your attention when layering in separate entry signals, risk management, and higher-timeframe context.
Time-Decay Liquidity Zones is designed to keep your chart focused on where the market has most recently “cared” about price, and to gradually forget what no longer matters. Adjust the detection, geometry, decay, and gradient to fit your product and timeframe, and let the zones show you which parts of the tape still have unfinished business.

Exchanges OpeningProvides an indicator 5 minutes before New York, London, Frankfurt, Tokyo, Hong Kong or Sydney Stock exchanges open with optional alerts if you create one for the script.

Advanced Triple Strategy ScalperHere are the three scalping strategies presented in the video "3 Scalping Strategies That Work Every Day (Backtested & Proven)" by Asia Forex Mentor – Ezekiel Chew:
### Scalper’s Trend Filter (Triple EMA)
This strategy uses three EMAs (25, 50, 100) on the 5-minute chart to filter high-probability trades aligned with momentum .
- Only trade when all three EMAs are angled in the same direction and clearly separated (no crossing or tangling) .
- Enter when price pulls back toward the 25 or 50 EMA and then bounces back toward the 25 EMA, but do not enter if price closes below the 100 EMA .
- Set stop-loss just below the 50 EMA or swing low and aim for a risk-to-reward ratio of 1:1.5 .
### Flip Zone Trap (Reversal Catching)
This method identifies precise reversal moments where market structure shifts from weakness to strength .
- Use the 15-min chart to locate key support or resistance zones where price previously reacted .
- Wait for price to stop making lower lows and begin making higher highs (or vice versa for shorts); confirm with a trendline break AND follow-through (higher lows & highs within 5-7 candles) .
- Use confirmation candles (bullish engulfing, pin bar rejection) at the zone before entry .
### Liquidity Shift Trigger (Smart Money Trap)
This system leverages institutional stop hunts and liquidity sweeps at key zones for sniper entries .
- Start with a 15-min chart to identify structure breaks and points of interest (order blocks, flip zones, demand zones) .
- Drop to 1-min chart and wait for price to enter the refined zone and sweep liquidity (sharp wick/spike below/above key level) .
- Once liquidity is swept, wait for a clean structure shift (break of most recent internal high or low) within 5–6 candles—if confirmed, refine entry to the candle that caused the break and enter when price returns to that candle with a strong reaction .
***
### Practical Application
- These strategies are systematic, rule-based, and designed to cut out fake moves, avoid early stop-outs, and align entries with momentum and institutional activity .
- Perfect for short timeframes and volatile pairs like XAUUSD, especially if paired with additional confirmation from other technical analysis tools .
All three strategies emphasize filtering noise, waiting for momentum/trend confirmation, and avoiding impulsive entries—key principles for consistent scalping success

RSI Ensemble Confidence [CHE]RSI Ensemble Confidence — Measures RSI agreement across multiple lengths and price sources
Summary
This indicator does not just show you one RSI — it shows you how strongly dozens of different RSI variants agree with each other right now.
The Confidence line (0–100) is the core idea:
- High Confidence → almost all RSIs see the same thing → clean, reliable situation
- Low Confidence → the RSIs contradict each other → the market is messy, RSI signals are questionable
How it works (exactly as you wanted it described)
1. Multiple RSIs instead of just one
The indicator builds a true ensemble:
- 4 lengths (default 8, 14, 21, 34)
- 6 price sources (Close, Open, High, Low, HL2, OHLC4 – individually switchable)
→ When everything is enabled, up to 24 different RSIs are calculated on every single bar.
These 24 opinions form a real “vote” about the current market state.
2. Mean and dispersion
From all active RSIs it calculates:
- rsiMean → the average opinion of the entire ensemble (orange line)
- rsiStd → how far the individual RSIs deviate from each other
Small rsiStd = they all lie close together → strong agreement
Large rsiStd = they are all over the place → contradiction
3. Confidence (0–100)
The standard deviation is compared to the user parameter “Max expected StdDev” (default 20):
- rsiStd = 0 → Confidence ≈ 100
- rsiStd = maxStd → Confidence ≈ 0
- Everything in between is scaled linearly
If only one RSI is active, Confidence is automatically set to ~80 for practicality.
What you see on the chart
1. Classic reference RSI – blue line (Close, length 14) → your familiar benchmark
2. Ensemble mean – orange line → the true consensus RSI
±1 StdDev band (optional) → shows dispersion directly:
- narrow band = clean, consistent setup
- wide band = the RSIs disagree → caution
3. Confidence line (aqua, 0–100) → your quality meter for any RSI signal
4. StdDev histogram (optional, fuchsia columns) → raw dispersion if you prefer the unscaled value
5. Background coloring
- Greenish ≥ 80 → high agreement
- Orange 60–80 → medium
- Reddish < 40 → strong disagreement
- Transparent below that
6. Two built-in alerts
- High Confidence (crossover 80)
- Low Confidence (crossunder 40)
Why this indicator is practically useful
1. Perfect filter for all RSI strategies
Only trade overbought/oversold, divergences, or failures when Confidence ≥ 70. Skip or reduce size when Confidence < 40.
2. Protection against overinterpretation
You immediately see whether a “beautiful” RSI hook is confirmed by the other 23 variants — or whether it’s just one outlier fooling you.
3. Excellent regime detector
Long periods of high Confidence = clean trends or clear overbought/oversold phases
Constantly low Confidence = choppy, noisy market → RSI becomes almost useless
4. Turns gut feeling into numbers
We all sometimes think “this setup somehow doesn’t feel right”. Now you have the exact number that says why.
Disclaimer
The content provided, including all code and materials, is strictly for educational and informational purposes only. It is not intended as, and should not be interpreted as, financial advice, a recommendation to buy or sell any financial instrument, or an offer of any financial product or service. All strategies, tools, and examples discussed are provided for illustrative purposes to demonstrate coding techniques and the functionality of Pine Script within a trading context.
Any results from strategies or tools provided are hypothetical, and past performance is not indicative of future results. Trading and investing involve high risk, including the potential loss of principal, and may not be suitable for all individuals. Before making any trading decisions, please consult with a qualified financial professional to understand the risks involved.
By using this script, you acknowledge and agree that any trading decisions are made solely at your discretion and risk.
Do not use this indicator on Heikin-Ashi, Renko, Kagi, Point-and-Figure, or Range charts, as these chart types can produce unrealistic results for signal markers and alerts.
Best regards and happy trading
Chervolino

Rotation SentinelROTATION SENTINEL v1.1 — OVERVIEW
Rotation Sentinel is a macro rotation engine that tracks 10 institutional-grade dominance, liquidity, and trend signals to identify when capital is flowing into altcoins.
Each row outputs Green / Yellow / Red, and the system produces a 0–10 Rotation Score plus a final regime:
🔴 NO ROTATION (0–4)
🟡 ROTATION STARTING (5–6)
🟢 ALTSEASON (7–10)
Use on Daily timeframe for best accuracy.
KEY SIGNALS
1️⃣ BTC.D ex-stables
Shows true BTC vs alt strength.
🟢 Falling = capital rotating into alts.
🔴 Rising = alts bleeding. (Master switch.)
2️⃣ OTHERS.D
Broad altcoin dominance.
🟢 Rising = early alt strength.
🔴 Falling = weak participation.
3️⃣ ETH/BTC
Rotation ignition.
🟢 ETH outperforming = rotation can start.
🔴 ETH lagging = altseason impossible.
4️⃣ STABLE.C.D
Crypto “fear index.”
🟢 Falling = risk-on environment.
🔴 Rising = capital hiding in stables.
5️⃣ USDT.D
Real-time risk positioning.
🟢 Falling = capital deploying.
🔴 Rising = defensive.
6️⃣ TOTAL3 (HTF Trend)
Structural alt market health.
🟢 Above SMA + rising = bullish structure.
🔴 Below SMA + falling = systematic weakness.
7️⃣ TOTAL3 / TOTAL2
Depth of rotation.
🟢 Mid/small caps outperforming = deep rotation.
🔴 Only large caps moving = shallow cycle.
8️⃣ Risk Ratio (OTHERS.D / STABLE.C.D)
Pure risk appetite.
🟢 Alts gaining on stables = risk-on.
9️⃣ OTHERS/BTC
Alt value vs BTC.
🟢 Rising = alts outperforming BTC.
🔟 Liquidation Heatmap (Manual)
Update from Hyblock/Coinalyze.
🟢 Liquidity above = upside easier.
ALTSEASON TRIGGER
Fires only when all 6 core conditions turn GREEN:
BTC.D ex-stables
OTHERS.D
ETH/BTC
STABLE.C.D
TOTAL3 structure
Rotation Score ≥ threshold (default 7)
BEST PRACTICES
Use Daily timeframe (macro rotation, not intraday noise)
Score < 5 → defensive / selective trades
Score 5–6 → early rotation window
Score ≥ 7 → confirmed altseason regime
Let alerts notify you; no need to manually monitor
INCLUDED ALERTS
🚨 ALTSEASON TRIGGERED
⚠️ Rotation Score Crossed Threshold
📈 ETH/BTC Rotation Clock Activated
🔥 OTHERS.D Breaking Higher

Institution Radar Institution Radar
Institution Radar compares Price RSI with Volume-Delta RSI to show when price moves are real (backed by volume) or fake (moving without volume).
This helps reveal two powerful concepts:
Absorption (Bullish or Bearish)
Absorption happens when a large limit order is sitting in the order book.
Market orders hit it over and over, but the level doesn't break.
This usually means:
Strong players are absorbing the aggressive orders
Price is likely to move in the opposite direction
The next candle often reacts immediately
Can lead to a full reversal or just a short 1–2 candle move
Exhaustion (Bullish or Bearish)
Exhaustion happens when institutions pull their limit orders away.
There is no real volume behind the move, so price drifts up or down easily.
This usually means:
The current move is weak
A slowdown, pullback, or reversal is likely
Often shows up right before a flip in direction
📌 What the Signals Mean
Green signal → next candles often push upward
Red signal → next candles often push downward
These can mark trend reversals or temporary 1–2 candle reactions
🎚️ Sensitivity Setting
You can adjust how strict the signals are:
Lower sensitivity = more signals, more noise
Higher sensitivity = fewer signals, but more accurate and stronger
A higher sensitivity is recommended if you only want the cleanest institutional moments.

BTC Macro Heatmap (Fed Cuts & Hikes)🔴 1. Red line – Fed Funds Rate (policy trend)
This line tells you what stage of the monetary cycle we’re in.
Rising red line = the Fed is hiking → liquidity is tightening → money leaves risk assets like BTC.
Flat = pause → markets start pricing in the next move (often sideways BTC).
Falling = easing / cutting → liquidity returns → bullish environment builds.
The rate of change matters more than the level. When the slope turns down, capital starts seeking yield again — BTC benefits first because it’s the most volatile asset.
💚 2. Dim green zones – detected cuts
These are data-based easing events pulled directly from FRED.
They show when the actual effective rate began moving down, not necessarily the exact meeting day.
Think of them as the Fed’s “foot off the brake” — that’s when risk markets begin responding.
🟩 3. Bright green lines – official FOMC cuts
These are the real policy shifts — the Fed formally changed direction.
After these appear, BTC historically transitions from accumulation → markup phase.
Look at 2020: the bright green lines came right before BTC’s full reversal.
You’re seeing the same thing now with the 2025 lines — early-stage liquidity return.
🟠 4. Orange line – DXY (US Dollar Index)
DXY is your “risk-off” gauge.
When DXY rises, global investors flock to dollars → BTC usually weakens.
When DXY peaks and starts dropping, it means risk appetite is coming back → BTC rallies.
BTC and DXY are inversely correlated about 70–80% of the time.
Watch for DXY lower highs after rate cuts — that’s your macro confirmation of a BTC-friendly environment.
🟦 5. Aqua line – BTC (normalized)
You’re not looking for the price itself here, but its shape relative to DXY and the Fed line.
When BTC curls up as the red line flattens and DXY rolls over → that’s historically the start of a major bull phase.
BTC tends to bottom before the first cut and explode once DXY decisively breaks down.
🧠 Putting it together
Here’s the rhythm this chart shows over and over:
Fed hikes (red line rising) → BTC weakens, DXY climbs.
Fed pauses (red line flat) → BTC stops falling, DXY tops.
Fed cuts (dim + bright green) → DXY turns down → BTC begins long recovery → bull cycle starts.

Tokyo & London Pre-Market Boxes (Local Time)//@version=5
indicator("Daily 10am & 6pm Lines", overlay=true)
var line line10 = na
var line line18 = na
// Convert 10:00 and 18:00 into timestamps for today
t10 = timestamp(year, month, dayofmonth, 10, 0)
t18 = timestamp(year, month, dayofmonth, 18, 0)
// When the bar’s time crosses 10:00, draw a vertical line
if (time >= t10 and time < t10)
line10 := line.new(x1 = t10, y1 = low, x2 = t10, y2 = high, color=color.blue, width = 1)
// When the bar’s time crosses 18:00 (6pm), draw another line
if (time >= t18 and time < t18)
line18 := line.new(x1 = t18, y1 = low, x2 = t18, y2 = high, color=color.red, width = 1)

RSI to 50 (decimal version) - TemujinTradingSimple indicator that shows the price levels required for the RSI to get to the value of 50.
What I observe is 50 rsi often acts as support or resistance and is a fair indication of bullish/bearish sentiment and price action and bounce/rejection levels.
It provides a table showing current time frame, 4 hr, daily, weekly describing the current rsi value and the price needed for that rsi to get to 50. This table is colored red when bearish at the time frame and green when bullish (as per <50 rsi or >50rsi).
Plots historical lines of each previous candle in the series showing how price interacts.
Updated script to allow manual input of price decimals to enable more assets price to be viewable in the table format.

Delta Δ Coinbase / BinanceThe Delta Coinbase Binance indicator simply shows the price difference (spread) between Bitcoin on Coinbase (BTC/USD) and Binance (BTC/USDT). If positive (e.g., +$50), it means Coinbase price is higher, signaling strong buying from US investors (premium). If negative (e.g., -$100), Coinbase is cheaper, indicating selling pressure from the US side (discount). It's smoothed with SMMA(2) for clearer trends.

RSI to 50 - TemujinTradingSimple indicator that shows the price levels required for the RSI to get to the value of 50.
What I observe is 50 rsi often acts as support or resistance and is a fair indication of bullish/bearish sentiment and price action and bounce/rejection levels.
It provides a table showing current time frame, 4 hr, daily, weekly describing the current rsi value and the price needed for that rsi to get to 50. This table is colored red when bearish at the time frame and green when bullish (as per <50 rsi or >50rsi).
Plots historical lines of each previous candle in the series showing how price interacts.


Dioptra ~XYXCMy edited version of White Noise Indicator ( Normalized KAMA Oscillator ) by user IkkeOmar.

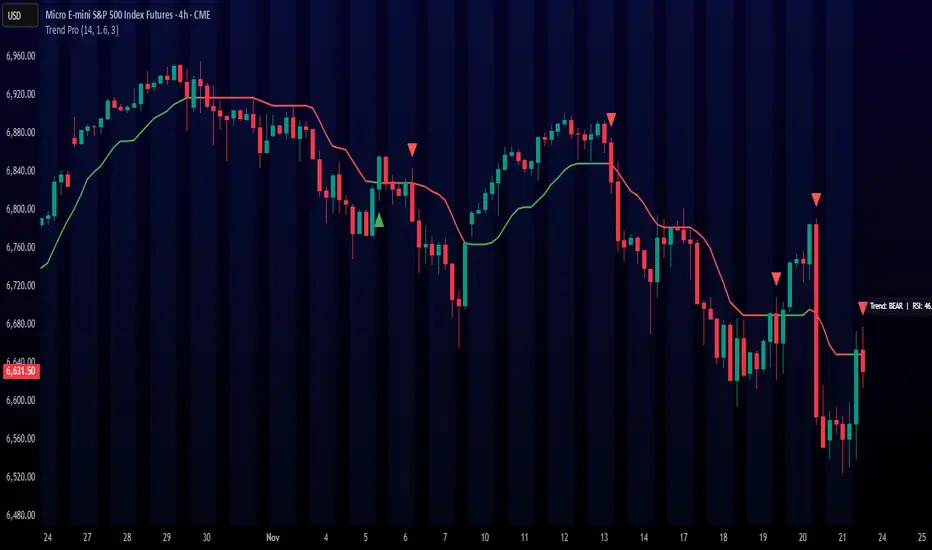
Trend ProTrend Pro is a volatility-adaptive trend and momentum system designed for scalping, day trading, and short-term swing trading.
It uses an ATR-based dynamic trend line (Alpha-Trend style) to identify momentum shifts and confirm directional strength.
Unlike traditional moving averages, Trend Pro adapts to volatility and reacts faster during expansions while filtering noise during chop.
🔍 How Trend Pro Works
Trend Pro builds a dynamic volatility channel using ATR and tracks whether price stays above or below this adaptive line.
When price crosses and closes on the opposite side, it suggests a shift in market control.
When price closes above the line → the trend turns BULLISH (green)
When price closes below the line → the trend turns BEARISH (red)
This gives a clear, visual trend state without repainting.
Tips for Best Performance:
✔ Avoid signals directly inside major ranges or sideways chop
✔ Strongest entries come after small pullbacks into the line
✔ Combine signals with:
Market structure
Key swing highs/lows
Liquidity sweeps
Session timing (NYSE open, power hour)
✔ Trend Pro works best when used with the trend, not counter-trend
Enjoy!
Relative Performance vs XAO (Histogram)RSC Relative Strength Comparison is used to compare performance of a Sector Index or Stock against a Benchmark (Index). The Benchmark used is the Australian All Ordinaries Index with a look back period of 63 days (3 months). Both the benchmark and look back period may be changed in the code to suit.

20W EMA – Macro Only (Perfectly Clean)Bitcoin 20 week moving average script showing buy / sell signals
Stochastic Pro+ Suite📚 What Is the Stochastic Oscillator?
The stochastic oscillator is a momentum indicator comparing a security's closing price to its price range over a set number of periods. The %K line represents the raw stochastic value, while the %D line is a smoothed moving average of %K.
Stochastic helps identify:
Overbought and oversold conditions
Bullish and bearish crossovers
Momentum shifts before price reversals
It is widely used in both trending and ranging markets.
💡 What Makes This Suite Different?
This script supercharges the traditional stochastic with a multi-timeframe engine , divergence detection , and a highly customizable visual suite , including:
✅ Core Features:
- Multi-Timeframe (%K, %D, Spread): Pulls stochastic data from any higher timeframe for improved signal quality.
- Custom Overbought/Oversold Levels: Fully adjustable OB/OS thresholds (default: 80/20).
- %K-%D Spread Histogram: View the difference between %K and %D visually as a histogram.
- Color-coded Cross Highlights: Optional background shading for key crossover events in OB/OS zones (high probability reversal areas).
🔍 Divergence Detection (Optional):
- Bullish Divergence: Price makes lower lows while %K makes higher lows.
- Bearish Divergence: Price makes higher highs while %K makes lower highs.
- Customizable pivot lookbacks and range filters to control divergence strictness.
- Visual divergence labels plotted directly on the oscillator.
🎛️ Fully Toggleable Visuals:
Show/hide %K, %D, OB/OS lines, spread histogram, background highlight, and divergence — all via simple checkboxes.
🔔 Alerts:
Set alerts for both bullish and bearish divergences — ideal for swing, day, or trend reversal strategies.
⚙️ Use Cases
- Spot exhaustion in overbought/oversold zones
- Confirm or filter entries with divergence signals
- Monitor multiple timeframes without switching charts
- Use as a signal tool in confluence with price action or volume indicators
⚠️ Disclaimer
This tool is for educational and informational purposes only. It does not constitute financial advice, trading advice, or investment guidance. Always do your own research and consult a qualified financial advisor before making trading decisions.

Day Trading Signals - Ultimate Pro (Dark Neon + Strong BB Cloud)//@version=5
indicator("Day Trading Signals - Ultimate Pro (Dark Neon + Strong BB Cloud)", overlay=true, max_lines_count=500, max_labels_count=500)
// ===== INPUTS =====
ema_fast_len = input.int(9, "Fast EMA Length")
ema_slow_len = input.int(21, "Slow EMA Length")
rsi_len = input.int(12, "RSI Length")
rsi_overbought = input.int(70, "RSI Overbought Level")
rsi_oversold = input.int(30, "RSI Oversold Level")
bb_len = input.int(20, "Bollinger Bands Length")
bb_mult = input.float(2.0, "Bollinger Bands Multiplier")
sr_len = input.int(15, "Pivot Lookback for Support/Resistance")
min_ema_gap = input.float(0.0, "Minimum EMA Gap to Define Trend", step=0.1)
sr_lifespan = input.int(200, "Bars to Keep S/R Lines")
// Display options
show_bb = input.bool(true, "Show Bollinger Bands?")
show_ema = input.bool(true, "Show EMA Lines?")
show_sr = input.bool(true, "Show Support/Resistance Lines?")
show_bg = input.bool(true, "Show Background Trend Color?")
// ===== COLORS (Dark Neon Theme) =====
neon_teal = color.rgb(0, 255, 200)
neon_purple = color.rgb(180, 95, 255)
neon_orange = color.rgb(255, 160, 60)
neon_yellow = color.rgb(255, 235, 90)
neon_red = color.rgb(255, 70, 110)
neon_gray = color.rgb(140, 140, 160)
sr_support_col = color.rgb(0, 190, 140)
sr_resist_col = color.rgb(255, 90, 120)
// ===== INDICATORS =====
ema_fast = ta.ema(close, ema_fast_len)
ema_slow = ta.ema(close, ema_slow_len)
ema_gap = math.abs(ema_fast - ema_slow)
trend_up = (ema_fast > ema_slow) and (ema_gap > min_ema_gap)
trend_down = (ema_fast < ema_slow) and (ema_gap > min_ema_gap)
trend_flat = ema_gap <= min_ema_gap
rsi = ta.rsi(close, rsi_len)
bb_mid = ta.sma(close, bb_len)
bb_upper = bb_mid + bb_mult * ta.stdev(close, bb_len)
bb_lower = bb_mid - bb_mult * ta.stdev(close, bb_len)
// ===== SUPPORT / RESISTANCE =====
pivot_high = ta.pivothigh(high, sr_len, sr_len)
pivot_low = ta.pivotlow(low, sr_len, sr_len)
var line sup_lines = array.new_line()
var line res_lines = array.new_line()
if show_sr and not na(pivot_low)
l = line.new(bar_index - sr_len, pivot_low, bar_index, pivot_low, color=sr_support_col, width=2, extend=extend.right)
array.push(sup_lines, l)
if show_sr and not na(pivot_high)
l = line.new(bar_index - sr_len, pivot_high, bar_index, pivot_high, color=sr_resist_col, width=2, extend=extend.right)
array.push(res_lines, l)
// Delete old S/R lines
if array.size(sup_lines) > 0
for i = 0 to array.size(sup_lines) - 1
l = array.get(sup_lines, i)
if bar_index - line.get_x2(l) > sr_lifespan
line.delete(l)
array.remove(sup_lines, i)
break
if array.size(res_lines) > 0
for i = 0 to array.size(res_lines) - 1
l = array.get(res_lines, i)
if bar_index - line.get_x2(l) > sr_lifespan
line.delete(l)
array.remove(res_lines, i)
break
// ===== BUY / SELL CONDITIONS =====
buy_cond = trend_up and not trend_flat and ta.crossover(ema_fast, ema_slow) and rsi < rsi_oversold and close < bb_lower
sell_cond = trend_down and not trend_flat and ta.crossunder(ema_fast, ema_slow) and rsi > rsi_overbought and close > bb_upper
// ===== SIGNAL PLOTS =====
plotshape(buy_cond, title="Buy Signal", location=location.belowbar, color=neon_teal, style=shape.labelup, text="BUY", size=size.small)
plotshape(sell_cond, title="Sell Signal", location=location.abovebar, color=neon_red, style=shape.labeldown, text="SELL", size=size.small)
// ===== EMA LINES =====
plot(show_ema ? ema_fast : na, color=neon_orange, title="EMA Fast", linewidth=2)
plot(show_ema ? ema_slow : na, color=neon_purple, title="EMA Slow", linewidth=2)
// ===== STRONG BOLLINGER BAND CLOUD =====
plot_bb_upper = plot(show_bb ? bb_upper : na, color=color.new(neon_yellow, 20), title="BB Upper")
plot_bb_lower = plot(show_bb ? bb_lower : na, color=color.new(neon_gray, 20), title="BB Lower")
plot(bb_mid, color=color.new(neon_gray, 50), title="BB Mid")
// More visible BB cloud (stronger contrast)
bb_cloud_color = trend_up ? color.new(neon_teal, 40) : trend_down ? color.new(neon_red, 40) : color.new(neon_gray, 70)
fill(plot_bb_upper, plot_bb_lower, color=show_bb ? bb_cloud_color : na, title="BB Cloud")
// ===== BACKGROUND COLOR (TREND ZONES) =====
bgcolor(show_bg ? (trend_up ? color.new(neon_teal, 92) : trend_down ? color.new(neon_red, 92) : color.new(neon_gray, 94)) : na)
// ===== ALERTS =====
alertcondition(buy_cond, title="Buy Signal", message="Buy signal triggered. Check chart.")
alertcondition(sell_cond, title="Sell Signal", message="Sell signal triggered. Check chart.")
