Spot-Futures SpreadSpot-Futures Spread Indicator
A comprehensive indicator that automatically calculates and visualizes the percentage spread between spot and perpetual futures prices across multiple exchanges.
Key Features:
Automatic Exchange Detection - Automatically detects your current exchange and finds the corresponding spot/futures pair
Smart Fallback System - If the counterpart isn't available on your exchange, it automatically searches across 7+ major exchanges (Binance, Bybit, OKX, Gate.io, MEXC, KuCoin, HTX) and uses the first valid match
Multi-Exchange Support - Works with 14 exchanges including Binance, Bybit, OKX, MEXC, BitGet, Gate.io, KuCoin, and more
Clear Exchange Attribution - Shows exactly which exchanges are providing spot and futures data in the statistics table
Configurable Moving Average - Track the average spread with customizable period
Standard Deviation Bands - Identify unusual spread conditions with Bollinger-style bands
Built-in Alerts - Get notified when spread crosses bands or zero (parity)
Statistics Table - Real-time stats showing current spread, MA, std dev, and bands
Manual Override Options - Advanced users can manually specify exchanges and symbols
How It Works:
The indicator calculates the spread as: (Futures Price - Spot Price) / Spot Price × 100
Positive spread = Futures trading at a premium (contango)
Negative spread = Futures trading at a discount (backwardation)
Zero = Parity between spot and futures
Use Cases:
Funding Rate Analysis - Correlates with perpetual funding rates
Arbitrage Opportunities - Identify significant spot-futures divergences
Market Sentiment - Premium/discount indicates bullish/bearish positioning
Cross-Exchange Analysis - Compare spreads when spot and futures are on different exchanges
Smart Features:
Works whether you're viewing a spot or futures chart
Automatically handles exchange-specific perpetual contract naming (.P, PERP, SWAP, etc.)
Color-coded visualization (green for premium, red for discount)
Customizable colors and display options
Background shading based on spread direction
Perfect For:
Crypto traders monitoring funding rates, arbitrage traders, market makers, and anyone interested in spot-futures dynamics across multiple exchanges.
Getting Started:
Simply add the indicator to any spot or perpetual futures chart. It will automatically detect the exchange and find the corresponding pair. The statistics table shows which exchanges are being used for maximum transparency.
Note: The indicator automatically ignores invalid symbols, so you'll never see errors even if a specific pair doesn't exist on a particular exchange.
Kudos to @AlekMel that made the "Spot - Fut Spread v2" indicator that I enhance the Automatic detection feature which was not working in some case.
Indicators and strategies

ZigZagZigZag Indicator – Overview
This ZigZag indicator highlights the most important swing highs and swing lows on the chart, helping traders see market structure more clearly by filtering out minor price movements. It connects significant turning points with straight lines, creating a clean visual representation of trend direction and major reversals.
How It Works
Price constantly moves up and down, but not every movement is meaningful. The ZigZag indicator waits for price to make a move large enough to be considered a true swing point. Once such a movement occurs, the indicator identifies it as either a swing high or a swing low and draws a line connecting it to the previous swing.
This produces a simplified outline of market structure, making it easier to recognize trends, corrections, and major turning points.
Settings
ZigZag Length
Controls the sensitivity of the indicator.
Lower values produce more frequent swing points.
Higher values show only major swings and reduce noise.
Show ZigZag
Enables or disables the visual lines. When disabled, the indicator continues tracking swing points internally.
What You See on the Chart
Every time the market creates a confirmed swing high or swing low, the indicator draws a line to the previous swing in the opposite direction.
After a major low is confirmed, a line is drawn to the most recent high.
After a major high is confirmed, a line is drawn to the most recent low.
This creates a clear, continuous zigzag that outlines the dominant movements of the market without reacting to every small fluctuation.
Why This ZigZag Is Useful
It does not repaint once a swing is confirmed.
It provides a clean and simplified view of price structure.
It helps identify trend direction, structure breaks, impulses, and corrections.
It is useful for traders who follow price action, smart money concepts, and swing-based strategies.
Recommended Use Cases
This ZigZag indicator is suited for traders who rely on market structure analysis, including:
Swing trading
Smart Money Concepts (BOS/CHOCH detection)
Identifying impulses and pullbacks
Finding strong highs and lows
Studying overall trend direction

Golden BOS Strategy - ChecklistA clean, mechanical on-chart checklist designed for multi-timeframe traders using the Golden BOS / Institutional Retracement Framework.
This tool helps you stay disciplined by tracking each requirement of the strategy in real time:
Included Criteria
4H Bias: Bullish or bearish macro structure
1H Structure: Push/pull phase + golden zone retracement
5M Entry Model:
Break of Structure (BOS)
5M golden zone retracement
POI validation (OB/FVG/Breaker)
Final micro BOS or rejection confirmation
Risk Filters:
Session validity (London / NY)
Red news avoidance
Stop-loss placement check
Liquidity-based target confirmation
Purpose
This overlay ensures every trade meets strict criteria before execution, removing emotion and improvisation. Ideal for backtesting, forward testing, and staying consistent during live market conditions.
Golden BOS Strategy — Description
The Golden BOS Strategy is a structured, multi-timeframe trading system designed to capture high-probability continuation moves during London and New York sessions. The strategy combines institutional concepts with Fibonacci-based retracements to identify discounted entry zones aligned with higher-timeframe direction.
Using the 4H timeframe, traders establish the daily macro bias and identify the dominant trend. The 1H chart is then used to confirm the current phase of market structure, distinguishing between impulsive “push” moves and corrective “pullback” phases. A Fibonacci retracement is applied to the most recent 1H impulse leg to define a high-value discount or premium zone where entries become valid.
Execution takes place on the 5-minute chart. Once price reaches the 1H golden zone (61.8–78.6%), a Break of Structure (BOS) is required to confirm a shift in short-term momentum. A second Fibonacci retracement is then drawn on the 5M impulse leg that caused the BOS, and price must retrace back into the 5M golden zone. Traders refine their entry using a confluence point of interest (POI) such as a Fair Value Gap (FVG), Order Block, Breaker Block, or Inverse FVG, ideally accompanied by a final micro BOS or rejection candle.
Risk management is strict and rule-driven. Stop loss is placed beyond the extreme wick of the POI, while take-profit targets are set at logical liquidity pools in the direction of the higher-timeframe trend. The strategy avoids red-folder news and only allows trades during active sessions to ensure optimal volatility and reliability.
The Golden BOS Strategy is designed to impose discipline, reduce discretionary errors, and give traders a repeatable, mechanical framework for navigating trending markets with precision.

KJS -- Max Volume CandleKJS — Max Volume Candle
Identifies and highlights the highest-volume candle relative to all candles to its left on the chart.
As each new bar forms, the script checks whether its volume exceeds every prior bar. When a new volume peak appears, that candle is marked (blue for bullish, yellow for bearish), making it easy to spot where momentum, participation, or exhaustion reached a new extreme.
Use it to quickly identify:
• True volume pivots during momentum runs
• Potential trap candles and liquidity grabs
• Continuation moves backed by breakout volume
• Shifts in participation that may precede reversals
The indicator updates automatically as you scroll and works on any symbol and timeframe.

Stochastic Ensembling of OutputsStochastic Ensembling of Outputs
🙏🏻 This is a simple tool/method that would solve naturally many well known problems:
“Price reversed 1 tick before the actual level, not executing my limit order”
“I consider intraday trend change by checking whether price is above/below VWAP, but is 1 tick enough? What to do, price is now whipsawing around vwap...”.
“I want to gradually accumulate a position around a chosen anchor. But where exactly should I put my orders? And I want to automate it ofc.“
“All these DSP adepts are telling you about some kind of noise in the markets… But how can I actually see it?”
The easy fix is to make things more analog less digital, by synthesizing numerous noise instances & adding it to any price-applied metric of yours. The ones who fw techno & psytrance, and other music, probably don’t need any more explanations. Then by checking not just 2 lines or 1 process against another one, you will be checking cloud vs cloud of lines, even allowing you to introduce proxies of probabilities. More crosses -> more confirmation to act.
How-to use:
The tool has 2 inputs: source and target:
Sources should always be the underlying process. If you apply the tool to price based metric, leave it hlcc4 unless you have a better one point estimate for each bar;
Target is your target, e.g if you want to apply it to VWAP, pick VWAP as target. You can thee on the chart above how trading activity recently never exactly touched VWAP, however noised instances of VWAP 'were' touched
The code is clean and written in modular form, you can simply copy paste it to any script of yours if you don't want to have multiple study-on-study script pairs.
^^ applied to prev days highs and lows
^^ applied to MBAD extensions and basis
^^ applied to input series itself
Here’s how it works, no ML, no “AI”, no 1k lines of code, just stats:
The problem with metrics, even if they are time aware like WMA, is that they still do not directly gain information about “changes” between datapoints. If we pick noise characteristics to match these changes, we’d effectively introduce this info into our ops.
^^ this screenshot represents 2 very different processes: a sine wave and white noise, see how the noise instances learned from each process differ significantly.
Changes can be represented as AR1 process . It’s dead simple, no PHD needed, it’s just how the current datapoint is related (or not) to the previous datapoint, no more than 1, and how this relationship holds/evolves over time. Unlike the mainstream approach like MLE, I estimate this relationship (phi parameter) via MoM but giving more weights to more recent datapoints via exponential smoothing over all the data available on your charts (so I encode temporal information), algocomplexity is O(1), lighting fast, just one pass. <- that gives phi , we’d use it as color for our noise generator
Then we just need to estimate noise amplitude ( gamma ) via checking what AR1 model actually thought vs the reality, variance of these innovations. Same via exponential smoothing, time aware, O(1), one pass, it’s all it does.
Then we generate white gaussian noise, and apply 2 estimated parameters (phi and gamma), and that’s all.
Omg, I think I just made my first real DSP script xd
Just like Monte Carlo for risk management, this is so simple and natural I can’t believe so many “pros” hide it and never talk about it in open access. Sharing it here on TradingView would’ve not done anything critical for em, but many would’ve benefited.
∞

Global M2 ex-China MonitorGlobal M2 Monitor - Ultimate Edition
🎯 OVERVIEW
Advanced global M2 money supply monitoring indicator, offering a unique macroeconomic view of global liquidity. Real-time tracking of M2 evolution in major developed economies.
📊 KEY FEATURES
Global M2 Aggregation : USA, Japan, Canada, Eurozone, United Kingdom
Currency Conversion : All data converted to USD for consistent analysis
High Resolution Display : Daily curve by default
Technical Analysis : 50-period moving average (SMA/EMA/WMA)
Accurate YoY Calculation : Annual variation based on monthly data
Advanced Signal System : Multi-condition color codes
🎨 COLOR SYSTEM - DEFAULT SETTINGS
🟢 GREEN : YoY ≥ 7% AND M2 ≥ SMA → Strong growth + Bullish momentum
🔴 RED : YoY ≤ 2% AND M2 ≤ SMA → Weak growth + Bearish momentum
🟢 LIGHT GREEN : YoY ≥ 7% BUT M2 < SMA → Good fundamentals, temporarily weak momentum
🔴 LIGHT RED : YoY ≤ 2% BUT M2 > SMA → Weak fundamentals, price still supported
🔵 BLUE : YoY between 2% and 7% → Neutral zone of moderate growth
🇨🇳 WHY IS CHINA EXCLUDED BY DEFAULT?
Chinese M2 data presents methodological reliability and transparency issues. Exclusion allows for more consistent analysis of mature market economies.
Different M2 definition vs Western standards
Capital controls affecting real convertibility
Frequent monetary manipulations by authorities
✅ Available option : Can be activated in settings
⚙️ OPTIMIZED DEFAULT PARAMETERS
// DISPLAY SETTINGS
Candle Period: D (Daily)
// MOVING AVERAGE
MA Period: 50, Type: SMA
// BACKGROUND LOGIC
YoY Bullish: 7%, YoY Bearish: 2%
SMA Method: absolute, Threshold: 0.2%
// COLORS
Transparency: 5%
China M2: Disabled
📈 RECOMMENDED USAGE
Traders : Anticipate sector rotations
Investors : Identify abundant/restricted liquidity phases
Macro-analysts : Monitor monetary policy impacts
Portfolio managers : Understand inflationary pressures
🔍 ADVANCED INTERPRETATION
M2 ↗️ + YoY ≥ 7% → Favorable risk-on environment
M2 ↘️ + YoY ≤ 2% → Defensive risk-off environment
Divergences → Early warning signals for trend changes
💡 WHY THIS INDICATOR?
Global money supply is the lifeblood of the financial economy . Its growth or contraction typically precedes market movements by 6 to 12 months.
"Don't fight the Fed... nor the world's central banks"
🛠️ ADVANCED CUSTOMIZATION
All parameters are customizable:
YoY bullish/bearish thresholds
SMA comparison method (absolute/percentage)
Colors and transparency
Moving average period and type
Optional China inclusion
📋 TECHNICAL INFORMATION
YoY Calculation : Based on monthly data for consistency
Sources : FRED, ECONOMICS, official data
Updates : Real-time with publications
Currencies : Updated exchange rates

Market Breadth Decision HelperMarket Breadth Decision Helper (NYSE/NASDAQ VOLD, ADD, TICK)
Combines NYSE VOLD, NASDAQ VOLD (VOLDQ), NYSE/NASDAQ ADD, and TICK into a single intraday dashboard for tactical bias and risk management.
Tiered pressure scale (sign shows direction, abs(tier) shows intensity): 0 = Neutral, 1 = Mild, 2 = Strong, 3 = Severe, 4 = Panic. On-chart legend makes this explicit.
Table view highlights value, tier, bull/bear point contributions, and notes (PANIC, OVERRIDE, DIVERGENCE). VOLD and ADD panic trigger “stand down”; VOLD ±2 triggers bull/bear overrides; NYSE vs NASDAQ ADD divergence triggers “scalp only.”
Bull/bear points: VOLD 2 pts, ADD NYSE 2 pts, ADD NASDAQ 1 pt, TICK 1 pt. ≥3 pts on a side lifts that side’s multiplier to 1.5. Bias flips Bullish/Bearish only if a side leads and has ≥2 pts; otherwise Neutral.
Breadth modes: PANIC_NO_TRADE → DIVERGENCE_SCALP_ONLY → VOLD_OVERRIDE_BULL/BEAR → NORMAL/NO_EDGE.
Intraday context: tracks current session day_high / day_low for the chart symbol.
JSON/Alert export (optional) sends raw values plus *_tier and *_tier_desc labels (NEUTRAL/MILD/STRONG/SEVERE/PANIC) with sign/magnitude hints, so agents/bots never have to guess what “1 vs 2 vs 3 vs 4” mean.
Customizable bands for VOLD/ADD/TICK, table styling, label placement, and dashboard bias input to align with higher-timeframe context.
Best use
Quick read on internal participation and pressure magnitude.
Guardrails: respect PANIC and overrides; treat divergence as “scalp only.”
Pair with your strategy entries; let breadth govern when to press, scale back, or stand down.
Symbols (defaults)
VOLD (NYSE volume diff), VOLDQ (NASDAQ volume diff), ADD (NYSE), ADDQ (NASDAQ), TICK (NYSE). Adjust in Inputs as needed.
Alerts
Panic, divergence, strong bullish/bearish breadth. Enable JSON export to feed algo/agent workflows.

Buyers in Control █ OVERVIEW
The "Buyers in Control" indicator identifies periods when buying pressure dominates the market by combining three key technical factors:
✓ Price Momentum - Price trading above exponential moving average
✓ Volume Confirmation - Current volume exceeding average (strong participation)
✓ RSI Strength - Momentum indicator confirming bullish bias
When all three conditions align, the indicator signals that buyers are in control of the market.
█ HOW IT WORKS
The indicator evaluates three independent conditions:
1. PRICE POSITION: Close > EMA(21)
→ Confirms price is in an uptrend
2. VOLUME SURGE: Volume > SMA(20) × 1.2
→ Validates that the move has genuine buying interest
3. MOMENTUM: RSI(14) > 50
→ Ensures bullish momentum is present
Only when ALL three conditions are true does the indicator confirm buyer control.
█ KEY FEATURES
• Real-time Dashboard - Shows status of each condition (✓/✗)
• Visual Alerts - Green background + labels when buyers take control
• EMA Reference Line - Visual trend indicator
• Customizable Parameters - Adjust sensitivity for any market/timeframe
• Built-in Alerts - Notification when control shifts to buyers
• Clean Code - Well-documented Pine Script v6
█ SETTINGS
Price Momentum:
- EMA Length (default: 21) - Shorter = faster signals, Longer = more conservative
Volume Confirmation:
- Volume Multiple (default: 1.2) - Higher = requires stronger volume
- Volume SMA Length (default: 20) - Lookback period for average volume
RSI Momentum:
- RSI Length (default: 14) - Standard RSI calculation period
- RSI Threshold (default: 50) - Minimum RSI for buyer control
Display:
- Toggle background, labels, EMA line, and customize colors
█ USE CASES
• Trend Confirmation - Validate bullish moves before entering long positions
• Filter Weak Rallies - Avoid low-volume pumps that often reverse
• Multi-Timeframe Analysis - Check buyer control across multiple charts
• Alert System - Get notified when market regime shifts to buyers
█ BEST PRACTICES
✓ Works best in trending markets (avoid choppy/ranging conditions)
✓ Combine with support/resistance for optimal entries
✓ Test different EMA lengths for your specific asset/timeframe
✓ Use alongside risk management rules (stop losses, position sizing)
✓ Consider the dashboard to see which conditions are missing
█ TIMEFRAMES
Suitable for all timeframes:
• Intraday: 1m-15m (use EMA 9 for faster signals)
• Swing: 1h-4h (default settings work well)
• Position: Daily-Weekly (use EMA 50 for conservative signals)
█ TECHNICAL NOTES
• Pine Script v6 - Latest version for optimal performance
• No repainting - All calculations based on closed bar data
• Lightweight - Minimal CPU usage
• Open Source - Full code available for review and modification
█ ALERT CONDITIONS
1. "Buyers Take Control" - Fires when all three conditions become true
2. "Buyers Lose Control" - Fires when any condition breaks
█ LIMITATIONS
⚠ Not a standalone trading system - use as a confluence tool
⚠ May generate false signals in sideways/choppy markets
⚠ Volume data unavailable on some forex pairs (use tick volume)
⚠ Lagging by nature - confirmatory indicator, not predictive
█ CREDITS
Indicator combines classic technical analysis principles:
• EMA for trend direction
• Volume analysis for validation
• RSI for momentum confirmation
No proprietary algorithms - transparent, time-tested methods.

Daily Candle by NatantiaIntroduction to the Daily Candle Indicator
The Daily Candle Indicator is a powerful and customizable tool designed for traders to visualize daily price action on any chart timeframe.
This Pine Script (version 5) indicator, built for platforms like TradingView, overlays a single candle representing the day's open, high, low, and close prices, with options to adjust its appearance and session focus.
Key Features:
Customizable Appearance: Users can set the colors for bullish (default green) and bearish (default white) candles, as well as the wick color (default white). The horizontal offset and candle thickness can also be adjusted to fit the chart layout.
Dynamic Updates: The candle updates on the last bar, with wicks drawn to reflect the daily high and low, providing a clear snapshot of the day's price movement.
This is the same version as before, but we had to republish it because the chart contained other indicators, which violated the publication rules. We apologize for the inconvenience.
Have a nice trades!
-Natantia

[ArchLabs] Support & Resitance Levels Support & Resistance Levels — SR-v1.100
Smart, auto-managed zones for clean market structure
⸻
🔍 What this indicator does
This script automatically finds and maintains high-quality support & resistance zones on your chart, so you don’t have to keep redrawing levels by hand.
It:
• Detects major swing highs and lows (pivots)
• Builds support and resistance zones (not just thin lines)
• Filters out overlapping / redundant levels
• Tracks how price interacts with those zones in real time
• Marks and alerts:
• ✅ Breakouts
• 🚨 False breakouts
• 🔁 Retests
• Flips broken support → resistance and resistance → support automatically
You get a clean structural map of the market, continuously updated.
⸻
🧠 How levels are built (conceptually)
1. The indicator looks back over a configurable window and finds significant highs and lows (pivots).
2. From each confirmed pivot, it creates:
• A core level price (horizontal line)
• A price area around it (shaded zone), sized relative to recent price range/volatility
3. It then checks for overlaps between existing levels and new candidates:
• If a new level is too close to an existing one (within your overlap threshold), it gets discarded.
• This keeps only the most meaningful, non-redundant levels on the chart.
4. A cap of around 10 levels per side (support / resistance) keeps the view readable.
The result: a curated set of zones that actually matter, not a wall of lines.
⸻
🎨 Visuals on the chart
You’ll see:
• Support zones
• Line: bullish color (default green)
• Area: semi-transparent band below/around the line
• Resistance zones
• Line: bearish color (default red)
• Area: semi-transparent band above/around the line
Colors are customizable for:
• Level line
• Zone area
• Breakout highlight
• Retest label
This makes it easy to visually separate support vs resistance and quickly spot key reactions.
⸻
⚡ Dynamic behavior & level lifecycle
Each level goes through a natural “life cycle,” which the indicator tracks for you:
1. Active zone
• The level is valid and extended to the right as long as price stays “engaged” with it (using smoothed highs/lows to avoid noise).
2. Extension / pause
• When price pulls away from the level far enough, the extension can temporarily stop so the level doesn’t stretch indefinitely without interaction.
• If price comes back into the zone with meaningful action, the level can resume extension.
3. Break & role reversal
• When price cleanly breaks the level (based on smoothed price, not just a wick), the zone is:
• Stopped and locked in place
• Marked as broken
• Immediately cloned and flipped:
• Broken support becomes a new resistance zone at the same area.
• Broken resistance becomes a new support zone.
This gives you automatic role-reversal levels without manually redrawing anything.
⸻
🧷 Event tags & alerts
The indicator tracks three key interactions with each zone:
1. Breakouts (optional)
When price decisively breaks a level:
• A small breakout label appears on/near the level:
• Support broken → bearish breakout style
• Resistance broken → bullish breakout style
• An alert message is fired (if alerts are enabled on the script)
Use this to catch true structural breaks that may signal trend continuation or regime change.
⸻
2. False breakouts (optional)
False breakouts are marked when price:
• Wicks through a level, but
• Fails to close beyond it and quickly returns inside the zone
When detected:
• A 🚨 FB label appears at the level
• The label tracks with price while the false breakout is active
• An alert can fire each time this behavior is confirmed
This is very useful for reversal traders and anyone fading failed breakouts.
⸻
3. Retests (optional)
Retests are detected when:
• Price re-enters a zone after previously moving away from it
• The candle comes back into the area for the first time in this new approach
The script:
• Marks the retest with a “T” label in a distinct color for support vs resistance
• Brings that level to the top of the internal priority list, keeping fresh retests visually and logically “hot”
Traders often use these as high-probability reaction points (e.g., breakout → retest → continuation).
⸻
⚙️ Key settings
All inputs are grouped for clarity:
Support / Resistance Levels
• Pivots Lookback
Controls how far back the indicator looks for swing highs/lows.
• Higher value → fewer, stronger levels
• Lower value → more reactive, more levels
• Overlap Multiplier (Pips)
Sets how aggressively overlapping levels are merged/ignored.
• Higher value → fewer levels, more consolidation
• Lower value → more granular levels
• Auto Overlap
When enabled, the script automatically adjusts the overlap threshold based on timeframe:
• Intraday lower timeframes → tighter filtering
• Higher/intra-session → more appropriate scaling
This lets you drop the indicator on multiple timeframes without constantly retuning.
⸻
Level Event Toggles
• Breakout Labels & Alerts (on/off)
• False Breakout Labels & Alerts (on/off)
• Retest Labels & Alerts (on/off)
Turn on only what fits your style.
Scalpers might want all three; swing traders may prefer only breakouts + retests.
⸻
Support / Resistance Colors
Separate color groups for:
• Line & area of support levels
• Line & area of resistance levels
• Visual styling for breakouts
• Visual styling for retests
You can match your existing chart theme or build a dedicated SR layout.
⸻
📈 How to use it in your trading
Here are a few practical ways to integrate this indicator:
• Context map
Use it as a structural overlay on any symbol/timeframe to see where price is likely to react.
• Breakout + retest setups
• Wait for a level to break with a breakout label.
• Then watch for a T (retest) label into the flipped zone.
• Combine with your own confirmation (price action, volume, oscillators, etc.).
• Mean-reversion & fade trades
• Hunt for false breakout (FB) labels on key levels.
• These are often good spots to fade aggressive moves that lose momentum.
• Confluence builder
• Combine zones with trend tools, VR/DC, moving averages, or higher timeframe structure.
• A breakout/retest at a level that also lines up with higher TF structure can be especially meaningful.
⸻
✅ Summary
Support & Resistance Levels (SR-v1.100) is designed to be:
• Clean – no cluttered spaghetti of lines
• Adaptive – zones evolve with the market and flip roles automatically
• Actionable – breakout, false breakout, and retest events are clearly marked and alert-ready
• Flexible – works on any market and timeframe with simple, intuitive inputs
Drop it on your chart, tune the lookback & overlap to your style, and let it handle the heavy lifting of structural mapping while you focus on decisions.

Swing Point PnL PressureThis indicator visualizes the cumulative profit potential of bulls and bears based on recent swing highs and lows — offering a unique lens into trend maturity, sentiment imbalance, and exhaustion risk.
🟢 Bull PnL rises as price moves above prior swing lows — reflecting unrealized gains for long positions
🔴 Bear PnL rises as price drops below prior swing highs — capturing short-side profitability
Over time, these curves diverge during strong trends, revealing which side is in control. But when they converge, it often signals that the dominant side is losing steam — a potential turning point where profit-taking, traps, or reversals may emerge.
This tool doesn’t predict tops or bottoms — it tracks the emotional and financial pressure building on each side of the market. Use it to:
Spot trend exhaustion before price confirms it
Identify profit parity zones where sentiment may flip
Time accumulation or distribution phases with greater confidence
Whether you’re swing trading or analyzing macro structure, this indicator helps you see what price alone can’t: who’s winning, who’s trapped, and who’s about to give up.

ATRP & Volatility Table - AIMAN93The ATRP & Volatility Table is a simple yet powerful tool designed to quantify market volatility and help traders adapt their position sizing accordingly.
It calculates the Average True Range Percentage (ATRP) — the ATR value relative to current price — and classifies market conditions into three volatility levels: LOW, MEDIUM, or HIGH. Based on the volatility level, it suggests an indicative risk percentage to guide your trade management.
This visual tool displays real-time ATRP, volatility classification, and corresponding risk percentage in a compact on-chart table. Ideal for systematic traders who rely on volatility-based decision-making, position sizing, or risk management models.
Features:
- Dynamic ATRP calculation for any symbol or timeframe
- Customizable colors for text and background
- Automatic volatility classification (low / medium / high)
- Suggested risk percentage for each volatility level

Session Volume Profile - Open Source (DeadCat) Decided to make this Open Source so everyone can make edits.
Volume Profile is a charting study that displays trading activity over specific time periods at various price levels. It appears as a horizontal histogram on the chart, revealing where traders have shown the most interest based on volume concentration.
This Volume Profile automatically anchors to user-selected timeframes, creating fresh volume analysis for each new period while maintaining clean, systematic visualization of price-volume relationships.
Core Components:
Point of Control (POC): The price level with the highest volume activity during the selected period, marked with a yellow line and left-side label.
Value Area High/Low (VAH/VAL): Price boundaries that contain a specified percentage of the total volume (default 40%), helping identify the main trading range where most activity occurred.
Volume Histogram: Left-aligned bars showing volume distribution across price levels, with value area highlighting for enhanced visual clarity.
Key Features:
- Automatic Period Detection: Supports hourly, daily, weekly, and monthly timeframe anchoring
- Customizable Granularity: Adjustable rows (10-500) for different price resolution needs
- Labels: Clear POC, VAH, and VAL identification positioned at profile start
- Toggle Controls**: Optional display for volume rows, key levels, and background fills
- Clean Visualization: Profiles reset automatically at each new period for current market focus
Display Options:
- Profile Rows: Show/hide the volume histogram bars
- Key Level Lines: Individual controls for POC, VAH, and VAL display
- Value Area Background: Optional shading between VAH and VAL levels
- Color Customization: Separate color controls for all visual elements
The indicator provides systematic volume analysis by creating fresh profiles at regular intervals, helping traders identify significant price levels and volume patterns within their preferred timeframe structure.
Disclaimer: This indicator is for educational and informational purposes only. Trading decisions should be based on comprehensive analysis and proper risk management. Past performance does not guarantee future results.

Etherium CME gaps multi-timeframe auto finderThis indicator is a powerful tool that automatically detects and visualizes price gaps (Gaps) in the Ethereum CME futures market across multiple timeframes and also provides alert functionality. Price gaps occur when the futures market is inactive for a certain period, often acting as potential support or resistance zones.
What is an Ethereum CME Gap?
CME (Chicago Mercantile Exchange) is one of the largest derivatives exchanges globally. The Ethereum CME futures market is closed on weekends and certain holidays. When the market reopens, a price difference may occur between the previous closing price and the new opening price, referred to as a "CME Gap."
Key Features of the Indicator
Multi-timeframe gap detection: Detects and displays gaps across 5m, 15m, 30m, 1h, 4h, 1d timeframes simultaneously.
Customizable CME Symbol: You can specify Ethereum CME futures symbols, such as ETH1!.
Two gap price display methods:
CME_price: Displays the gap based on the actual price levels in the CME futures market.
Chart_price: Adjusts the gap to match the price levels on the chart being viewed (e.g., spot market). This helps visualize the impact of futures gaps on the spot market.
Visual customization:
Individual color settings for bullish/bearish gap boxes for each timeframe.
Adjust the extension (display length) of gap boxes in bars.
Configure label display, position, text size, background, and text color.
Highlight significant gaps: Emphasize gaps above a specified percentage with a unique color and border thickness.
Alert functionality: Receive notifications when a gap is detected, with options to enable alerts only for specific timeframes.
Why CME Gaps Matter
Traders often consider CME gaps as significant price zones.
Gap Fill: Historical data shows that many gaps tend to get "filled" over time, meaning the price returns to the gap area, reaching the start or end point of the gap.
Support/Resistance: Unfilled gaps can serve as potential support (Bullish Gap) or resistance (Bearish Gap) zones.
Bullish Gap: Occurs when the current opening price is higher than the previous closing price. Typically leaves an unfilled gap below (previous high), which can act as potential support.
Bearish Gap: Occurs when the current opening price is lower than the previous closing price. Typically leaves an unfilled gap above (previous low), which can act as potential resistance.
How to Use the Indicator
Add Indicator on TradingView: Click the "Indicators" button on the TradingView chart.
Find the indicator in "My Scripts" or "Invite-Only Scripts" and add it to the chart.
Adjust Settings: Once the indicator is added, click the settings (gear) icon to adjust inputs.
CME Symbol (ETH): ETH1! is typically the default symbol for Ethereum CME futures. Confirm based on your broker or data feed.
Min gap %: Set the minimum gap size in percentage; smaller gaps will not be displayed.
Select Exchanges to Display gap price: Choose between "CME_price" or "Chart_price." For viewing futures gaps on a spot chart, "Chart_price" is recommended.
Show Xm/h/d gap boxes: Select which timeframe gap boxes to display.
Color, Extension, Label settings: Customize the visual aspects of gap boxes and labels.
Highlight gap % (>=): Set the minimum percentage for highlighting significant gaps.
Enable Alerts: Choose whether to receive alerts when a gap is detected.
Alert Timeframe: Select whether alerts apply to all timeframes or specific ones only.
Chart Analysis
Once the indicator is applied, gap boxes for the selected timeframes appear on the chart.
Green shades indicate Bullish Gaps, and red shades indicate Bearish Gaps (default green can be customized, and bearish gap color can be set separately).
Highlighted gaps may carry higher significance and should be monitored carefully.
Potential trading opportunities can be explored when the price approaches or attempts to fill a gap.
Usage Strategies (Examples)
Support/Resistance Confirmation: The lower boundary of a bullish gap can act as potential support, while the upper boundary of a bearish gap can act as potential resistance. Observe for reversals or breakouts when price reaches these areas.
Retracement Trading: Trade when the price returns to fill a gap after leaving it through a sharp move up or down.
Multi-timeframe Analysis: Gaps overlapping across multiple timeframes can form stronger support/resistance zones.
Considerations
* "Gap Filled" Condition: The indicator does not draw a gap if it determines that the gap has already been filled by the current bar’s low (bullish gap) or high (bearish gap).
* Tool Only: This indicator is a gap detection tool and should not be used alone for trading decisions. Always combine with other technical analysis tools and your trading strategy.
* Past Data ≠ Future Guarantee: Historical gap fill trends do not guarantee future occurrences.
This indicator allows effective tracking of Ethereum CME futures gaps and provides valuable insights for enhancing your trading strategy.

Elder Force Index Alexander Elder's volume indicator. Stay in long as long as the background is green and there are no green crosses. The same applies for short.

VWAP TrendSignalVWAP TrendSignal
VWAP (Volume-Weighted Average Price) is the market’s true fair value — the benchmark institutions use to see when price is balanced, extended, or trending with real intent.
Price often snaps back when it moves too far (mean reversion), and only shows genuine strength when it holds above or below VWAP.
VWAP TrendSignal makes this insight effortless by color-coding VWAP direction:
Yellow = VWAP rising → bullish pressure
Red = VWAP falling → bearish pressure
No bands. No noise. Just pure directional clarity.
Anchor VWAP to the Session, Week, Month, Quarter, or Year, and tailor the Slope Smoothing Filter to your timeframe:
1–2 smoothing → fast & reactive (1–5m scalping)
3–5 smoothing → clean & stable (5–15m intraday)
6–10 smoothing → slow flips (1H–4H swings)
10–15 smoothing → macro bias only (Daily/Weekly)
The line adapts to how you trade.
How to Use It
Mean Reversion
When price stretches far from VWAP, expect pullbacks or snapbacks.
Trend Direction
Yellow supports long bias, red supports short bias.
Simple, reliable, instantly visible.
Balance Zones
Price sitting near VWAP = compression, buildup, or chop.
A perfect signal to wait or prepare for a breakout.
Why It Works
VWAP TrendSignal distills institutional logic into a clean, single-line tool.
It shows fair value, trend slope, and balance all at once — making your chart clearer and your decisions faster.
Once you get used to reading it, trading without it feels blind.

Candle 2 Closure📌 Indicator Presentation – Candle 2 Closure
" Candle 2 Closure "s is an indicator designed to identify three types of price–action-based signals in real time: Long, Short, and Generic.
The goal is to visually highlight moments when the market breaks a key level of the previous candle but rejects that break, closing on the opposite side.
The idea was inspired by the study of pure price action and specifically by the following video:
👉 www.youtube.com
🎯 How the Indicator Works
The indicator generates signals on bar close (barstate.isconfirmed), making them reliable and free from repainting.
🔵 LONG Signal
A long signal is triggered when:
The current candle breaks the low of the previous candle
But then closes back above that low
→ This is often a sign of a bear trap or a liquidity rejection to the downside.
🔴 SHORT Signal
A short signal is triggered when:
The current candle breaks the high of the previous candle
But then closes back below that high
→ This may indicate a bull trap or a liquidity rejection to the upside.
⚪ GENERIC Signal
A generic signal is triggered when:
A high or low is broken,
But neither the long nor short conditions are met,
Resulting in a simple unconfirmed break.
📍 Operational Advantages
Highlights liquidity absorption zones
Works on all timeframes (1m → 1D)
Useful for scalping, intraday, or swing trading
Clear and immediate visual signals on the chart
Zero repainting
✨ Visual Style
LONG displayed below the candle, white color
SHORT displayed above the candle, white color
Generic signal shown with a neutral label

🔰BGL Algo Break out and Trend Indicator publicdesigned for public use no charges identifying chart trends

7/21 EMA ADX Pro After many months (actually years) of intense research, countless hours of testing different approaches, and rigorous backtesting, I’ve finally developed this indicator/strategy based on moving average crossovers enhanced with power-based filtering to significantly reduce false signals and whipsaws. This is not just another basic MA crossover system. The core idea revolves around applying mathematical powers (exponents) to the moving averages and combining them with additional confirmation filters, creating a much more robust and reliable signal generation mechanism. I’m sharing it with the community in the hope that it can be useful to someone else who, like me, has spent endless nights trying to find an edge in the markets. Feel free to test it, modify it, or improve it. Feedback, suggestions, and constructive criticism are always welcome. If you find it helpful, a simple like or comment would mean a lot — it’s the result of a huge amount of work and passion. Happy trading! (Full Pine Script code will be posted below or in the next update — stay tuned!

Directional Candle Size TrackerThis indicator measures the strength of bullish and bearish momentum by tracking the average size of candles — but only when they’re moving in the intended direction.
🟢 Bullish Strength rises when green candles expand in size
🔴 Bearish Strength rises when red candles grow in size
When the market pauses or flips direction, the opposing line flatlines, preserving the last value
Unlike traditional moving averages that blend all candles together, this tracker isolates directional pressure, giving you a clearer read on which side is truly in control. It’s especially useful for spotting momentum decay, trap setups, and regime transitions.
Use it to:
Confirm breakout strength
Detect fading conviction
Compare bullish vs. bearish aggression in real time

Keltner Channels BandsKeltner Channels Bands - パブリッシュ用説明文
日本語版
タイトル
Keltner Channels Bands (Multi-Timeframe)
説明文
概要
シンプルで視認性の高いケルトナーチャネルインジケーターです。マルチタイムフレーム機能を搭載し、どの時間足でも上位足のケルトナーチャネルを表示できます。
特徴
グレーカラーでチャートを見やすく保持
マルチタイムフレーム対応(デフォルト: 1時間足)
4時間足以上で自動非表示機能(チャートの見やすさを維持)
EMAまたはSMAの選択が可能
ATR倍率とバンド幅を自由にカスタマイズ
トレードコンセプト
ケルトナーチャネルは、価格のボラティリティに基づいたトレンド追従型インジケーターです。
基本的な使い方:
トレンド判定: 価格がバンドの上部で推移している場合は上昇トレンド、下部で推移している場合は下降トレンド
エントリー: 価格がバンド外に出た後、バンド内に戻るタイミングでトレンド方向へエントリー
エグジット: 価格が中心線(MA)に到達、または反対側のバンドに接近した時
ブレイクアウト: バンドを勢いよく突破した場合、新たなトレンドの始まりを示唆
推奨設定:
スイングトレード: Length 20, Multiplier 2.2, 1時間足または4時間足
デイトレード: Length 20, Multiplier 2.0, 5分足または15分足で1時間足を表示
注意事項
このインジケーターは単独での使用ではなく、他のテクニカル指標やプライスアクションと組み合わせて使用することを推奨します。
English Version
Title
Keltner Channels Bands (Multi-Timeframe)
Description
Overview
A simple and visually clean Keltner Channels indicator with multi-timeframe capabilities. Display higher timeframe Keltner Channels on any chart timeframe.
Features
Clean gray color scheme for better chart visibility
Multi-timeframe support (Default: 1-hour)
Auto-hide on 4H+ timeframes to maintain chart clarity
Choice between EMA or SMA
Customizable ATR multiplier and band width
Trading Concept
Keltner Channels is a volatility-based trend-following indicator that helps traders identify trend direction and potential entry/exit points.
Basic Usage:
Trend Identification: Price staying near upper band indicates uptrend; near lower band indicates downtrend
Entry Signals: Enter in trend direction when price returns inside the bands after moving outside
Exit Signals: Consider exits when price reaches the center line (MA) or approaches the opposite band
Breakout Trading: Strong momentum breaks through the bands may signal the start of a new trend
Recommended Settings:
Swing Trading: Length 20, Multiplier 2.2, 1H or 4H timeframe
Day Trading: Length 20, Multiplier 2.0, Display 1H channels on 5M or 15M charts
Disclaimer
This indicator should not be used alone. Combine it with other technical indicators and price action analysis for better trading decisions.

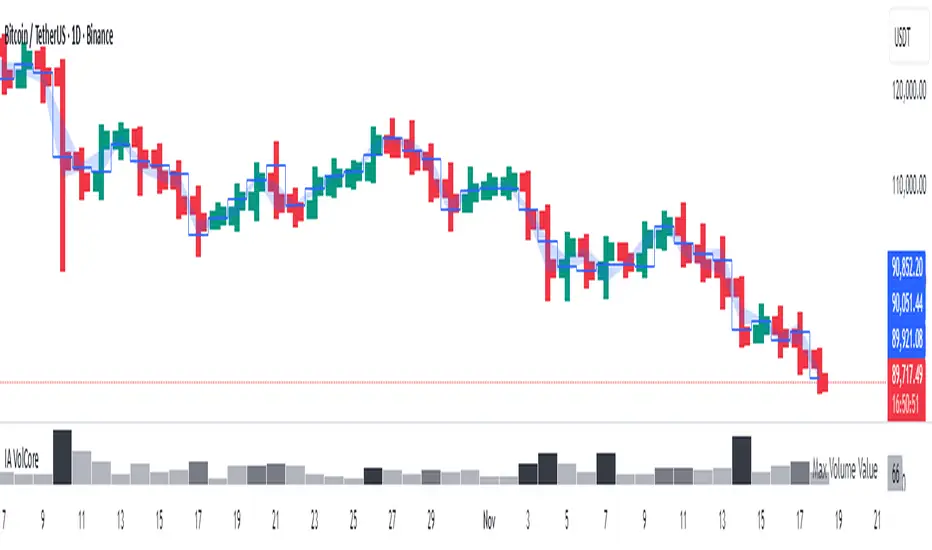
Candle Volume CoreIA VolCore — Candle Volume Core
Indicator Overview
IA VolCore is an intra‑candle volume analysis tool that shows where the core traded volume is concentrated inside each candle.
It visualizes how buyers and sellers interacted within the bar and highlights key levels and zones where the highest activity takes place.
How Calculations Work
The indicator uses the lowest available timeframe data to calculate volume distribution inside each candle.
If you have a Premium or higher subscription, VolCore uses second‑based data for the most accurate results. Older candles (where second‑data is no longer available due to platform limits) are calculated using minute data. The indicator can therefore be used on any timeframe from 1 minute and higher.
If you do not have Premium, the indicator uses minute‑based data only, so it is recommended to use it from the daily timeframe and above.
Example of Calculation
If the chart timeframe is 1 hour and the lowest available timeframe is 1‑second data, the indicator loads 3600 1‑second candles. Each 1‑second candle has a known volume, which is evenly distributed across its own price range.
The 1‑hour candle is then divided into a number of price ranges based on the Candle Volume Resolution parameter. The volumes of all 3600 1-second candles are then aggregated into the corresponding price ranges of the hourly candle.
The final result is a detailed intra‑candle volume map for the entire hour — calculated using the most precise data available.
Custom Timeframe Parameter
If Use Custom Timeframe is enabled and a timeframe is selected, all calculations will be performed strictly using this specified timeframe.
For example: if the chart is on 1D, the user has 1‑second data available, but Custom TF is set to 1 minute, then the volume distribution inside each daily candle will be calculated using 1‑minute candles.
Key Features
Candle Volume Resolution — defines how many price ranges each candle is divided into (3–50,000). All calculations in the indicator are based on this resolution.
Max Volume Level — displays the price level inside the candle where the maximum volume occurred.
% of Volume (1, 2, 3) — defines percentages of the candle's total volume (e.g., 33%, 66%, 50%). For each percentage, VolCore finds the minimum price range containing that share of volume. You can view the corresponding volume values for these shares in histogram form via the Show: Vol % 1–3 parameters. The actual intra-candle zones are displayed using the Show area option.
Volume % for Density — sets the volume percentage used to calculate Vol Density, which reflects how concentrated the volume is inside the selected price range.
Display Parameters (Show)
Show: Vol % 1–3 — shows histograms of volume share zones based on the selected "% of Volume" parameters (with color logic applied).
Show: Max Volume Value — displays the maximum internal volume value for each candle as a histogram (with color logic applied).
Show: Volume — displays the candle's total volume (with color logic applied).
Show: Vol Density — shows the density of volume distribution inside the candle for the selected volume percentage (with color logic applied).
Example Use Cases (not a complete list)
IA VolCore shows where liquidity forms inside each candle, how volume is distributed, and how concentrated trading activity is.
Detecting False Breakouts
If a breakout candle shows increased volume, and after the breakout the core volume forms beyond the level, but the price moves back — VolCore provides a strong signal of a false breakout.
Examples:
Identifying Support & Resistance Zones
If Max Volume Level repeatedly forms in the same internal range over multiple candles, this indicates a hidden support or resistance level.
Example:
Who This Indicator Is For
For traders using volume‑based and contextual market analysis, and for IA (Initiative Analysis) ecosystem users who want a deeper understanding of intra‑candle structure.
Histogram Color Logic
IA VolCore uses three color shades to highlight volume behavior relative to previous candles:
light shade — normal volume, no significant change,
medium shade — volume exceeds both previous candles,
dark shade — volume exceeds the sum of the previous two candles.
This helps quickly spot growing activity and potential shifts in market pressure.
Style Settings
Line styles, histogram styles, and colors can be customized in the indicator’s Style tab.
vertical marker (latest)//@version=6
indicator("Latest Vertical Line Infinite", overlay=true, scale=scale.none)
// Session input
sess1 = input.float(9.0, "Session Time", minval=0.0, maxval=23.59)
// Color + opacity input
lineColor = input.color(color.new(color.black, 0), "Line Color")
// Fractional minutes
min1 = sess1 - math.floor(sess1)
// Trigger condition
cond1 = (hour == math.floor(sess1)) and (minute == int(min1 * 100))
// Store latest line
var line latestLine = na
// Create new infinite vertical line at the latest session
if cond1
if not na(latestLine)
line.delete(latestLine)
latestLine := line.new(x1=bar_index, y1=0, x2=bar_index, y2=1, xloc=xloc.bar_index, extend=extend.both, color=lineColor, width=1)
