RSI + Psy + ADXRSI + Psychological Line + ADX (with RCI-replacement logic)
This custom TradingView indicator combines three major technical analysis tools—RSI, Psychological Line (Psy), and ADX—to help traders identify trend strength, market momentum, and overbought/oversold conditions with improved clarity.
1. Multi-Period RSI
The indicator calculates three RSI values:
Short-term RSI (9)
Mid-term RSI (26)
Long-term RSI (52)
These help users observe short-, mid-, and long-term momentum simultaneously.
Threshold lines are drawn at 70, 50, and 30 for standard RSI overbought/oversold analysis.
2. Psychological Line (Psy) with Dynamic Column Display
The Psy indicator counts how many closes within the selected period (default: 12) were higher than the previous close.
Values above 75 indicate overbought markets.
Values below 25 indicate oversold markets.
When Psy crosses these thresholds, it is displayed as a column chart centered at 50, visually expanding upward (overbought) or downward (oversold).
3. ADX Trend Strength with Color Coding
ADX is calculated from DI+ and DI− values (using true range and directional movement).
The ADX line changes color based on trend strength:
Blue: Weak trend (below 20)
Yellow: Moderate trend (20–30)
Red: Strong trend (above 30)
This helps traders easily recognize when the market transitions from low-volatility to strong-trend conditions.
Indicators and strategies


NIFTY, SENSEX AND BANKNIFTY Options Expiry MarkerNSE Options Expiry Background Marker
Category: Date/Time Indicators
Timeframe: Daily
Markets: NSE (India) / Any Exchange
Description
Automatically highlights weekly and monthly options expiry days for NIFTY, BANKNIFTY, and SENSEX using color-coded background shading. Works across entire chart history with customizable transparency levels.
Key Features
✅ Background Highlighting - Non-intrusive color shading on expiry days
✅ Multi-Index Support - NIFTY, BANKNIFTY, and SENSEX simultaneously
✅ Weekly & Monthly Expiry - Different transparency levels for easy distinction
✅ Customizable Expiry Days - Set any weekday (Mon-Fri) as expiry day
✅ Adjustable Transparency - Separate controls for weekly and monthly expiries
✅ Full Historical Data - Works on all visible bars across years
✅ Smart Monthly Detection - Automatically identifies last occurrence in month
✅ Color Coded - Blue (NIFTY), Red (BANKNIFTY), Green (SENSEX)
Use Cases
Options trading strategy planning
Identify expiry day volatility patterns
Visual reference for monthly vs weekly cycles
Backtest strategies around expiry days
Track multiple index expiries on single chart
Technical Details
Uses India timezone (GMT+5:30) for accurate date calculations
Handles leap years automatically
Smart algorithm identifies last weekday occurrence per month
Works seamlessly on any chart timeframe (optimized for Daily)
No performance impact - simple background coloring

Adaptive MACD PROAdaptive MACD PRO
Highlights structural momentum changes using dynamic normalization of MACD and Signal.
Phase Momentum Core
Adds directional confirmation based on short-term phase behavior.
Visual Output
• MACD & Signal lines with trend-based coloring
• Adaptive histogram reflecting momentum strength
• Fixed-position Buy/Sell dots at predefined levels
• AutoCalib dots on MACD_z threshold crossings
• Optional HUD panel displaying calibration levels and MACD_z
Features
• Selectable MA types (EMA, SMA, KAMA)
• Z-score normalization
• ATR-based volatility weighting
• Higher timeframe alignment
• Auto-calibration with SAFE / AGGRESSIVE modes
• Unified long/short triggers
• Full bar-coloring control
• Works on all assets and timeframes
The full source code is visible and may be modified or extended.
This script is intended for technical analysis and research only.
This indicator is published as a free, open-source script with full visible code.

Regime Turbo System This indicator is a “Regime Turbo System” that classifies the market into trend and volatility regimes across multiple timeframes. It combines multi‑timeframe trend detection, volatility filters, and an information panel to show the current market state clearly.
Trend regime: The script checks 60m, 30m, 15m, and 5m timeframes using both EMA200 and a Supertrend‑style filter. When all four timeframes agree up, it labels the environment as “UP”; when they all agree down, it labels “DOWN”; anything else is “MIXED”.
Volatility regime: It computes ATR percentile to label volatility as HIGH / NORMAL / LOW, and uses Bollinger Band width to detect “squeeze” (low‑volatility contraction). An “energy” measure based on recent price change identifies whether volatility is expanding or fading.
Regime zone: Combining trend and volatility, it classifies each bar into Long Zone, Short Zone, or Neutral. Long Zone requires aligned uptrend plus strong and rising volatility; Short Zone requires aligned downtrend plus strong but weakening volatility. Colored dots at the top of the pane mark these zones.
Info panel: A small table in the top‑right summarizes key states in real time: multi‑timeframe trend, volatility label, BB squeeze status, and expansion/fade of energy.
Plots: The lower part of the pane shows an ATR percentile histogram and the energy line so you can visually see changes in volatility and regime strength over time.
In short, you use this indicator to decide:
whether the market is in a strong bullish, strong bearish, or neutral regime,
whether volatility is high or low, compressing or expanding,
and then choose trend‑following or mean‑reversion tactics accordingly.

Multi MAThis TradingView indicator displays four customizable moving averages on your price chart: two Exponential Moving Averages (EMAs) and two Simple Moving Averages (SMAs).
The default settings show a 10-period EMA (aqua), 21-period EMA (orange), 50-period SMA (green), and 200-period SMA (red), which are commonly used timeframes for trend analysis.
Each moving average can be individually toggled on or off, and their lengths and colors are fully adjustable through the indicator settings.
The EMAs react more quickly to price changes while the SMAs provide smoother, more gradual trend indicators, making this useful for identifying support/resistance levels and trend direction.
Traders often watch for crossovers between these moving averages as potential entry or exit signals, with the 50/200 SMA cross being particularly significant as the "golden cross" or "death cross."

Delta Force Index - DFI [TCMaster]This indicator provides a proxy measurement of hidden buying and selling pressure inside each candle by combining tick volume with candle direction. It calculates a simulated delta volume (buy vs. sell imbalance), applies customizable scaling factors, and displays three components:
Delta Columns (green/red): Show estimated hidden buy or sell pressure per candle.
Delta Moving Average (orange line): Smooths delta values to highlight underlying momentum.
Cumulative Delta (blue line): Tracks the long-term accumulation of hidden order flow.
How to use:
Rising green columns with a positive Delta MA and upward Cumulative Delta suggest strong hidden buying pressure.
Falling red columns with a negative Delta MA and downward Cumulative Delta suggest strong hidden selling pressure.
Scaling parameters allow you to adjust the visual balance between columns and lines for different timeframes.
Note: This tool uses tick volume and candle direction as a proxy for order flow. It does not display actual bid/ask data or Level II market depth. For professional order flow analysis, footprint charts or DOM data are required.

VWAP POC Volume ConfirmationVWAP POC Volume Confirmation
Advanced volume-based trading indicator that combines VWAP, Point of Control, and volume analysis for precise entry signals. Features:
• VWAP Trend Filter - Confirms market direction
• POC Levels - Identifies key price control points
• Volume Confirmation - Validates moves with high volume
• Multi-Timeframe - Adapts to any chart timeframe
• Smart Signals - Strong/Medium entry alerts with visual arrows
Perfect for day traders seeking volume-confirmed entries with clear VWAP and POC alignment. Includes real-time info table and customizable alerts.
#VWAP #VolumeProfile #POC #TradingStrategy #VolumeAnalysis

Thirdeyechart Gold Simulation Final 3The Thirdeyechart Gold Simulation Final Version 3 is the ultimate indicator for traders who want a comprehensive, real-time view of gold market dynamics across multiple XAU pairs. This version tracks 8 gold-related pairs simultaneously (XAUUSD, XAUJPY, XAUGBP, XAUEUR, XAUAUD, XAUCHF, XAUCAD, XAUNZD) and provides a consolidated visual table for weekly, daily, 4-hour, and 1-hour percentage changes.
Core Features
Multi-Timeframe Trend Analysis – Calculates percent change for each XAU pair across W, D, H4, H1 using:
pct_tf = ((close_tf - open_tf) / open_tf) * 100
Positive values are colored blue, negative values red, giving an immediate visual sense of market direction.
Buy & Sell Simulation – Each pair’s positive and negative contributions are summed to produce BuySim and SellSim columns, representing the overall pressure in the market without providing explicit trade signals.
Total Row & Strength Row – Aggregates all pairs to show total weekly, daily, H4, and H1 movements, alongside a Strength row indicating "Strong", "Weak", or "Neutral" trends per timeframe. A trend bias (Buy Bias or Sell Bias) is calculated automatically from total positive vs negative pressure.
Safe / Unsafe Trade Detection – Advanced logic measures the difference between total Buy and Sell pressure. If the distance exceeds 50% of total market activity, the market is labeled as Safe Trade with a reason for dominance (buyers or sellers). If below this threshold, it is labeled Unsafe Trade with a note that one side “can dominate the market.” This allows traders to quickly identify high-confidence vs uncertain market conditions.
Visual Layout – The table is fully boxed, color-coded, and easy to read, displaying all key metrics including per-timeframe percent changes, BuySim/SellSim totals, Strength, Trend Bias, and Trade Status with reasons.
Logic Overview
Percent changes per timeframe: pct_tf = ((close - open) / open) * 100
Positive and negative values split into Buy/Sell contributions.
Sum across all pairs and timeframes to calculate totals and bias.
Safe/Unsafe trade threshold: distance >= totalAll * 0.50
Strength interpretation per timeframe: >0 → Strong, <0 → Weak, 0 → Neutral
This indicator is ideal for fast detection of strong vs weak gold trends, global XAU market pressure simulation, and quick risk assessment through safe/unsafe trade labeling.
Disclaimer
This tool is educational and analytical only. It does not provide financial advice or trade signals. Users are responsible for their own trading decisions, and trading involves risk.
© 2025 Thirdeyechart. All rights reserved. Redistribution or commercial use without permission is prohibited.


Top-Down 8 Levels + Wick Alerts + H4 Box (Stable)Top-Down Analysis Box
This Indicator Helps You Do
Perform top-down analysis quickly
Identify HTF liquidity levels instantly
Spot wick taps (liquidity grabs) in real-time
Trade key institutional levels with confidence
Use H4 zones for direction and bias
Set alerts for high-probability reaction levels

A.P.E V1
This script is a 2-candle reversal signal indicator that tries to catch sharp turns after an extreme high/low, with an optional ATR (volatility) filter. It then plots BUY/SELL triangles and can trigger alerts.
Thirdeyechart Gold Simulation Final 2Gold Simulation – Final Version 2 (Safe/Unsafe Trade Detection)
The Gold Simulation Final Version is a comprehensive TradingView indicator designed for traders who want an immediate understanding of gold market dynamics. This version monitors multiple XAU pairs simultaneously and integrates an advanced logic to detect Safe and Unsafe trade conditions in real time.
Key features:
Safe Trade: Indicates situations where market direction shows clear dominance and higher probability of trend continuity.
Unsafe Trade: Highlights areas where price movement is uncertain or potentially volatile, signaling traders to be cautious.
Multi-Timeframe Analysis: Calculates percentage changes across Weekly (W), Daily (D), 4-Hour (H4), and 1-Hour (H1), and combines them into a Total Average Trend Strength for a consolidated market view.
Clean Visual Layout: All data is displayed in a solid boxed table, making trend strength, direction, and safety status immediately clear.
Logic Overview
Percent change per timeframe:
pct_tf = ((close_tf - open_tf) / open_tf) * 100
Collect all timeframe values for each XAU pair:
values =
Total Average Strength:
Total_Avg = sum(values) / 4
Safe/Unsafe conditions are determined by configurable thresholds comparing dominance between buyers and sellers across timeframes.
This version helps traders quickly identify where trend is strong and stable versus where market conditions are uncertain, allowing better planning and risk management.
Disclaimer
This indicator is for educational and analytical purposes only. It does not provide financial or trading advice. Users are fully responsible for their own trading decisions, and markets carry risk.
© 2025 Ajik Boy. All rights reserved. Redistribution or commercial use without permission is prohibited.


5 MA Length Custom [wjdtks255]Indicator Title: 5 MA Length Custom
This indicator is a minimalist tool designed for pure trend visualization across five user-defined periods using Simple Moving Averages (SMAs). It contains no built-in signals or dynamic features—it serves strictly as a trend filter and confirmation layer.
Key Features and Customization
The indicator plots five fixed-color, fixed-thickness moving average lines. Only the Length (period) of each MA can be changed in the settings, offering clean, focused market analysis.
MA 1 (Default 5): Immediate price action.
MA 2 (Default 20): Short-term momentum.
MA 3 (Default 60): Key Mid-term Trend Line.
MA 4 (Default 40): Proxy for the standard Bollinger Band Center Line.
MA 5 (Default 120): Major Long-term Trend.
🧭 Trading Strategy: MA Filtered Reversion
This strategy uses the MA hierarchy for trend filtering and bias confirmation when executing trades based on an external signal indicator (e.g., a volatility/reversal signal like BB OPT EN).
🟢 Long Bias Confirmation (Buy)
The short-term trend must support the mid-term trend. This is confirmed when MA 2 (20) is positioned above MA 3 (60). When this alignment occurs, you should only take external Buy signals (reversal signals) for higher probability trades.
🔴 Short Bias Confirmation (Sell)
The short-term trend must align with the bearish direction. This is confirmed when MA 2 (20) is positioned below MA 3 (60). When this alignment occurs, you should only take external Sell signals (reversal signals) for higher probability trades.

Thirdeyechart Gold Simulation FinalGold Simulation – Final Version (Safe/Unsafe Trade Detection)
The Gold Simulation Final Version is a comprehensive TradingView indicator designed for traders who want an immediate understanding of gold market dynamics. This version monitors multiple XAU pairs simultaneously and integrates an advanced logic to detect Safe and Unsafe trade conditions in real time.
Key features:
Safe Trade: Indicates situations where market direction shows clear dominance and higher probability of trend continuity.
Unsafe Trade: Highlights areas where price movement is uncertain or potentially volatile, signaling traders to be cautious.
Multi-Timeframe Analysis: Calculates percentage changes across Weekly (W), Daily (D), 4-Hour (H4), and 1-Hour (H1), and combines them into a Total Average Trend Strength for a consolidated market view.
Clean Visual Layout: All data is displayed in a solid boxed table, making trend strength, direction, and safety status immediately clear.
Logic Overview
Percent change per timeframe:
pct_tf = ((close_tf - open_tf) / open_tf) * 100
Collect all timeframe values for each XAU pair:
values =
Total Average Strength:
Total_Avg = sum(values) / 4
Safe/Unsafe conditions are determined by configurable thresholds comparing dominance between buyers and sellers across timeframes.
This version helps traders quickly identify where trend is strong and stable versus where market conditions are uncertain, allowing better planning and risk management.
Disclaimer
This indicator is for educational and analytical purposes only. It does not provide financial or trading advice. Users are fully responsible for their own trading decisions, and markets carry risk.
© 2025 Thirdeyechart. All rights reserved. Redistribution or commercial use without permission is prohibited.

Marks current bars high and previous bars high and same for lowsits a halloween custom.
second indicator ,gotta make it look better too .

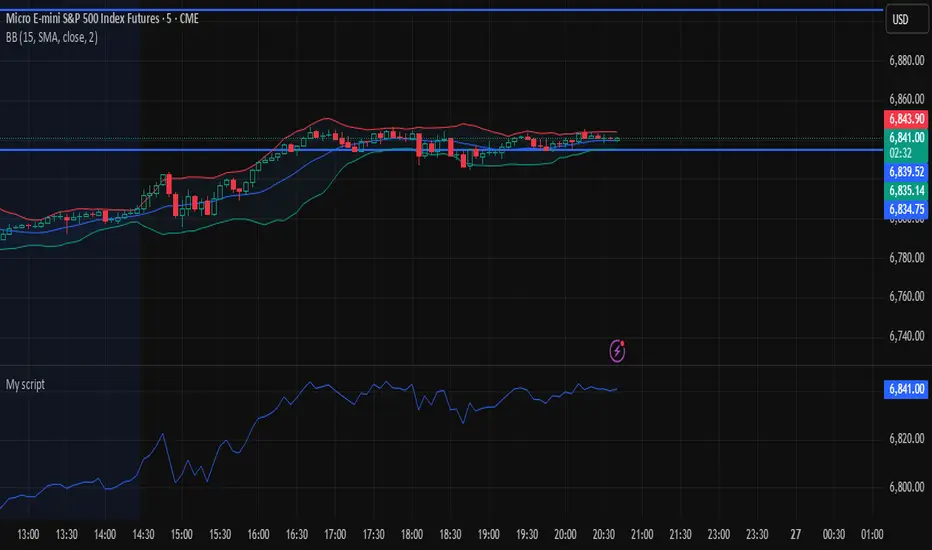
4-Day Average Initial Balance (RTH)//@version=5
indicator("4-Day Average Initial Balance (RTH)", overlay=true, max_labels_count=500, max_lines_count=500)
//===================== Inputs =====================
ibBars = input.int(12, "IB length in bars (5-min = 12 bars)", minval=1)
sessRTH = input.session("0930-1600", "RTH Session (Exchange Time)")
bgColor = input.color(color.new(color.blue, 70), "Background Color")
//===================== Session Logic =====================
inSession = time(timeframe.period, sessRTH) != 0
newSession = inSession and not inSession
//===================== IB Tracking =====================
var float ibHigh = na
var float ibLow = na
var int ibBarCount = 0
var bool ibDone = false
if newSession
ibHigh := na
ibLow := na
ibBarCount := 0
ibDone := false
if inSession and not ibDone
ibHigh := na(ibHigh) ? high : math.max(ibHigh, high)
ibLow := na(ibLow) ? low : math.min(ibLow, low)
ibBarCount += 1
if ibBarCount >= ibBars
ibDone := true
//===================== Store Last 4 IB Ranges =====================
var float ib1 = na
var float ib2 = na
var float ib3 = na
var float ib4 = na
todayIBRange = ibDone ? ibHigh - ibLow : na
justCompletedIB = ibDone and not ibDone
if justCompletedIB and not na(todayIBRange)
ib4 := ib3
ib3 := ib2
ib2 := ib1
ib1 := todayIBRange
//===================== Average of Last 4 =====================
sum = 0.0
count = 0
if not na(ib1)
sum += ib1
count += 1
if not na(ib2)
sum += ib2
count += 1
if not na(ib3)
sum += ib3
count += 1
if not na(ib4)
sum += ib4
count += 1
avgIB = count > 0 ? sum / count : na
//===================== Display Number on Right =====================
var table t = table.new(position.top_right, 1, 1, frame_color=color.new(color.black, 0), frame_width=1)
if barstate.islast
txt = na(avgIB) ? "Avg IB(4d): n/a" : "Avg IB(4d): " + str.tostring(avgIB, "#.00") + " pts"
table.cell(t, 0, 0, txt, text_color=color.white, text_halign=text.align_right, bgcolor=bgColor)

4-Day Average Daily ATRWhat this script does:
• Uses true Daily ATR, even on 5-minute charts
• Averages the last 4 fully completed trading days
• Displays one clean number only
• Lets you customize background color and text color
• Updates automatically each day
• Does not draw lines or clutter your chart