Umesh BC IST 3:30 AM Session Tracker + 4H Candles📌 IST 3:30 AM Session Tracker + 4H Candle Marker
This indicator is designed for traders who follow Indian Standard Time (IST) and want precise session tracking and 4H candle insights.
🔧 Features:
🕒 Daily Session Start at 3:30 AM IST
Automatically detects and marks the beginning of each new trading day based on 3:30 AM IST, not midnight.
Displays session Open, High, and Low lines.
Background shading for each session.
Customizable alert when a new day starts.
🟧 4H Candle Start Markers (IST Time)
Identifies every new 4-hour candle that starts at:
3:30, 7:30, 11:30, 3:30 PM, 7:30 PM, 11:30 PM IST
Adds a vertical line and label ("🟧 4H") above the candle.
Plots a dynamic line for the 4H candle's opening price.
Includes optional alert for new 4H candles.
🔔 Alerts Included:
"🕒 New IST Day Start": Triggers at 3:30 AM IST.
"🟧 New 4H Candle": Triggers at each 4H candle start (IST).
✅ Best for:
Intraday, swing, and institutional traders using IST-based analysis.
Those wanting more accurate daily sessions and clear candle structuring.
Indicators and strategies

[Kpt-Ahab] Moving Average Alarm OutputVarious Moving Average with Signal Outputs
Compatible with various backtesting-systems or risk management-systems for generating alarms and trading signals.
Also compatible with the djmad Multibit ecosystem, allowing for signal filtering or combining indicators.
Standard signal output Long/Short +1/-1
Filter, for suppressing signals
Various color variations.

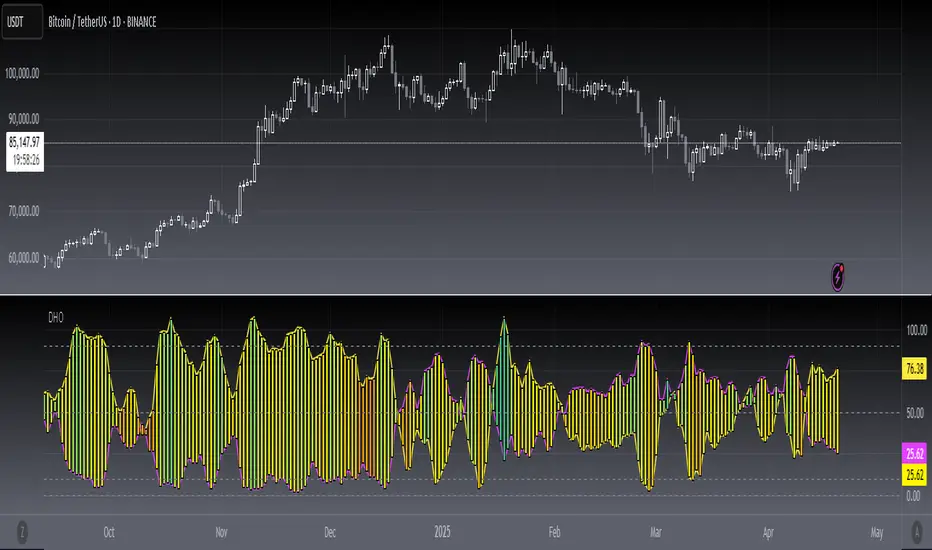
[blackcat] L3 Dark Horse OscillatorOVERVIEW
The L3 Dark Horse Oscillator is a sophisticated technical indicator meticulously crafted to offer traders deep insights into market momentum. By leveraging advanced calculations involving Relative Strength Value (RSV) and proprietary oscillatory techniques, this script provides clear and actionable signals for identifying potential buying and selling opportunities. Its distinctive feature—a vibrant gradient color scheme—enhances readability and makes it easier to visualize trends and reversals on the chart 📈↗️.
FEATURES
Advanced Calculation Methods: Utilizes complex algorithms to compute the Relative Strength Value (RSV) over specific periods, providing a nuanced view of price movements.
Default Period: 27 bars for initial RSV calculation.
Additional Period: 36 bars for extended RSV analysis.
Dual-Oscillator Components:
Component A: Derived using multiple layers of Simple Moving Averages (SMAs) applied to the RSV, offering a smoothed representation of short-term momentum.
Component B: Employs a unique averaging method tailored to capture medium-term trends effectively.
Dynamic Gradient Color Scheme: Enhances visualization through a spectrum of colors that change dynamically based on the calculated values, making trend identification intuitive and engaging 🌈.
Customizable Horizontal Reference Lines: Key levels are marked at 0, 10, 50, and 90 to serve as benchmarks for assessing the oscillator's readings, helping traders make informed decisions quickly.
Comprehensive Visual Representation: Combines the strengths of both components into a single, gradient-colored candlestick plot, providing a holistic view of market sentiment and momentum shifts 📊.
HOW TO USE
Adding the Indicator: Start by adding the L3 Dark Horse Oscillator to your TradingView chart via the indicators menu. This will overlay the necessary plots directly onto your price chart.
Interpreting the Components: Familiarize yourself with the two primary components represented by yellow and fuchsia lines. These lines indicate the underlying momentum derived from the RSV calculations.
Monitoring Momentum Shifts: Pay close attention to the gradient-colored candlesticks, which reflect the combined strength of both components. Notice how these candles transition through various shades, signaling changes in market dynamics.
Utilizing Reference Levels: Leverage the horizontal lines at 0, 10, 50, and 90 as critical thresholds. For instance, values above 50 might suggest bullish conditions, while those below could hint at bearish tendencies.
Combining with Other Tools: To enhance reliability, integrate this indicator with complementary technical analyses such as moving averages, volume profiles, or other oscillators like RSI or MACD.
LIMITATIONS
Market Volatility: In extremely volatile or sideways-trending markets, the indicator might produce false signals due to erratic price movements. Always cross-reference with broader market contexts.
Testing Required: Before deploying the indicator in real-time trading, conduct thorough backtesting across diverse assets and timeframes to understand its performance characteristics fully.
Asset-Specific Performance: The efficacy of the L3 Dark Horse Oscillator can differ significantly across various financial instruments and market conditions. Tailor your strategies accordingly.
NOTES
Historical Data: Ensure ample historical data availability to facilitate precise calculations and avoid inaccuracies stemming from insufficient data points.
Parameter Adjustments: Experiment with adjusting the default periods (27 and 36 bars) if you find them unsuitable for your specific trading style or market conditions.
Visual Customization: Modify the appearance settings, including line styles and gradient colors, to better suit personal preferences without compromising functionality.
Risk Management: While the indicator offers valuable insights, always adhere to robust risk management practices to safeguard against unexpected market fluctuations.
EXAMPLE STRATEGIES
Trend Following: Use the oscillator to confirm existing trends. When Component A crosses above Component B, consider entering long positions; conversely, look for short entries during downward crossovers.
Mean Reversion: Identify extreme readings near the upper (90) or lower (10) bands where prices might revert to mean levels, presenting potential reversal opportunities.
Divergence Analysis: Compare the oscillator's behavior with price action to spot divergences, which often precede trend reversals. Bullish divergence occurs when prices make lower lows but the oscillator shows higher lows, suggesting upward momentum.
SPY Trend-Based Buy Signals🔹 Overview
This indicator identifies potential buy signals on any asset by combining MACD and Stochastic Oscillator crossovers, while using the SPY’s trend (via exponential moving averages) as a broader market filter.
It helps traders stay aligned with macro momentum and avoid counter-trend entries.
🔍 How it works
SPY Trend Filter (Daily Timeframe):
Pulls SPY (S&P 500 ETF) data using EMAs (5, 20, 80)
Categorizes SPY market trend with color codes:
🟢 Green: Strong uptrend (EMA5 > EMA20 > EMA80)
🟡 Yellow: Potential uptrend / early momentum (EMA5 < EMA20 > EMA80)
🔴 Red: Downtrend (EMA5 < EMA20 < EMA80)
🔵 Blue: Possible trend reversal or mixed trend (EMA5 > EMA20 < EMA80)
Buy Signal Conditions (Combined Logic):
A signal is only triggered when:
- SPY trend is either yellow or blue (indicating a neutral-to-bullish or early recovery environment)
-The Stochastic Oscillator's %D line is below 50, showing possible upside
- A bullish MACD crossover occurs on the current symbol
🟢 Green signal: MACD crossover occurs below 0 (early reversal)
🟠 Orange signal: MACD crossover occurs above 0 (momentum continuation)
📈 Visual Output
🟢 Green label below the bar when an early reversal setup occurs
🟠 Orange label above the bar when a trend continuation signal appears
✅ Best Use Case
Ideal for:
Swing traders and position traders
LEAPS (long-term options) traders aligning entries with SPY trend
Anyone seeking clean, contextual entries filtered by market momentum
⚠️ Note: This indicator is most effective when used on fundamentally strong stocks that are sector leaders with solid earnings growth and market presence. Use technical signals as a complement to quality fundamentals.
ℹ️ Clarification: The moving averages displayed on the chart (e.g., on QQQ) are for visual reference only, to help users understand the color logic of the SPY trend filter. The actual logic and signals are based on SPY’s moving averages, regardless of the charted symbol.

[blackcat] L3 Projected Magic-9 SequenceOVERVIEW
The L3 Projected Magic-9 Sequence indicator is a sophisticated tool designed to help traders identify potential trend reversals through a unique sequence of price movements. By calculating projected highs and lows based on previous bar conditions, this script provides valuable insights into possible future market directions. It plots these key levels on the chart and highlights specific sequential patterns that often precede significant reversals, offering traders a visual advantage in their decision-making process 📈💡.
FEATURES
Projections: Calculates and plots projected highs and lows based on intricate conditions derived from previous bars' open, close, high, and low prices. These projections serve as dynamic support and resistance levels, helping traders anticipate potential turning points in the market 📊.
Sequential Patterns:
Identifies various sequential patterns known as "Magic" sequences, such as Magic-9 and Magic-13.
Labels these sequences directly on the chart for easy identification: 5, 6, 7, 8, 9, 12, 13 for both bullish and bearish trends.
Provides additional labels when these sequences align with projected highs or lows, enhancing the reliability of the signal 🏷️.
Differentiates between trend and sideways phases using the Magic-9 Project Range. Traditional sequences generating buy and sell signals of 9 and 13 during sideways swings are displayed indistinguishably from other numbers. However, the 9 and 13 generated by breakouts are highlighted with red and green labels for better visibility 🚦.
Project Range Adjustment:
The Project Range is automatically adjusted by Multiple Time Frame (MTF).
A higher cycle is selected as the baseline of the Project Range based on the current operating cycle, ensuring adaptability to varying market conditions ⏳.
Customization:
Offers customizable colors for plotted lines and labels, allowing users to tailor the appearance to their preferences 🎨.
Adjustable settings for lookback periods and other parameters to fine-tune the indicator according to individual trading styles.
Automatic Timeframe Selection:
Automatically selects the most suitable timeframe for data fetching, ensuring optimal performance across different chart intervals ⏳.
Ensures compatibility with various trading strategies, whether short-term intraday or long-term positional trading.
HOW TO USE
Adding the Indicator:
Open your TradingView platform and navigate to the chart where you want to apply the indicator.
Click on the "Indicators" button at the top of the screen and search for L3 Projected Magic-9 Sequence.
Select the indicator from the list and add it to your chart.
Understanding Projections:
Once added, observe the plotted projected highs and lows on your chart.
These lines represent anticipated support and resistance levels based on complex calculations involving previous bar data.
Identifying Sequential Patterns:
Look for labels such as 5, 6, 7, 8, 9, 12, and 13 appearing on the chart.
These labels signify specific sequential patterns that often precede market reversals.
Pay special attention to labels that include arrows (e.g., 9▼, 13▲), indicating alignment with projected highs or lows.
Note the differentiation between trend and sideways phases:
During sideways swings, traditional sequences generating buy and sell signals of 9 and 13 are displayed indistinguishably from other numbers.
Breakout-generated 9 and 13 are highlighted with red and green labels for clear identification.
Combining with Other Tools:
While the L3 Projected Magic-9 Sequence offers powerful insights, it is essential to combine its signals with other technical analysis tools.
Use moving averages, volume indicators, or candlestick patterns to confirm the validity of the identified sequences before executing trades.
LIMITATIONS
Market Conditions: The indicator performs best in trending markets but may generate false signals during periods of consolidation or range-bound movement 🌐.
Complexity: Due to its reliance on specific sequential patterns, some traders might find the concept challenging to grasp initially. Thorough testing and understanding are crucial before deploying it in live trading environments.
Data Dependency: Accurate projections depend on having sufficient historical data. Insufficient data may lead to less reliable results.
NOTES
Backtesting: Before implementing the indicator in real-time trading, conduct extensive backtesting to evaluate its effectiveness under various market conditions.
Risk Management: Always adhere to proper risk management principles, even when relying on robust indicators like this one. Set stop-loss orders and position sizes accordingly to protect your capital 🛡️.
Continuous Learning: Stay updated with the latest developments and adjustments made to the indicator by following community discussions and official updates from the author.

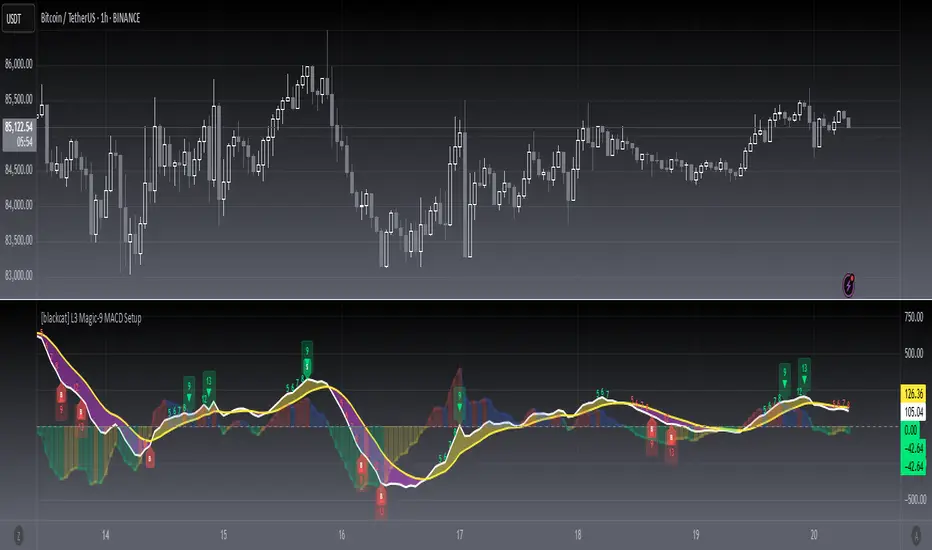
[blackcat] L3 Magic-9 MACD SetupOVERVIEW
The L3 Magic-9 MACD Setup indicator is meticulously crafted to assist traders in identifying precise buy and sell signals through an enhanced Moving Average Convergence Divergence (MACD) methodology. This advanced tool integrates the Magic-9 Sequential technique to refine signal accuracy by filtering out market noise. By providing clear visual cues via labeled charts and real-time alerts, it empowers users to make informed trading decisions swiftly and confidently 📈✅.
FEATURES
Customizable MACD Parameters:
Fast Length: Adjustable parameter to control the sensitivity of the fast moving average.
Slow Length: Configurable setting for the slow moving average to balance responsiveness and stability.
Signal Length: Modifiable value to determine the smoothing factor applied to the MACD line.
Dynamic Plot Visuals:
MACD Line: Representing the difference between short-term and long-term EMAs.
Signal Line: A smoothed version of the MACD line used to generate crossover signals.
Histogram: Illustrating the distance between the MACD and Signal lines, highlighting momentum changes.
All elements feature adjustable colors and styles for personalized visualization preferences 🎨.
Advanced Filtering Mechanism:
Utilizes the Magic-9 Sequential method to analyze consecutive price movements, enhancing signal reliability.
Counts sequential occurrences above or below initial values to detect trends more accurately 🔍.
Sequential Labels:
Displays numerical labels (e.g., '5', '6', etc.) at key points where sequential conditions are met, offering insights into trend strength.
Highlights significant reversals with special labels like '9' and '13' for critical decision-making moments 🏷️.
Buy/Sell Signals:
Generates clear 'B' (buy) and 'S' (sell) labels based on predefined conditions derived from sequential analysis.
Provides actionable trade suggestions directly on the chart for easy interpretation.
Alert System:
Supports customizable alerts to notify users instantly when buy/sell conditions are triggered.
Ensures timely responses to market movements without constant monitoring 🔔.
HOW TO USE
Add Indicator to Chart:
Access the TradingView platform and navigate to the indicators section.
Select ' L3 Magic-9 MACD Setup' from the list and add it to your desired chart.
Configure Settings:
Open the settings panel to adjust MACD parameters such as Fast Length, Slow Length, and Signal Length according to your trading strategy.
Modify plot colors and styles to suit your visual preferences for better readability.
Analyze Chart Labels:
Monitor the chart for sequentially numbered labels indicating trend strength and potential reversal points.
Pay close attention to special labels like '9' and '13' for crucial trading signals.
Combine with Other Tools:
Use additional technical indicators or fundamental analysis to confirm signals generated by the L3 Magic-9 MACD Setup.
Enhance decision-making accuracy by cross-verifying multiple data sources.
LIMITATIONS
Market Conditions Sensitivity:
The indicator may produce fewer reliable signals during periods of low volatility or range-bound markets.
Traders should be cautious of false positives in highly choppy environments 🌪️.
Dependency on Historical Data:
Accurate performance requires sufficient historical price data; insufficient data may lead to inaccurate calculations.
Regular updates and backtesting are essential to maintain effectiveness over time.
Single Indicator Risk:
Relying solely on MACD-based signals can miss broader market context; combining with other analytical tools is recommended.
Always validate signals through multiple lenses to mitigate risks associated with single-indicator strategies.
NOTES
Data Sufficiency:
Ensure your chart has enough historical data loaded to support robust MACD computations.
Periodically review and update data inputs to reflect current market dynamics.
Testing and Validation:
Conduct thorough testing on demo accounts before deploying the indicator in live trading scenarios.
Backtest across various market cycles to assess its resilience under different conditions.
Parameter Optimization:
Experiment with different parameter settings tailored to specific asset classes or trading styles.
Fine-tune the lookback period and other configurable options to align with personal trading objectives.
LinReg Heikin Ashi CandlesLinear Regression Heikin Ashi Candles will dramatically change how the candlesticks on your chart will appear. This script creates Heikin Ashi candles from the existing candlesticks and then applies wickless Linear Regression candles as an overlay. The result is an ultra smoothed 'Renko-like' chart that remains time-based and responsive.
Key Features:
Heikin Ashi Base: Provides a smoother representation of price trends by filtering out noise.
Linear Regression Candles on Heikin Ashi: Plots Linear Regression lines as candles on the Heikin Ashi chart, potentially highlighting the immediate trend direction and momentum within the smoothed data. Wicks are intentionally removed for a clearer focus on the linear progression.
Tillson T3 Moving Averages: Includes fast and slow T3 Moving Averages with customizable length and alpha. These smoothed moving averages can help identify trend direction and potential crossover signals. Users can toggle their visibility.
Volatility Bands: Integrates Volatility Bands based on Average True Range (ATR) with customizable length, ATR type (RMA, SMA, EMA, WMA), and inner/outer multipliers. These bands help gauge price volatility and potential reversal zones. Users can toggle the visibility of the basis line.
Customizable Colors: Allows users to customize the colors of the Linear Regression Heikin Ashi bullish and bearish candles.
How to Use:
This is an overlay on your chart so you'll need to 'hide' the existing candlesticks on your chart.
This indicator can be used on any timeframe from seconds to days to quickly identify market trend, gauge volatility, and potentially find entry/exit points. Consider looking for confluence between the candle color/direction, T3 MA crossovers, and price interaction with the Volatility Bands.
Note: This indicator plots Linear Regression directly on Heikin Ashi candles, removing wicks for a focus on the linear trend within the smoothed data. Adjust the input parameters to suit your trading style and the specific market conditions.
HUGE CREDIT to ugurvu who originally created the Linear Regression Candles indicator that my indicator pulls code from.

ADX Divergence and Gap Monitor [theUltimator5]ADX Divergence and Gap Monitor is a custom technical analysis tool designed to visualize momentum imbalances and sudden shifts in trend participation using the ADX system. It combines traditional ADX, DI+ and DI− calculations with dynamic filtering and visual highlighting to help identify key moments of directional acceleration or weakening.
🔍 What It Does:
This indicator builds on the Average Directional Index (ADX) system to detect conditions where market trend strength diverges significantly from directional input (DI) activity. It includes two major visual signals:
Highlight Backgrounds
These appear when the indicator detects a “gap” or sudden acceleration in DI values while ADX remains low, suggesting early-stage momentum bursts or signal noise spikes.
The trigger threshold for DI change can be adjusted using the Gap Trigger Level input.
A background highlight is shown when DI+ or DI− increases sharply, either from a low-ADX environment or from a rapid standalone spike.
GAP Markers
Optional yellow label markers display the word "GAP" just below the lowest line (ADX, DI+, or DI−) whenever a gap condition is triggered. These provide a more noticeable visual cue without crowding the chart.
You can enable or disable the markers with the Show GAP Markers toggle.
🧠 Advanced Divergence Detection:
The script also scans for dominant ADX divergence events, where ADX is significantly higher than DI+ or DI−, indicating strong trend force with weak directional participation. When these conditions are met:
Red or green background fills appear depending on whether DI+ or DI− is being overpowered.
These conditions are based on customizable moving averages and DI strength relationships.
⚙️ Key Inputs:
ADX Length: Period for ADX calculation
DI Moving Average: Smoothing length for directional index signals
Gap Trigger Level: Minimum DI change needed to trigger a GAP highlight
Show Highlight Backgrounds: Toggle to display or hide background signals
Show GAP Markers: Toggle to show or hide text-based GAP labels
🧪 Use Cases:
Spot early breakouts or reversals when DI activity spikes while ADX is still low
Identify periods of trend exhaustion or false breakouts using divergence logic
Confirm trade entry points when ADX begins to rise after a GAP event

ICT SMC Liquidity Grabs and OBsICT SMC Liquidity Grabs + Order Blocks + Fibonacci OTE Levels
A High-Probability Entry Engine for Smart Money Concept Traders
This script combines three powerful Smart Money Concepts (SMC) into a single tool: Liquidity Grabs, Order Block Zones, and Fibonacci OTE Levels, allowing traders to identify institutional entry models with clean, rule-based visual signals.
It’s designed to simplify SMC trading by highlighting confluence zones where price is likely to reverse or continue — with clear visual zones, entry arrows, and take profit projections.
🔍 What This Script Does:
Detects Liquidity Grabs
Identifies when price sweeps above/below the highest high or lowest low within a user-defined lookback period and closes back inside.
Plots orange labels on the chart to signal potential liquidity events (LG-H / LG-L).
Plots Order Blocks After Liquidity Grabs
After a liquidity grab, the script looks for displacement candles (strong bullish or bearish moves) and draws highlighted OB zones extending several bars to the right.
These zones represent potential institutional footprints for price reversals.
Draws Fibonacci OTE Levels (Optimal Trade Entry)
Uses recent swing high and low pivots to automatically calculate OTE zones (default: 62% and 75% retracement levels).
Draws these retracement zones for both bullish and bearish setups.
Marks Valid OTE Entry Zones
Buy/Sell zones only trigger when:
A liquidity grab occurs,
Price enters the OTE zone,
And a strong confirming candle is present.
Plots green/red arrows for valid buy/sell OTE entries.
Auto-Draws Take Profit Zones
TP1 = Previous swing high/low
TP2 = Risk-based R-multiplied extension (e.g., 1.5R — customizable)
Alerts
Triggers alerts when valid buy or sell OTE setups are detected.
⚙️ Customization Features:
Toggle each feature: Liquidity Grabs, Order Blocks, Fibonacci OTE levels
Set Fibonacci retracement percentages (e.g., 0.62 / 0.75)
Adjust lookback window for liquidity detection
Customize the take-profit multiplier (R-based)
Full control over visuals: colors, labels, and lines
💡 How to Use:
Use this script to scan for high-confluence trade setups based on Smart Money principles.
Combine with session timing (e.g., New York open), major swing structure, or Kill Zone windows for maximum edge.
Look for arrows inside OB zones or OTE levels following liquidity sweeps for cleaner entries.
🔗 Works Best With:
✅ First FVG — Opening Range Fair Value Gap Detector: Identify early inefficiencies to set the narrative for the day.
✅ Liquidity Levels — Smart Swing Lows: Spot key structural lows that can fuel stop hunts and reversals.
✅ ICT Turtle Soup — Liquidity Reversal: Add a classic reversal pattern to your toolkit to catch fakeouts cleanly.
Together, these tools build a complete Smart Money ecosystem for entry precision, risk management, and price behavior forecasting.

ICT Turtle Soup (Liquidity Reversal)ICT Turtle Soup — Liquidity Reversal Detection
Trap the Trap: A Precision Reversal Strategy from the Inner Circle Trader Playbook
This indicator implements the Turtle Soup liquidity reversal setup — a widely used ICT (Inner Circle Trader) concept that targets false breakouts beyond recent swing highs or lows. These patterns typically occur when price grabs liquidity above or below a known level, then snaps back, trapping retail traders and creating a high-probability reversal scenario.
🔍 What This Script Does:
Detects Liquidity Sweeps Above/Below Key Swing Levels
Uses a customizable swing lookback to identify recent swing highs and lows.
Triggers a Bearish Turtle Soup when price runs above a previous swing high and closes back below.
Triggers a Bullish Turtle Soup when price sweeps below a prior swing low and closes back above.
Plots Clear Visual Signals
Reversal signals appear as 🐢🔻 (Bearish) or 🐢🔺 (Bullish) markers directly on your chart.
Optional labels can be enabled for enhanced journaling and review.
Real-Time Alerts
Receive alert notifications when a Turtle Soup setup is detected — ideal for scalpers or intraday traders watching for reversals around liquidity pools.
⚙️ Customization Options:
Set the swing lookback sensitivity (default: 5)
Enable or disable labels
Choose label font size
Customize colors for bullish and bearish signals
💡 How to Use:
Deploy on intraday timeframes (e.g. 5m–15m) for high-resolution liquidity analysis.
Watch for signals at key highs/lows, session extremes, or zones where liquidity is likely resting.
Combine with tools like FVGs, Order Blocks, and OTE zones for layered confirmation.
🔗 Combine With These Tools for a Complete SMC Edge:
✅ First FVG — Opening Range Fair Value Gap Detector
✅ ICT SMC Liquidity Grabs + OB + Fibonacci OTE Levels
✅ Liquidity Levels — Smart Swing Lows
Together, these tools form a high-precision Smart Money toolkit — helping traders map, anticipate, and act on institutional-level liquidity events with clarity and confidence.

ICT Turtle Soup Ultimate V2📜 ICT Turtle Soup Ultimate V2 — Advanced Liquidity Reversal System
Overview:
The ICT Turtle Soup Ultimate V2 is a next-generation liquidity reversal indicator built on the principles of smart money concepts (SMC) and the classic ICT Turtle Soup setup. It is designed to detect false breakouts (liquidity grabs) at key swing points, enhanced by proprietary logic that filters out low-quality signals using a combination of trend context, kill zone timing, candle wick behavior, and multi-timeframe imbalance zones.
This tool is ideal for intraday traders seeking high-probability entry signals near liquidity pools and imbalance zones — where smart money makes its move.
🔍 What This Script Does
🧠 Liquidity Grab Detection (Turtle Soup Core Logic)
The script scans for recent swing highs/lows using a user-defined lookback.
A signal is generated when price breaks above/below a previous swing level but closes back inside — indicating a liquidity run and likely reversal.
A special Wick Trap Mode enhances this logic by detecting long-wick fakeouts — where the wick grabs stops but the candle body closes opposite the breakout direction.
📉 Trend Filter with ATR Buffer
Optional trend filter uses a simple moving average (SMA) to gauge market direction.
Instead of hard filtering, it applies an ATR-based buffer to allow for entries near the trend line, reducing signal suppression from micro-fluctuations.
🕰️ Kill Zone Session Filtering
Only show signals during institutional trading hours:
London Session
New York AM
Or any custom user-defined session
Helps traders avoid low-volume hours and focus on where stop hunts and price expansions typically occur.
🧱 Multi-Timeframe FVG Confluence (Optional)
Signal validation is strengthened by checking if price is within a higher timeframe Fair Value Gap — commonly used to identify imbalances or inefficiencies.
Filters out setups that lack underlying displacement or order flow justification.
🎨 Visual Feedback
Plots 🔺 bullish and 🔻 bearish markers at signal candles.
Optionally displays:
Swing High/Low Labels (SH / SL)
Reversal distance labels
Background color shading on valid signals
Includes built-in alerts for automated trade notification.
🔑 Unique Benefits
Wick Trap Detection: A proprietary approach to detecting stop hunts via wick behavior, not just candle closes.
ATR-based trend filtering: Avoids unnecessary filtering while still maintaining directional bias.
All-in-one system: No need to stack multiple indicators — swing detection, reversal logic, session filtering, and imbalance confirmation are all integrated.
💡 How to Use
Enable Wick Trap Mode to detect stealthy liquidity grabs with strong wicks.
Use Kill Zone filters to trade only when institutions are active.
Optionally enable FVG confluence to improve confidence in reversal zones.
Watch for Bullish signals near SL levels and Bearish signals near SH levels.
Combine with your own execution strategy or other SMC tools for optimal results.
🔗 Best Used With:
Maximize your edge by combining this script with complementary SMC-based tools:
✅ First FVG — Opening Range Fair Value Gap Detector
✅ ICT SMC Liquidity Grabs + OB + Fibonacci OTE Levels
✅ Liquidity Levels — Smart Swing Highs and Lows with horizontal line projections

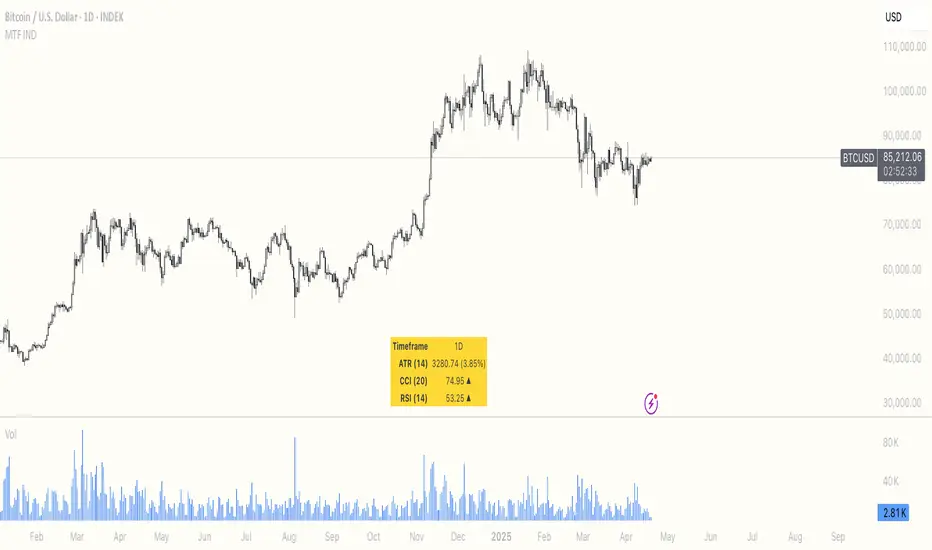
Multi Timeframe ATR, CCI & RSIMulti Timeframe ATR, CCI & RSI (MTF IND)
This indicator displays ATR, CCI, and RSI values from a custom selected timeframe in a clean table overlay.
It helps monitor volatility and momentum from higher/lower timeframes directly on your current chart.
Features:
• Select custom timeframe for all indicators (e.g., 1D, 1W, 65m, etc.)
• ATR with selectable smoothing type (RMA, SMA, EMA, WMA)
• CCI & RSI with trend arrows (▲ rising, ▼ falling, ▬ neutral)
• Compact summary table
MA Crossover [AlchimistOfCrypto]🌌 MA Crossover Quantum – Illuminating Market Harmonic Patterns 🌌
Category: Trend Analysis Indicators 📈
"The moving average crossover, reinterpreted through quantum field principles, visualizes the underlying resonance structures of price movements. This indicator employs principles from molecular orbital theory where energy states transition through gradient fields, similar to how price momentum shifts between bullish and bearish phases. Our implementation features algorithmically optimized parameters derived from extensive Python-based backtesting, creating a visual representation of market energy flows with dynamic opacity gradients that highlight the catalytic moments where trend transformations occur."
📊 Professional Trading Application
The MA Crossover Quantum transcends the traditional moving average crossover with a sophisticated gradient illumination system that highlights the energy transfer between fast and slow moving averages. Scientifically optimized for multiple timeframes and featuring eight distinct visual themes, it enables traders to perceive trend transitions with unprecedented clarity.
⚙️ Indicator Configuration
- Timeframe Presets 📏
Python-optimized parameters for specific timeframes:
- 1H: EMA 23/395 - Ideal for intraday precision trading
- 4H: SMA 41/263 - Balanced for swing trading operations
- 1D: SMA 8/44 - Optimized for daily trend identification
- 1W: SMA 32/38 - Calibrated for medium-term position trading
- 2W: SMA 17/20 - Engineered for long-term investment signals
- Custom Settings 🎯
Full parameter customization available for professional traders:
- Fast/Slow MA Length: Fine-tune to specific market conditions
- MA Type: Select between EMA (exponential) and SMA (simple) calculation methods
- Visual Theming 🎨
Eight scientifically designed visual palettes optimized for neural pattern recognition:
- Neon (default): High-contrast green/red scheme enhancing trend transition visibility
- Cyan-Magenta: Vibrant palette for maximum visual distinction
- Yellow-Purple: Complementary colors for enhanced pattern recognition
- Specialized themes (Green-Red, Forest Green, Blue Ocean, Orange-Red, Grayscale): Each calibrated for different market environments
- Opacity Control 🔍
- Variable transparency system (0-100) allowing seamless integration with price action
- Adaptive glow effect that intensifies around crossover points - the "catalytic moments" of trend change
🚀 How to Use
1. Select Timeframe ⏰: Choose from scientifically optimized presets based on your trading horizon
2. Customize Parameters 🎚️: For advanced users, disable presets to fine-tune MA settings
3. Choose Visual Theme 🌈: Select a color scheme that enhances your personal pattern recognition
4. Adjust Opacity 🔎: Fine-tune visualization intensity to complement your chart analysis
5. Identify Trend Changes ✅: Monitor gradient intensity to spot high-probability transition zones
6. Trade with Precision 🛡️: Use gradient intensity variations to determine position sizing and risk management
Developed through rigorous mathematical modeling and extensive backtesting, MA Crossover Quantum transforms the fundamental moving average crossover into a sophisticated visual analysis tool that reveals the molecular structure of market momentum.

ICT Turtle Soup (Liquidity Reversal)ICT Turtle Soup — Liquidity Reversal Detection
Classic Liquidity Trap Reversal Strategy for Smart Money Traders
This indicator implements the ICT Turtle Soup concept — a classic liquidity-based reversal pattern — which occurs when price runs above or below a recent swing level to grab liquidity, then sharply reverses. This pattern is commonly used in Smart Money Concepts (SMC) and Inner Circle Trader (ICT) strategies to anticipate false breakouts and high-probability reversals.
🔍 What This Script Does:
Identifies Swing Highs & Lows
Detects recent swing highs and lows using a customizable lookback period.
Tracks Liquidity Grabs
A bearish Turtle Soup setup is triggered when price breaks above a recent swing high but closes back below it.
A bullish Turtle Soup setup is triggered when price breaks below a recent swing low but closes back above it.
These conditions often signal liquidity traps, where price sweeps resting orders before reversing.
Plots Signals Directly on the Chart
Turtle Soup setups are marked with 🐢🔻 (bearish) and 🐢🔺 (bullish) labels.
Optional full-text labels can also be displayed for clarity and journaling.
Includes Alert Conditions
Alerts can be enabled to notify you of bullish or bearish Turtle Soup reversals in real-time.
⚙️ Customization Features:
Adjustable swing lookback period
Enable/disable Turtle Soup labels
Set label font size
Choose your preferred bullish/bearish signal colors
💡 How to Use:
Add this script to your chart (ideally on intraday timeframes such as 5m–15m).
Wait for a Turtle Soup signal near a key swing high/low or liquidity zone.
Combine with other confirmation tools (e.g., FVGs, Order Blocks, OTE) for stronger setups.
Use alerts to stay ahead of fast-moving reversals.
🧠 Why It Works:
Turtle Soup setups are rooted in liquidity theory — they exploit the market’s tendency to sweep obvious swing levels before reversing. These moves often trap retail traders and mark the beginning of Smart Money entries.
🔗 Best Used With:
Maximize the edge by combining this with other SMC tools:
✅ First FVG — Opening Range Fair Value Gap Detector
✅ ICT SMC Liquidity Grabs + OB + Fibonacci OTE Levels
✅ Liquidity Levels — Smart Swing Lows
Together, they create a complete ecosystem for identifying, confirming, and executing liquidity-driven trade setups with precision.

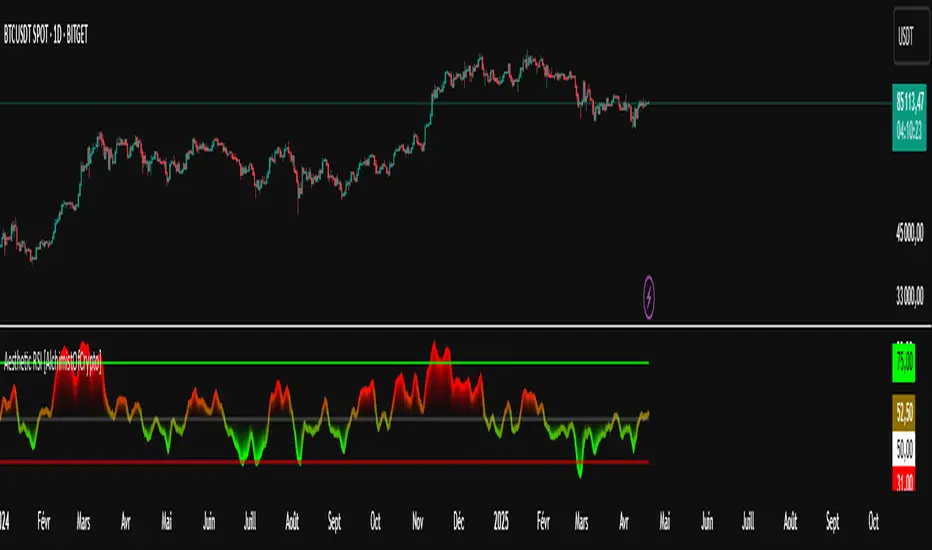
Aesthetic RSI [AlchimistOfCrypto]🌌 Aesthetic RSI – Unveiling the Fractal Forces of Markets 🌌
Category: Momentum Indicators 📈
"The RSI oscillator, formalized through an advanced mathematical prism, reveals the underlying fractal structures of price movements. This indicator draws inspiration from quantum principles of divergence-convergence where the probability of a return to equilibrium increases proportionally to the distance from the median point. Our implementation employs sophisticated algorithmic smoothing to filter out the stochastic noise inherent in financial markets, allowing visualization of the true momentum forces according to thermodynamic entropy principles applied to trading systems."
📊 Professional Trading Application
The Aesthetic RSI is a visually stunning and mathematically refined take on the classic Relative Strength Index. With customizable settings, advanced smoothing, and eight unique visual palettes, it empowers traders to detect momentum shifts and divergences with unparalleled clarity.
⚙️ Indicator Configuration
- Length 📏
The core parameter (default: 20) that determines the calculation period.
- Lower values (8-14): Increase sensitivity for short-term trading.
- Higher values (21-34): Provide stronger signals for position trading.
- OverBought/OverSold Thresholds 🎯
Customizable boundaries (default: 75/25) to identify extreme market conditions.
- Calibrate based on asset volatility: Higher volatility assets may need wider thresholds (80/20) to reduce false signals.
- Style 🎨
Eight meticulously crafted visual palettes optimized for pattern recognition:
- Miami Vice (default): High-contrast cyan/magenta scheme for spotting divergences.
- Cyberpunk: Yellow/purple combo to highlight momentum shifts.
- Classic: Traditional green/red for conventional analysis.
- High Contrast: Maximum visual separation for traders with visual impairments.
- Specialized palettes (Forest, Ocean, Fire, Monochrome): Tailored for diverse market conditions.
- Mode Selection 🔄
- Full: Displays a complete gradient spectrum across the RSI range, emphasizing momentum transitions between 35-65.
- OverZone: Focuses on actionable extreme zones, reducing noise in ranging markets.
🚀 How to Use
1. Adjust Length ⏰: Set the period based on your trading style (short-term or long-term).
2. Fine-Tune Thresholds 🎚️: Customize overbought/oversold levels to match the asset’s volatility.
3. Select a Palette 🌈: Choose a visual style that enhances your pattern recognition.
4. Choose Mode 🔍: Use "Full" for detailed momentum analysis or "OverZone" for extreme zone focus.
5. Spot Divergences ✅: Look for price-RSI divergences to anticipate reversals.
6. Trade with Precision 🛡️: Combine with other indicators for high-probability setups.
📅 Release Notes (April 2025)
Aesthetic RSI blends quantum-inspired mathematics with artistic visualization, redefining momentum analysis. Stay tuned for future enhancements! ✨
🏷️ Tags
#Trading #TechnicalAnalysis #RSI #Momentum #Divergence #MultiTimeframe #TradingStrategy #RiskManagement #Forex #Stocks #Crypto #Bitcoin #AlgoTrading #DayTrading #SwingTrading #TheAlchimist #QuantumTrading #VisualTrading #PatternRecognition
Liquidity Levels (Smart Swing Lows)Liquidity Levels — Smart Swing Low Detection
Efficient Liquidity Sweep Visualization for Smart Money Traders
This script automatically identifies and plots liquidity-rich swing lows based on pivot logic, filters them to remove redundant levels, and overlays daily highs/lows for added context — giving Smart Money Concept (SMC) traders a clean, actionable map of liquidity.
It’s designed to be minimal yet powerful: perfect for spotting potential liquidity grabs, mitigation zones, and sweep targets with zero chart clutter.
🔍 What This Script Does:
Detects Smart Swing Lows
Uses fixed pivot detection (left = 3, right = customizable) to identify structurally significant swing lows.
Filters out swing lows that are too close together using a percentage-based spacing threshold to reduce noise.
Mitigation Cleanup Logic
Tracks whether recent price action breaches past swing lows.
If breached, the swing level is automatically removed, keeping only relevant, unmitigated liquidity levels on your chart.
Plots Daily Highs and Lows
Each new trading day, horizontal rays mark the prior day’s high and low — useful for identifying resting liquidity and possible sweep zones.
Labeling and Style Customization
Optional labels for swing lows.
Full control over label size, color, and visibility to match any chart aesthetic.
Timeframe Filtering
Runs exclusively on 5m, 10m, and 15m charts to ensure optimal reliability and signal clarity.
⚙️ Customization Features:
Pivot sensitivity (Right side control)
Minimum distance between swing lows (in %)
Label visibility, size, and color
Line width and colors for both swing levels and daily highs/lows
Mitigation cleanup lookback length
💡 How to Use:
Add the script to a qualifying intraday chart (5–15m).
Use the swing low levels to monitor liquidity-rich zones.
Combine with your personal strategy to identify liquidity grabs, potential reversal zones, or entry points following a sweep.
Let the built-in cleanup logic remove any already-mitigated levels so you can focus on active targets.
🚀 What Makes It Unique:
This isn’t just another pivot plotter — it’s a smart, self-cleaning SMC tool designed for modern liquidity-based trading strategies.
A must-have for traders using concepts like liquidity grabs, mitigation blocks, or sweep-to-reverse trade models.
🔗 Best used in combination with:
✅ First FVG — Opening Range Fair Value Gap Detector: Pinpoint the day’s first imbalance zone for intraday setups.
✅ ICT SMC Liquidity Grabs + OB + Fibonacci OTE Levels: Confluence-based entries powered by liquidity logic, order blocks, and premium/discount zones.
Used together, these scripts form a complete Smart Money toolkit — helping you build high-probability setups with confidence, clarity, and clean charts.

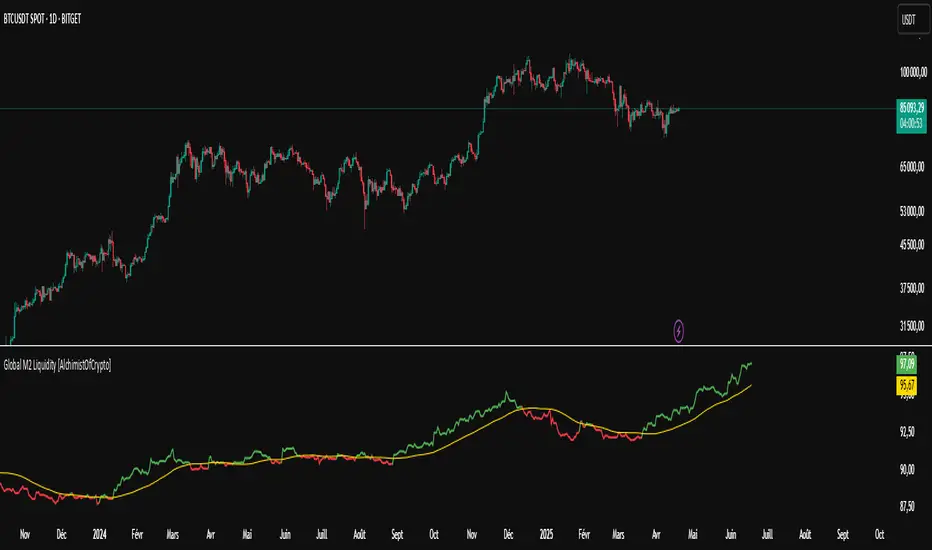
Global M2 Liquidity [TheAlchimist]🌍 Global M2 Liquidity – Navigating the Quantum Field of Markets 🌍
Category: Macroeconomic Indicators 📊
"In quantum physics, the observer effect states that the mere act of observation changes the system being observed. Similarly, in financial markets, global liquidity acts as a quantum field that permeates all market states simultaneously. Just as Heisenberg’s uncertainty principle suggests we cannot precisely measure both position and momentum, the M2 money supply’s influence on market dynamics creates a complex web of cause and effect across multiple timeframes."
📈 Overview
The Global M2 Liquidity indicator is a powerful tool that tracks the combined M2 money supply from five major economies (US, EU, China, Japan, UK), converted to USD 💵, offering a panoramic view of global liquidity conditions. With multi-timeframe analysis and a customizable forward-shift feature, it empowers traders to anticipate market movements driven by liquidity trends.
✨ Features
- Global Coverage 🌎: Monitors M2 money supply from 5 major economic regions (US, EU, China, Japan, UK).
- Real-Time Conversion 💱: Converts all data to USD for consistent analysis.
- Multi-Timeframe Analysis ⏰: Tracks liquidity from 15-minute to weekly charts.
- Forward-Shift Capability 🔮: Aligns M2 data with future price action for predictive insights.
- Color-Coded Trends 🎨: Visualizes liquidity trends (🟢 Expansion, 🔴 Contraction).
🚀 How to Use
1. Main Line 📉: Displays total global M2 liquidity in trillions of USD.
2. Golden Moving Average ⭐: Identifies the overall trend direction.
3. Trend Colors 🟢🔴:
- Green: Liquidity expanding above the moving average (bullish for risk assets).
- Red: Liquidity contracting below the moving average (bearish signal).
4. Forward Shift ⏩: Use the shift parameter to align M2 data with price action for predictive analysis.
5. Combine with Price Action 🔍: Correlate liquidity trends with assets like Bitcoin, stocks, or forex for strategic entries/exits.
⚙️ Settings
- MA Period 📏: Length of the moving average (default: 50).
- Shift ⏳: Number of days to shift data forward (default: 60).
🏷️ Tags
#Trading #Macroeconomic #M2Liquidity #GlobalLiquidity #MoneySupply #MultiTimeframe #TrendAnalysis #PredictiveAnalysis #Forex #Stocks #Crypto #Bitcoin #RiskAssets #CentralBanks #USD #TheAlchimist #QuantumTrading #AlgoTrading #DayTrading #SwingTrading
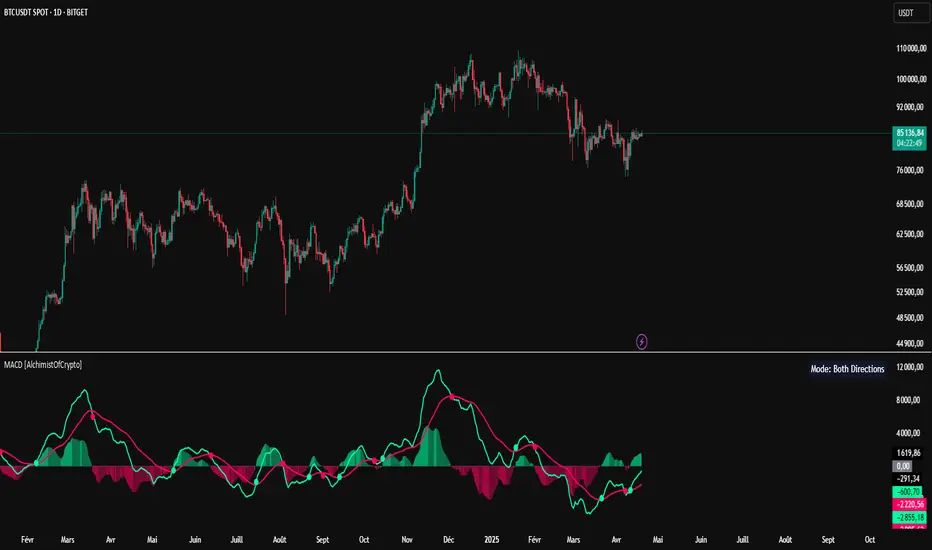
MACD [AlchimistOfCrypto]🌠 MACD Optimized with Python – Decoding the Chaos of Markets 🌠
Category: Trend Analysis 📈
"Like the dynamic systems studied in chaos theory, financial markets appear unpredictable at first glance. Yet, as Edward Lorenz demonstrated, even in apparent chaos reside harmonious mathematical structures. The MACD (Moving Average Convergence Divergence) represents this quest for order within disorder—a mathematical formulation that extracts coherent signals from price noise. By combining moving averages of different periods, this indicator reveals hidden cycles and precise moments when market energy shifts, like a pendulum obeying the immutable laws of physics."
📊 Technical Overview
The MACD Optimized with Python is a revolutionary take on the classic Moving Average Convergence Divergence indicator. Powered by Python-driven optimizations 🐍, it adapts to specific timeframes, delivering razor-sharp signals for traders seeking to navigate the market’s chaos with precision.
⚙️ How It Works
- Python-Optimized Parameters 🔧: Unlike the standard MACD (12,26,9), our version uses mathematically tailored parameters for each timeframe:
- 1H: 11/38/27
- 4H: 9/98/27
- 1D: 45/90/29
- 1W: 9/16/3
- 2W: 5/20/5
- Intuitive Visuals 🎨:
- Crossovers marked by colored dots 🟢🔴 for clear entry/exit signals.
- Histogram with a color gradient 🌈 to show direction and momentum intensity.
- Customizable Signals 🎯: Choose to display long, short, or both signals to match your trading style.
🚀 How to Use This Indicator
1. Select Your Timeframe ⏰: Choose the timeframe aligned with your trading horizon (1H, 4H, 1D, 1W, or 2W).
2. Spot Crossovers 🔍: Watch for the MACD line (green) crossing the signal line (red) to identify potential trend changes.
3. Confirm with Divergence ✅: Combine crossovers with price-MACD divergence for high-probability trend reversal signals.
📅 Release Notes
Unlock the hidden order of markets with this Python-optimized MACD. Stay tuned for future enhancements! ✨
🏷️ Tags
#Trading #TechnicalAnalysis #MACD #TrendAnalysis #Python #MultiTimeframe #Divergence #Momentum #TradingStrategy #RiskManagement #Forex #Stocks #Crypto #ChaosTheory #OptimizedTrading
First FVG Custom Time RangeFirst FVG — Opening Range Fair Value Gap Detector
Smart Money Opening Imbalance Strategy Tool
This script automatically detects and highlights the first Fair Value Gap (FVG) that forms between 9:30 and 10:00 AM Eastern Time (New York session open) — a critical period often referred to as the Opening Range. It’s designed for Smart Money traders looking to isolate early-morning inefficiencies that may influence market behavior throughout the trading day.
🔍 What This Script Does:
Automatically Detects the First FVG in the Opening Range
Scans price action between 9:30 and 10:00 AM ET and identifies the first valid bullish or bearish FVG that forms.
Only one FVG is shown per day — ensuring a clean, focused view.
Draws a Visual Zone
Once detected, the FVG zone is extended forward on the chart (customizable duration).
A labeled zone helps users track how price reacts to it throughout the session.
Optional Retest Alerts
Alerts you when price re-enters the zone — a potential reaction point used by SMC traders.
Customization Options
Set your preferred session time window
Adjust zone duration (in bars)
Customize label font size, colors, and visibility
Enable/disable alert on retest
📈 Why the First FVG Matters:
Time-Sensitive Setup: The first FVG typically forms no earlier than 9:31 AM ET and represents a potential “time distortion” or imbalance zone created by aggressive market participants during the open.
Behavioral Study: Many traders journal how price behaves around this zone each day — whether it acts as support, resistance, or gets traded through later in the session.
Predictive Value: Observing how this zone is respected or broken can provide anticipatory insight into intraday price action, rather than reactive analysis.
Great for New Traders: This opening FVG is often recommended as a starting reference point for building trade models and understanding how institutional imbalances unfold.
🚀 What Makes It Unique:
This tool doesn’t spam your chart with every FVG. It laser-focuses on a single, time-bound zone backed by institutional logic — the first presented imbalance of the day during the opening range.
Use it to:
Monitor price behavior around early inefficiencies
Plan journal entries and pattern recognition
Align intraday setups with a high-probability SMC model
Whether you’re scalping, journaling market structure, or refining entries based on liquidity behavior — this script helps you make the first 30 minutes count.

ICT SMC Liquidity Grabs and OBsICT SMC Liquidity Grabs + OB + Fibonacci OTE Levels
Smart Money Concepts Trading Assistant
This script is built for traders who follow ICT (Inner Circle Trader) and Smart Money Concepts. It intelligently combines three critical components of SMC trading: Liquidity Grabs, Order Blocks, and Fibonacci-based Optimal Trade Entry (OTE) zones — giving traders visual cues for potential high-probability reversals and entry points.
🔍 What This Script Does:
Detects Liquidity Grabs
Identifies swing highs/lows where price sweeps liquidity, then immediately reverses.
Labels them with orange markers when price takes out previous highs/lows but closes back inside.
Draws Order Blocks
After a liquidity grab, the script looks for strong bullish or bearish candles and automatically highlights the OB zone.
These OB zones are visualized with transparent colored boxes extending several bars forward.
Plots Fibonacci OTE Levels
Uses recent swing high/low pivots to dynamically draw customizable OTE retracement levels (e.g., 62% and 75%) for both long and short setups.
Highlights Optimal Entry Zones
Marks valid OTE-based buy/sell opportunities only when:
Liquidity has been taken,
Price enters the OTE zone,
And a strong confirming candle appears.
Adds visual zones, trade labels, and optional alerts for each qualified entry.
Includes Take Profit Targets
Automatically calculates take-profit levels based on previous structure and risk-reward ratios.
TP1 is the previous swing, and TP2 is an extended R-multiple (customizable by user).
⚙️ Customization Options:
Toggle each feature (Liquidity Grabs, OBs, Fibonacci Levels)
Adjust Fibonacci levels (default: 62% and 75%)
Set lookback period for liquidity checks
Customize the R-multiple for TP2 levels
💡 How to Use:
Enable desired features from the input panel.
Watch for Buy/Sell OTE zones highlighted in green/red.
Confirm with liquidity sweep and OB support for stronger signals.
Use the automatically generated TP levels to manage risk.
🚀 What Makes It Unique:
Unlike other open-source mashups, this script synchronizes multiple SMC concepts into a single tool that:
Waits for high-confidence conditions (not just blind fib or OB detection)
Validates entries using multiple confluences
Visually marks actionable setups
Automates trade management zones
Whether you're trend-trading, scalping, or swing trading ICT-style, this tool offers a streamlined, smart-money-aligned workflow directly on your chart.

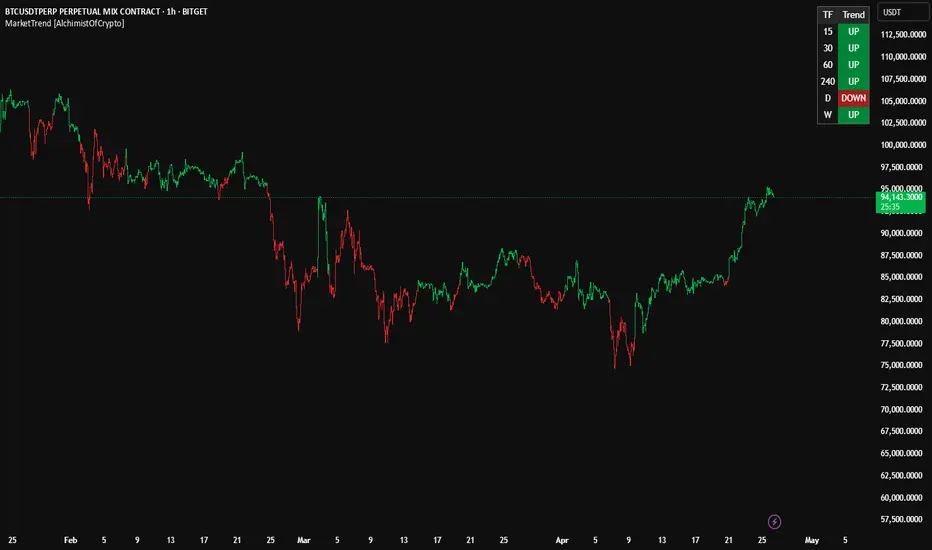
MarketTrend [AlchimistOfCrypto]🌌 MarketTrend – Unveil the Cosmic Harmony of Markets 🌌
"What we call 'trend' is merely an illusion of our limited perception of the space-time continuum of markets. Pivots are points of singularity where potential energy ⚡️ transforms into kinetic energy 🚀. The fourth dimension isn’t just time—it’s the simultaneous awareness of all temporal states. By observing mathematical laws across time scales, we unlock the secrets of the cosmic harmony of markets."
📊 Technical Overview
MarketTrend is a multi-timeframe trend analysis powerhouse 🔥 that tracks market direction across six timeframes simultaneously. It pinpoints pivot points 📍 to classify trends as bullish 🐂, bearish 🐻, or neutral ⚖️, presenting results in a sleek, easy-to-read table.
⚙️ How It Works
- The algorithm scans for pivot highs and pivot lows using a 20-bar lookback period 🔍.
- Bullish Trend 🟢: Price breaks above a previous pivot high.
- Bearish Trend 🔴: Price drops below a previous pivot low.
- Neutral Zone 🟡: Price consolidates until a breakout sparks a new trend.
🚀 How to Use This Indicator
1. Master Multi-Timeframe Analysis 🌍: Spot trend alignment across timeframes for a holistic view.
2. Seek Confluence ✅: Stronger signals emerge when multiple timeframes align.
3. Time Your Entries ⏰: Enter trades when shorter timeframes sync with larger ones for maximum precision.
4. Manage Risk 🛡️: Avoid countertrend trades when timeframes show unified direction.
Midnight (Daily) OpenMidnight (Daily) Open v1.0
Overview
Plots a real‑time horizontal line at the U.S. session “midnight” open (i.e. the daily candle’s open price) on any intraday chart. Optionally displays a label with the exact price, making it easy to see how price reacts to the session open.
Key Benefits
Immediate Context: See at a glance where today’s session began, helping identify support/resistance.
Consistent Reference: Works on any symbol or intraday timeframe.
Customizable Styling: Tweak colors, line thickness, and label appearance to match your chart theme.
Features
Retrieves the daily open via request.security() (Pine v6).
Draws or updates a single horizontal line that extends into the future.
Optional price label on the last bar, with user‑defined text and background colors.
Zero repainting—always shows the true daily open.
