Reference timesThe theory behind this indicator is that sometimes the graph reaches a certain price at at a certain time according to the price it had at the same time and day in any of the previous weeks. If you could easily see what happened a few weeks ago on this day's weekday and half an hour from now, you might theoretically gain more assurance as to where the graph might go in the next half an hour.
This of course relies of the premise that some traders choose to enter or exit positions according to historical times they are referencing. Hence the name - Reference times.
Example:
it is now 08:00 ET Wednesday. I want to guess what the graph will do in the next half hour. I enter in the indicator the weekday "Wednesday", the time "8:30", and go to 30 minute candles.
I will then see all the candles the graph has been on historical Wednesdays at 8:30. If the candles are below the 08:00 price, we might guess that the graph might want to descent. If they are above the graph, we might guess that the graph might ascend.
How it works:
The user defines a weekday and time he wants to inquire on.
The script searches for past weekdays and similar hours.
It marks these bars at their wicks.
The user can also inquire "opposite hours" - 12 hours ahead or earlier.
The user can also inquire "opposite days" - Monday<->Wednesday, Tuesday<->Thursday.
In addition, the User may inquire the previous day of his selected weekday, which will mark the most recent previous day existent.
Side note: The Time zone offset is set for Jerusalem time. and so it may need future adjustment.
send debugging instances if you find any
Thank you
Assaf Fogelman 2025
Indicators and strategies

Weekly Close Positive After Breaking Prior LowClosing positive after breaking prior low on weekly basis
Reference TimesThe theory behind this indicator is that sometime the graph will change its direction at a point that is the point it reached at that weekday on that time in the previous weeks. If you can easily see what happened a few weeks ago on this day's weekday and a half an hour from now, you might theoretically gain more assurance as to where the graph might go in the next half an hour.
This of course relies of the premise that some traders choose to enter or exit positions according to historical times they are referencing. Hence the name - Reference times.
Example:
it is now 08:00 ET Wednesday. I want to guess what the graph will do in half an hour. I enter in the indicator the weekday "Wednesday", the time "8:30", and go to 30 minute candles.
I will then see all the candles the graph has been on historical Wednesdays at 8:30. If the candles are below the 08:00 price, we might guess that the graph might want to descent. If they are above the graph, we would guess the graph might want to ascend.
How it works:
The user defines a weekday and time he wants to inquire on.
The script searches for past weekdays and similar hours.
It marks these bars at their wicks.
The user can also inquire "opposite hours" - 12 hours ahead or earlier.
The user can also inquire "opposite days" - Monday<->Wednesday, Tuesday<->Thursday.
In addition, the User may inquire the previous day of his selected weekday, which will mark the most recent previous day existent.
Side note: The Time zone offset is set for Jerusalem time. and so it may need future adjustment.
send debugging instances if you find any
Thank you
Assaf Fogelman 2025

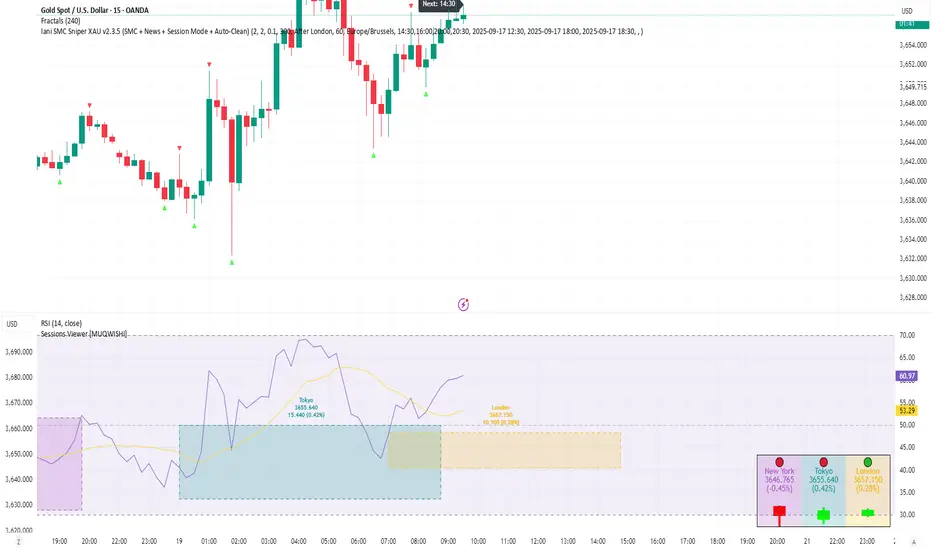
Iani SMC Sniper XAU v2.2 (Long+Short + News Countdown, v6)Iani SMC Sniper XAU (v2.2) — smart-money logic for XAUUSD.
This indicator hunts “sniper entries” using a simple SMC sequence:
Sweep → BOS → 50% FVG entry
• After London session builds its range, we wait for a liquidity sweep (price dips below London Low for longs / wicks above London High for shorts).
• A BOS confirms direction (close breaks the last swing).
• First FVG that prints after BOS gives the entry at 50% (mid-gap).
• SL anchored to the protective swing (with a small safety buffer). TP is plotted using your Risk:Reward.
News countdown (non-blocking):
The script does not auto-fetch news; you set daily times (e.g., 14:30, 16:00) and/or specific dates (“YYYY-MM-DD HH:MM”). A countdown label shows “NEWS in Xm”. Signals are not blocked—this is just a safety heads-up for prop-firm rules.
Inputs: pivot length, RR, pip size (XAU default 0.10), session filter (after London), news times (recurring & absolute), show/hide levels & labels.
Plots & labels: London High/Low (daily), Entry/SL/TP lines, BOS/Sweep/BUY/SELL markers, news badge.
Alerts: BOS Bull/Bear, BUY/SELL Entry touch, TP/SL hit, NEWS WARNING.
Notes:
• Designed for XAUUSD intraday; works on other symbols if you adjust pip size.
• Uses symbol timezone; adjust your news times for DST if needed.
• Indicator only—no orders, no backtest. Manage risk and execution in MT5/your platform.
Changelog (v2.2): Pine v6, robust time parsing, one-line logical expressions (fixed EOL errors), mirrored short logic, cleaner London H/L reset, countdown label.
Disclaimer: Educational tool, not financial advice. Past performance ≠ future results.
Tags: SMC, ICT, XAUUSD, Gold, Liquidity Sweep, BOS, FVG, London Session, News, Intraday, Scalping, DayTrading.
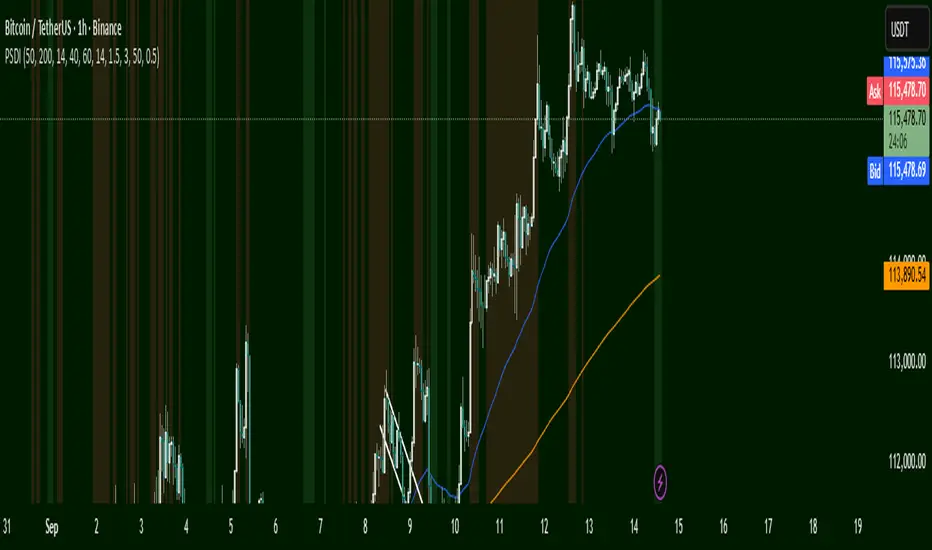
PSDIGreen Zone → Potential Buy Area
Price is near support.
Red Zone → Potential Sell Area
Price is near resistance.
EMA Lines
Blue (EMA50) above Orange (EMA200): Trend up → favors buys.
Blue below Orange: Trend down → favors sells.
How to Use
Look at zones and trend.
Price near green + trend up → consider long.
Price near red + trend down → consider short.
NOTE: When in uptrend, only follow green zones. When in down trend only follow red zones.

Higher High Lower Low Higher High Lower Low 🦉{Phanchai} — TradingView Description
Structure detector with dynamic Support/Resistance, customizable labels, and ready-made alerts (Pine v6).
This script marks market structure turning points — HH (Higher High), HL (Higher Low), LH (Lower High), LL (Lower Low) — and builds segmented Support/Resistance lines from those turns. Labels and colors are fully customizable and the script ships with multiple alert conditions.
What it does
Detects swing pivots using left/right bar windows, then classifies each confirmed swing as HH/HL/LH/LL.
Plots compact labels at the confirmed pivot bars with tooltips (English).
Derives dynamic Support / Resistance : every time structure flips, the previous level is closed and a new segment starts, extending to the right .
Provides alert conditions for any label and for specific first-occurrence shifts (e.g., first HH after a bearish label).
How it works (in short)
A pivot high/low confirms only after Right Bars candles have closed; labels and S/R appear at that confirmation bar.
An internal backbone (zigzag-like) is built from confirmed pivots, with light consistency checks to avoid contradictory sequences.
Structure rules compare the recent five pivots (A…E) to decide HH/HL/LH/LL.
S/R is updated from structure: e.g., in an up leg, new HLs refresh Support; in a down leg, new LHs refresh Resistance.
Alerts included
Any structure label (HH/HL/LH/LL) — Fires on any new label.
First LL after HL/HH — First bearish break after a bullish label.
First HH after LL/LH — First bullish break after a bearish label.
LL or HL formed — Any low-side label.
LH or HH formed — Any high-side label.
HL formed
HH formed
LL formed
LH formed
How to use (quick start)
Add the indicator to your chart.
Choose Left/Right Bars for your timeframe (e.g., 5–10 for intraday; larger for higher timeframes).
Pick your label colors/sizes and S/R style.
Right-click the chart → Add alert… → Condition: this indicator → select the desired alert.
Notes & tips
Because pivots require Right Bars to confirm, labels and S/R appear with a natural delay of that many bars. This avoids repainting.
Raising Left/Right Bars reduces noise and increases the average distance between pivots; lowering them increases sensitivity.
Structure is strict: sometimes you may see two HL (or two LH) in a row if the intermediate opposite swing didn’t qualify as HH/LH (or LL/HL).
S/R segments are drawn with line objects ; they are controlled via Inputs (style/width/color), not the Style tab.
This tool highlights structure; it’s not a standalone entry/exit system. Combine with volume, trend, or risk management rules.
Built with Pine v6. Clean, compact labels; segmented S/R that updates only on confirmed changes; comprehensive alerts ready for automation.

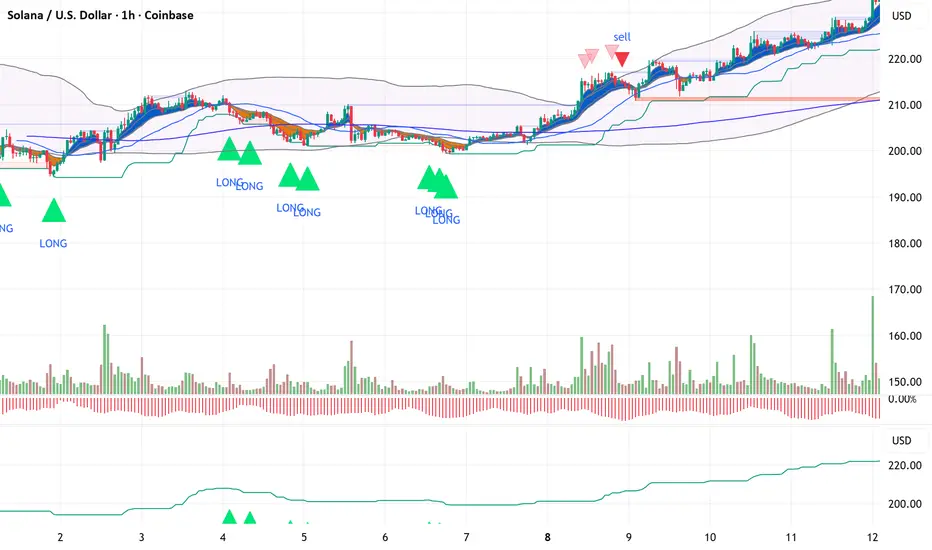
ZigZag++ + 4 EMA89 Trend Candles + BUY/SELL LabelsThis script combines ZigZag patterns, EMA89 trend detection, and custom buy/sell scalp signals. It helps identify trend direction and potential entry points in trending markets.
Features:
- ZigZag structure points
- EMA89 as dynamic trend filter
- Buy/Sell scalp markers
- HL/HH swing labels
- Works best on 15m–4h timeframes

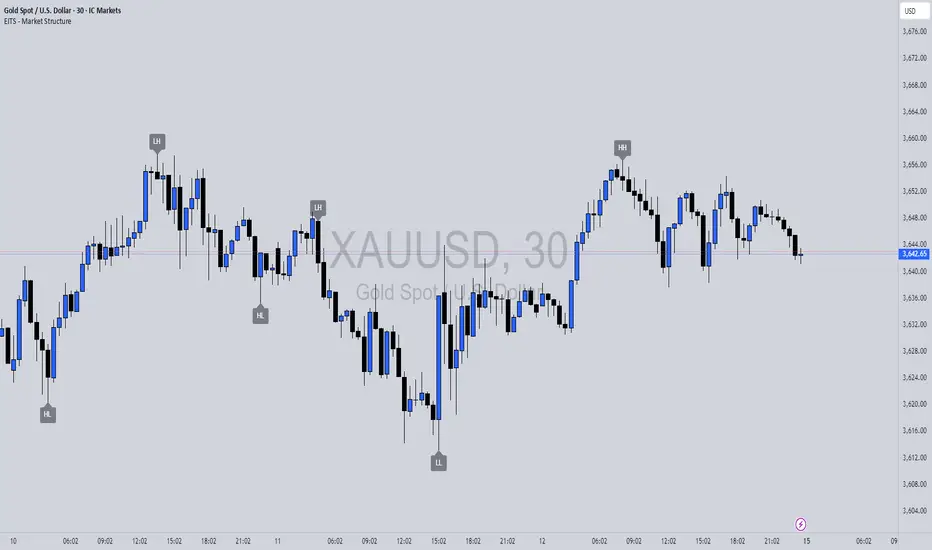
EITS - Market StructureThis script marks the Swing Lows and Highs of a chosen pair. H,HH,L,LL,HL,LH will be marked on chart. Have fun!!
ZigZag++ + 4 EMA89 Trend Candles + BUY/SELL LabelsThis script combines ZigZag patterns, EMA89 trend detection, and custom buy/sell scalp signals. It helps identify trend direction and potential entry points in trending markets.
Features:
- ZigZag structure points
- EMA89 as dynamic trend filter
- Buy/Sell scalp markers
- HL/HH swing labels
- Works best on 15m–4h timeframes

ZigZag+4 EMA89 Trend Candles + BUY/SELL SCALPThis script combines ZigZag patterns, EMA89 trend detection, and custom buy/sell scalp signals. It helps identify trend direction and potential entry points in trending markets.
Features:
- ZigZag structure points
- EMA89 as dynamic trend filter
- Buy/Sell scalp markers
- HL/HH swing labels
- Works best on 15m–4h timeframes

Opening 15-Minute Range This triggers after the third 5-minute bar from the session open
Works on any intraday timeframe (1m, 2m, 5m, etc.).
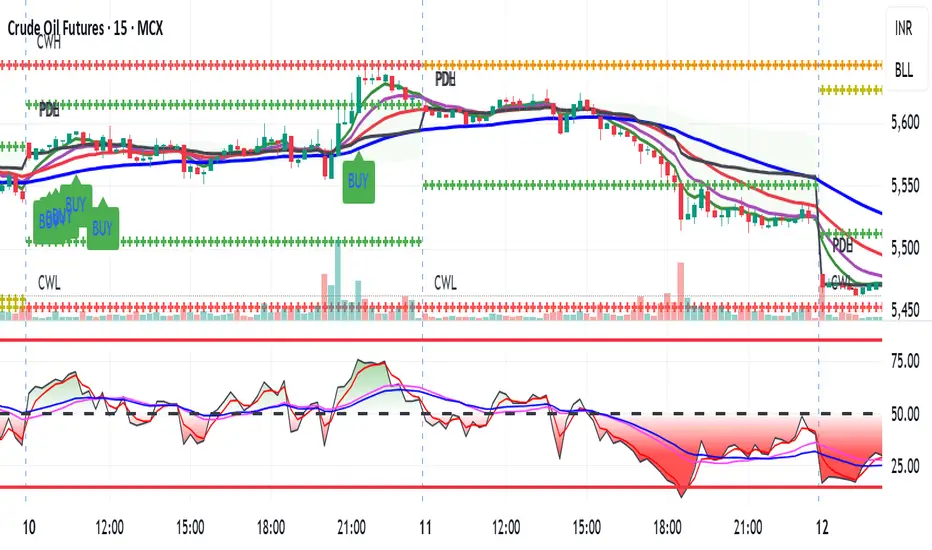
High and Low - MS - 2.0"Showing the high and low points with numbers.
Micha the leftist didn’t say how it’s called in his video.
#LeftismIsAMentalIllness"
נותן לראות את הנקודות הגבוהות והנמוכות עם מספרים
מיכה השמאלן לא אמר איך קוראים לזה בסרטון שלו
#שמאלנותזומחלתנפש
14/09/2025

High and Low - MSShowing the high and low points with numbers.
Micha the leftist didn’t say how it’s called in his video
#LeftismIsAMentalIllness
נותן לראות את הנקודות הגבוהות והנמוכות עם מספרים
מיכה השמאלן לא אמר איך קוראים לזה בסרטון שלו
#שמאלנותזומחלתנפש
Pip distance by Jim Belardi//@version=5
indicator("Pip-Distanz zum Hoch/Tief (EURUSD)", overlay=true)
// Pip-Faktor fix for EURUSD (5 Nachkommastellen, 1 Pip = 0.0001)
pip_factor = 10000.0
// live candle
current_price = close
candle_high = high
candle_low = low
// calculate distance in pips
dist_high_pips = (candle_high - current_price) * pip_factor
dist_low_pips = (current_price - candle_low) * pip_factor
// create table (once)
var table pipTable = table.new(position.bottom_right, 2, 2, border_width=1, frame_color=color.gray)
// updating table
if barstate.islast
table.cell(pipTable, 0, 0, "Distanz zum Hoch", text_color=color.red, text_size=size.large)
table.cell(pipTable, 1, 0, str.tostring(dist_high_pips, format.mintick) + " Pips", text_color=color.red, text_size=size.large)
table.cell(pipTable, 0, 1, "Distanz zum Tief", text_color=color.green, text_size=size.large)
table.cell(pipTable, 1, 1, str.tostring(dist_low_pips, format.mintick) + " Pips", text_color=color.green, text_size=size.large)

SMA Vertical OffsetThis Indicator allow you to adjust the SMA offset vertically instead of horizontally
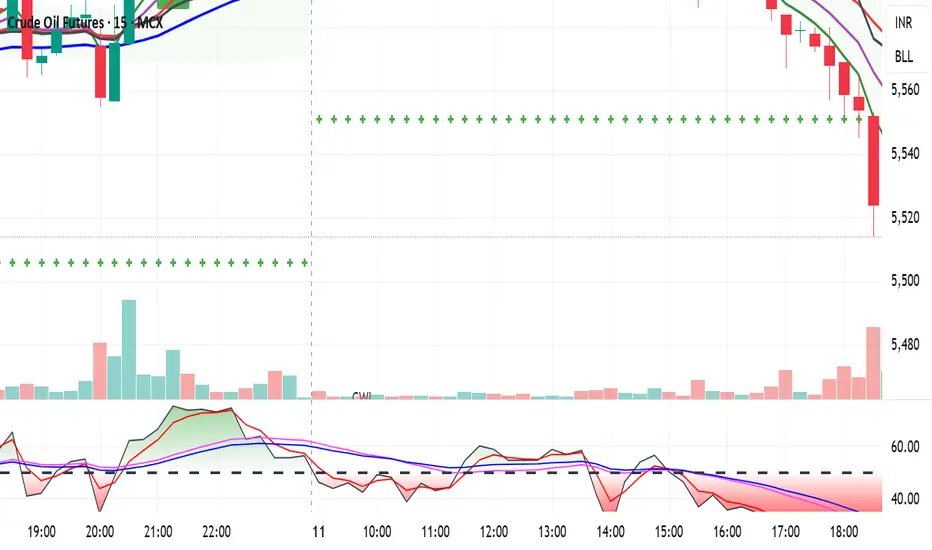
Bullish_Mayank_entry_Indicator with AlertsTHisis abullish indicator using EMA , RSI & Weighte mean average of RSI
Bullish_Mayank_entry_Indicator with AlertsIt is a indicator that uses EMAs , RSI and Weighted Mean Average RSI and multitimeframe analysis
Adaptive RSIFor traders who want more control, the indicator allows customization of RSI length, smoothing type, and Bollinger Band settings, making it adaptable to day trading, swing trading, and even long-term investing.
In short, this is more than just an RSI — it’s a complete momentum toolkit that combines clarity, flexibility, and advanced signal detection in one clean package.