RSI SMA Inflection AlertFor trading a 1-min chart, the alert triggers when the SMA (smooth line) of the RSI turns up (bullish) in the oversold zones and turns down (bearish) in the overbought zones.
This largely fires as trends show weakness and/or divergences are forming in overbought or oversold territory, suggesting a reversal may be near. It acts as confirmation, rather than entering a trade before true divergences/weakness has formed.
It also helps define an extremely clear and tight stop (local high/low) often providing good R:R (very often 2+) even in relatively choppy PA.
Indicators and strategies

Market Matrix ViewThis technical indicator is designed to provide traders with a quick and integrated view of market dynamics by combining several popular indicators into a single tool. It's not a magic bullet, but a practical aid for analyzing buying/selling pressure, trends, volume, and divergences, saving you time in the decision-making process. Built for flexibility, the indicator adapts to various trading styles (scalping, swing, or long-term) and offers customizable settings to suit your needs.
🟡 Multi-Timeframe Trends
➤ This section displays the trend direction (bullish, bearish, or neutral) across 15-minute, 1-hour, 4-hour, and Daily timeframes, providing multi-timeframe market context. Timeframes lower than the one currently selected will show "N/A."
➤It utilizes fast and slow Exponential Moving Averages (EMAs) for each timeframe:
15m: Fast EMA 42, Slow EMA 170
1h: Fast EMA 40, Slow EMA 100
4h: Fast EMA 36, Slow EMA 107
Daily: Fast EMA 20, Slow EMA 60
🟡 Smart Flow & RVOL
➤ This section displays "Buying Pressure" or "Selling Pressure" signals based on indicator confluence, alongside volume activity ("High Activity," "Normal Activity," or "Low Activity").
➤ Smart Flow combines Chaikin Money Flow (CMF) and Money Flow Index (MFI) to detect buying/selling pressure. CMF measures money flow based on price position within the high-low range, while MFI analyzes money flow considering typical price and volume. A signal is generated only when both indicators simultaneously increase/decrease beyond an adjustable threshold ("Buy/Sell Sensitivity") and volume exceeds a Simple Moving Average (SMA) scaled by the "Volume Multiplier."
➤ RVOL (Relative Volume) calculates relative volume separately for bullish and bearish candles, comparing recent volume (fast SMA) with a reference volume (slow SMA). Thresholds are adjusted based on the selected mode.
🟡 ADX & RSI
This section displays trend strength ("Strong," "Moderate," or "Weak"), its direction ("Bullish" or "Bearish"), and the RSI momentum status ("Overbought," "Oversold," "Buy/Sell Momentum," or "Neutral").
➤ ADX (Average Directional Index) measures trend strength (above 40 = "Strong," 20–40 = "Moderate," below 20 = "Weak"). Direction is determined by comparing +DI (upward movement) with -DI (downward movement). Additionally, an arrow indicates whether the trend's strength is decreasing or increasing.
➤RSI (Relative Strength Index) evaluates price momentum. Extreme levels (above 80/85 = "Overbought," below 15/20 = "Oversold") and intermediate zones (47–53 = "Neutral," above 53 = "Buy Momentum," below 47 = "Sell Momentum") are adjusted based on the selected mode.
🟡 When these signals are active for a potential trade setup, the table's background lights up green or red, respectively.
🟡 Volume Spikes
➤This feature highlights bars with significantly higher volume than the recent average, coloring them yellow on the chart to draw attention to intense market activity.
➤It uses the Z-Score method to detect volume anomalies. Current volume is compared to a 10-bar Simple Moving Average (SMA) and the standard deviation of volume over the same period. If the Z-Score exceeds a certain threshold, the bar is marked as a volume spike.
🟡 Divergences (Volume Divergence Detection)
➤ This feature marks divergences between price and technical indicators on the chart, using diamond-shaped labels (green for bullish divergences, red for bearish divergences) to signal potential trend reversals.
➤ It compares price deviations from a Simple Moving Average (SMA) with deviations of three indicators: Chaikin Money Flow (CMF), Money Flow Index (MFI), and On-Balance Volume (OBV). A bullish divergence occurs when price falls below its average, but CMF, MFI, and OBV rise above their averages, indicating hidden accumulation. A bearish divergence occurs when price rises above its average, but CMF, MFI, and OBV fall, suggesting distribution. The length of the moving averages is adjustable (default 13/10/5 bars for Scalping/Balanced/Swing), and detection thresholds are scaled by "Divergence Sensitivity" (default 1.0).
🟡 Adaptive Stop-Loss (ATR)
➤Draws dynamic stop-loss lines (red, dashed) on the chart for buy or sell signals, helping traders manage risk.Uses the Average True Range (ATR) to calculate stop-loss levels, set at low/high ± ATR × multiplier
🟡 Alerts for trend direction changes in the Info Panel:
➤ Triggers notifications when the trend shifts to Bullish (when +DI crosses above -DI) or Bearish (when +DI crosses below -DI), helping you stay informed about key market shifts.
How to use: Set alerts in Trading View for “Trend Changed to Bullish” or “Trend Changed to Bearish” with “Once Per Bar Close” for reliable signals.
🟡 Settings (Inputs)
➤ The indicator offers customizable settings to fit your trading style, but it's already optimized for Scalping (1m–15m), Balanced (16m–3h59m), and Swing (4h–Daily) modes, which automatically adjust based on the selected timeframe. The visible inputs allow you to adjust the following parameters:
Show Info Panel: Enables/disables the information panel (default: enabled).
Show Volume Spikes: Turns on/off coloring for volume spike bars (default: enabled).
Spike Sensitivity: Controls the Z-Score threshold for detecting volume spikes (default: 2.0; lower values increase signal frequency).
Show Divergence: Enables/disables the display of divergence labels (default: enabled).
Divergence Sensitivity: Adjusts the thresholds for divergence detection (default: 1.0; higher values reduce sensitivity).
Divergence Lookback Length: Sets the length of the moving averages used for divergences (default: 5, automatically adjusted to 13/10/5 for Scalping/Balanced/Swing).
RVOL Reference Period: Defines the reference period for relative volume (default: 20, automatically adjusted to 7/15/20).
RSI Length: Sets the RSI length (default: 14, automatically adjusted to 5/10/14).
Buy Sensitivity: Controls the increase threshold for Buying Pressure signals (default: 0.007; higher values reduce frequency).
Sell Sensitivity: Controls the decrease threshold for Selling Pressure signals (default: 0.007; higher values reduce frequency).
Volume Multiplier (B/S Pressure): Adjusts the volume threshold for Smart Flow signals (default: 0.6; higher values require greater volume).
🟡 This indicator is created to simplify market analysis, but I am not a professional in Pine Script or technical indicators. This indicator is not a standalone solution. For optimal results, it must be integrated into a well-defined trading strategy that includes risk management and other confirmations.

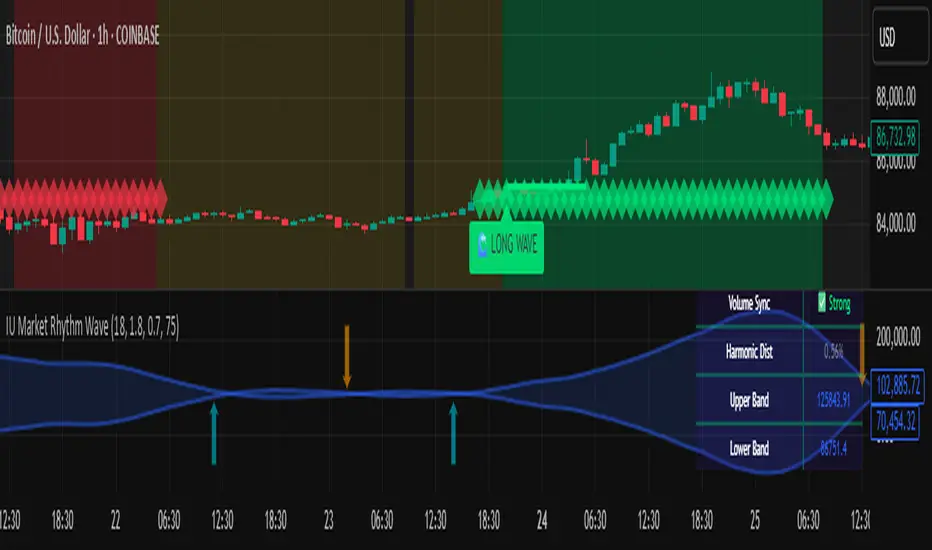
IU Market Rhythm WaveDESCRIPTION:
The IU Market Rhythm Wave is a multi-dimensional indicator designed to reveal the underlying rhythm and energy of the market. By analyzing price momentum, harmonic oscillations, volume behavior, and market breadth, it helps traders identify high-quality long and short wave signals. It also visualizes rhythm bands, wave strength zones, and harmonic levels to provide comprehensive context for decision-making.
This tool is best used on trending instruments where rhythm cycles and volume patterns create clear wave-based opportunities.
USER INPUTS:
Rhythm Cycle Length
Controls the main lookback period used to calculate price waves, harmonic oscillation, volume rhythm, and breath. A longer cycle smooths signals, while a shorter cycle makes them more responsive. Recommended range: 8 to 35.
Wave Signal Strength
Multiplies the standard deviation of rhythm to define dynamic breakout thresholds. A higher value results in fewer but stronger signals, filtering out minor fluctuations.
Harmonic Filter
Applies a sensitivity filter to the harmonic mean and standard deviation. It helps eliminate weak or noisy signals and ensures rhythm-based signals align with harmonic structure.
Show Wave Energy Zones
Toggles background color shading based on current rhythm conditions. Greenish zones indicate strong upward rhythm, red for strong downward rhythm, yellow for positive bias, and gray for weak or neutral zones.
Show Rhythm Bands
Enables the display of upper and lower rhythm bands derived from ATR and rhythm volatility. These bands act as dynamic price envelopes and potential support/resistance zones.
Wave Zone Opacity
Adjusts the transparency of background energy zones, allowing users to control how prominent these zones appear on the chart. Range: 60 to 90 for optimal visibility.
INDICATOR LOGIC:
The indicator combines multiple rhythmic components into a composite rhythm score:
1. Price Wave – Based on momentum (rate of price change) smoothed by a moving average.
2. Harmonic Oscillation – Measures how far price has deviated from a central harmonic average (HLC3).
3. Volume Rhythm – Uses volume’s deviation from its mean, standardized by its volatility.
4. Market Breath – Captures range expansion and closing strength relative to range.
These elements form the Raw Rhythm, which is further smoothed to produce the Market Rhythm. When the rhythm exceeds statistically calculated thresholds and other conditions like volume confirmation and harmonic proximity are met, wave signals are triggered.
Harmonic Fibonacci levels (0.236, 0.382, 0.618, 0.764) are also calculated every rhythm cycle to identify nearby structural price zones. Signals occurring near these levels are considered more reliable.
The Rhythm Bands use ATR and rhythm strength to define dynamic boundaries above and below price. Visual zones and arrows mark rhythm shifts and highlight the underlying energy of the market.
WHY IT IS UNIQUE:
This indicator goes beyond traditional oscillators or volume indicators by blending multiple market dimensions into one rhythmic framework. It adapts to volatility, applies harmonic structure awareness, and filters signals based on real-time market conditions. It offers:
* A unique rhythm-based view of price, volume, and volatility
* Dynamic, adaptive signal generation and zone coloring
* Visual analytics and contextual data in a summary table
* Signal filtering using harmonic alignment and market breath
Its real-time responsiveness and multi-layered logic make it suitable for intraday, swing, and positional traders.
HOW USER CAN BENEFIT FROM IT:
* Spot high-conviction long or short entries when rhythm, volume, and structure align
* Avoid low-quality trades during weak or noisy rhythm periods
* Use visual wave zones to gauge trend strength and rhythm direction
* Monitor harmonic proximity to enter or exit near key structural levels
* Apply rhythm bands for dynamic stop-loss and target setting
* Use rhythm direction arrows and analytics table to gain deeper market insight
DISCLAIMER:
This indicator is created for educational and informational purposes only. It does not constitute financial advice or a recommendation to buy or sell any asset. All trading involves risk, and users should conduct their own analysis or consult with a qualified financial advisor before making any trading decisions. The creator is not responsible for any losses incurred through the use of this tool. Use at your own discretion.
GOLD Strategy + 押し目買い戻り売り + ATRベースSLTPThank you for viewing.
This script is exclusively for the GOLD currency pair.
For usage instructions, please contact me via LINE.

JEYOUNG MADE20일선 위로올라갈때 매수표시 20일선 아래로내려갈때 매도 표시 5일 20일 120일 200일선 포함됨
("Show a buy signal when the price moves above the 20-day moving average, and a sell signal when it falls below the 20-day moving average. Include the 5-day, 20-day, 120-day, and 200-day moving averages."
Let me know if you want this formatted for a trading script or chart annotation as well.)

ORB Breakout Indicator - NQ1!The purpose of this indicator is to assist traders in rapidly identifying high-probability Opening Range Breakout (ORB) setups on the NQ1! 1-minute time frame (Nasdaq Futures)
Key Features:
Opening Range: Automatically plots the high and low of the 1st 15min of the (NYSE session) (09:30–09:45 EST)
Breakout Signals : Illustrates the first candle that breaks upward or downward and:
Green arrow for a bullish breakout
Red arrow for a bearish breakout
Clean Visuals: Dynamic lines show the high and low of the ORB window for easy reference.
(DON'T USE THIS ONLY FOR ENTRY SIGNALS, PAIR THIS WITH OTHER INFLUENCES TO GET HIGH PROBABILITY BREAKOUTS)
Luma DCA Simulator (BTC only)Luma DCA Simulator – Guide
What is the Luma DCA Simulator?
The Luma DCA Tracker shows how regular Bitcoin investments (Dollar Cost Averaging) would have developed over a freely selectable period – directly in the chart, transparent and easy to follow.
Settings Overview
1. Investment amount per interval
Specifies how much capital is invested at each purchase (e.g. 100).
2. Start date
Defines the point in time from which the simulation begins – e.g. 01.01.2020.
3. Investment interval
Determines how frequently investments are made:
– Daily
– Weekly
– Every 14 days
– Monthly
4. Language
Switches the info box display between English and German.
5. Show investment data (optional)
If activated, the chart will display additional values such as total invested capital, BTC amount, current value, and profit/loss.
What the Chart Displays
Entry points: Each DCA purchase is marked as a point in the price chart.
Average entry price: An orange line visualizes the evolving DCA average.
Info box (bottom left) with a live summary of:
– Total invested capital
– Total BTC acquired
– Average entry price
– Current portfolio value
– Profit/loss in absolute terms and percentage
Note on Accuracy
This simulation is for illustrative purposes only.
Spreads, slippage, fees, and tax effects are not included.
Actual results may vary.
Technical Note
For daily or weekly intervals, the chart timeframe should be set to 1 day or lower to ensure all purchases are accurately included.
Larger timeframes (e.g. weekly or monthly charts) may result in missed investments.
Currency Handling
All calculations are based on the selected chart symbol (e.g. BTCUSD, BTCEUR, BTCUSDT).
The displayed currency is automatically determined by the chart used.

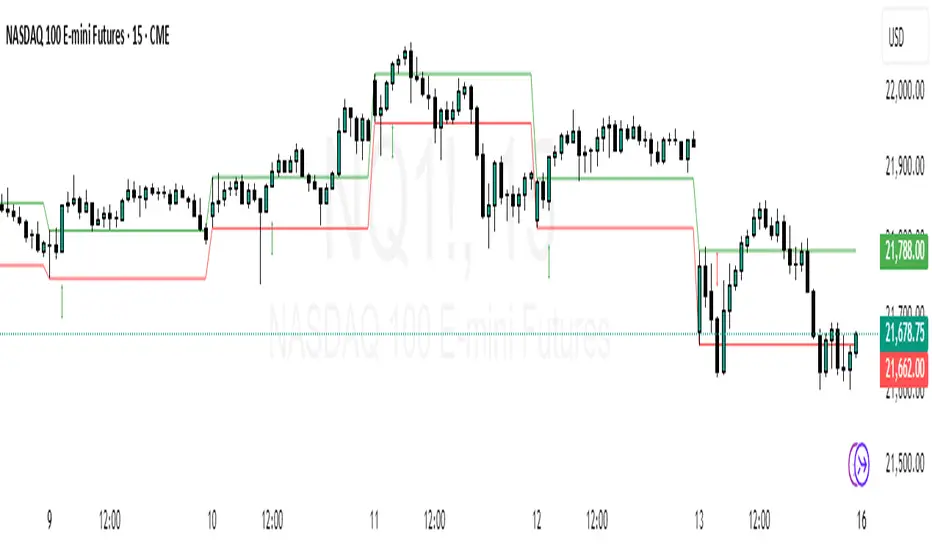
Last 2 Days Key LevelsLast 2 Days Key Levels
Overview
This indicator is designed for intraday traders who leverage key historical price levels to identify potential support and resistance zones. It cleanly plots the most important levels from the previous two trading days, giving you a clear map of the price action and helping you anticipate potential turning points in the market.
The core principle is that the market has memory. The highs, lows, and calculated pivot points from previous sessions often remain significant and can act as powerful magnets or barriers for price in the current session. This script gives you a configurable and visually clean way to track these critical zones.
Key Features
Multi-Day Level Plotting: Display key levels not just from the prior day (PD), but also from two days ago (PD2), allowing you to track a deeper level of market structure.
Comprehensive Key Levels: For each historical day, the indicator plots:
High
Low
Mid-Point (the direct halfway point of the day's range)
Central Pivot Point (the average of the high, low, and close)
Premarket High/Low: Includes the high and low from the current day's premarket session, which are critical levels for morning trading.
Full Customization: Every level is fully configurable. Through a cleanly organized input menu, you can:
Toggle the visibility of each individual line (e.g., show only the highs and lows).
Customize the color, line style (solid, dotted, dashed), and thickness for each group of levels (Prior Day, 2-Day Prior, Premarket).
The Strategic Advantage: Why Track 2-Day Prior Levels?
While many traders focus exclusively on the previous day's levels, tracking the levels from two days ago provides a distinct strategic edge, especially in the early morning session.
In the opening minutes of trading, or even in the premarket, price action is often volatile and searching for direction. The market will frequently test not just yesterday's levels, but also the key zones from the day before. These "older" levels are often overlooked by other market participants, making them powerful hidden support and resistance zones.
By having the 2-day prior levels on your chart, you can:
Anticipate early session turning points that others might not see.
Identify stronger confirmation when a 2-day level aligns with a prior-day or premarket level.
Avoid being caught off guard by reactions to seemingly "random" price points that are, in fact, significant historical levels.
How to Use
Support & Resistance: Use the plotted lines as potential areas where price may bounce or reverse. Look for price to respect these levels for potential entry or exit signals.
Breakout & Breakdown Zones: A clean break and hold above a resistance level (or below a support level) can signal the start of a new directional move.
Targeting: The levels can serve as logical price targets for your trades.
All settings are organized into clear groups in the "Inputs" tab, allowing you to easily configure the indicator to your exact preferences.
This script is based on the foundational concepts of the 'Daily Levels Suite' by FourC. It was generated and optimized with Gemini, by Mercadero.AI.

Clean Volume-Based Entry StrategyAYUBURI Volume Indictor
CME_MINI:MNQ1!
is shows when there is quality volume accumulating in the current asset you are actively trading.


Pivot Points StandardThis is an indicator that has multiple EMAs and pivot points and RSI table. It will help to trade better. ShubhTrades


EMA Confluence Oscillator📌 EMA Confluence Oscillator + Signal
This oscillator helps detect ranging vs trending conditions by measuring EMA alignment, slope, and choppiness. It’s designed for traders who want to avoid chop and trade in clean directional moves.
⸻
🔍 How It Works:
• Uses 3 EMAs (Fast, Medium, Slow) to assess market structure
• Measures how flat the slow EMA is (low slope = range)
• Detects short-term momentum flips in fast/medium EMAs
• Calculates EMA spread to find tight, choppy zones
• Combines all signals into a Range Score (0–1 scale)
⸻
🧠 How to Use:
• High Range Score (near 1): Market likely ranging
• Low Range Score (near 0): More directional/trending
• Watch for crosses below the range threshold to spot trend breakouts
• Optional Signal Line helps smooth decision points
⸻
⚙️ Features:
• Custom lengths for 3 EMAs
• Adjustable slope and convergence thresholds
• Toggle smoothing and signal line
• Background highlight when market is likely in a range
• Clean layout designed for fast intraday analysis
⸻
🛠️ Input Settings Explained:
• Fast/Medium/Slow EMA: Controls trend detection windows
• Slope Lookback: Period used to assess flatness of slow EMA
• Convergence Threshold: How close EMAs must be to count as “tight”
• Smooth Output: Reduces noise in final Range Score
• Signal Line: Smoothed version of the score for easier reading
• Range Threshold: Level where choppiness is likely
• Show Background: Highlights range zones visually

Top Right Watermark# TopRight Watermark
**Finally, a watermark that stays out of your way!**
Tired of TradingView's default watermark blocking your price action and technical analysis? This customizable watermark indicator gives you complete control over positioning and content display.
## 🎯 Key Features
**✅ Flexible Positioning** - Place anywhere: corners, sides, or edges
**✅ Multi-Slot Display** - Up to 3 customizable information slots
**✅ Individual Font Control** - Different sizes for each slot
**✅ Platform Compatibility** - TradingView OR MetaTrader timeframe formats
**✅ Clean & Professional** - Customizable colors and transparency
## 🔧 What You Can Display
- **Timeframe** - Current chart period
- **Ticker** - Symbol name (smart formatting for crypto/forex)
- **Exchange** - Broker/platform name
- **Custom Text** - Your own message
- **Empty** - Hide unused slots
## 🎨 Customization Options
- **Position**: 9 placement options (top/middle/bottom + left/center/right)
- **Colors**: Full color picker with transparency control
- **Font Sizes**: 5 sizes available per slot (tiny to huge)
- **Timeframe Style**: Choose TradingView (1m, 4H) or MetaTrader (M1, H4) format
## 🚀 Perfect For
- Traders who need clean chart visibility
- Multi-timeframe analysis
- Professional chart screenshots
- Platform migrants (MT4/MT5 to TradingView)
- Anyone wanting organized chart information
## 💡 Pro Tips
- Place in corners to avoid price action interference
- Combine Exchange + Ticker + Timeframe for complete context
- Use transparency to make it subtle but visible
**Stop letting watermarks interfere with your trading analysis. Take control of your chart display today!**
---
*Compatible with all TradingView chart types and timeframes. Easy setup with intuitive controls.*

Gap + Open & Close Price Marker (HK)Designed for HK Market :
- Show Previous Day Session Open + Close
- Show Gap Up / Gap Down
- Show Gap in points
- Customizable Gap Threshold
Default Color Setting :
Small Gap Up -> Cyan
Middle Gap Up -> Green
Small Gap Down -> Purple
Middle Gap Down -> Pale Red
Big Gap Up/Down => Yellow

Custom Stochastic with Entry Dots & BackgroundCustom Stochastic with Entry Dots & Background
จะแสดงค่าเมื่อ STOCH OVB OVS ให้แห็นง่ายและชัดเจนขึ้น

G-AreaKujyo original ver 2025
2025年最新版のインジケーター
各時間足の上昇下降トレンドをより可視性の高いものにしています
■緑のエリアは上昇傾向
■赤のエリアは下降傾向
・緑→赤
・赤→緑
に切り割るエリアは、非常に強い反発点
2025 Latest Version Indicator
This indicator provides enhanced visibility of uptrends and downtrends across multiple timeframes.
■ Green areas indicate an upward trend
■ Red areas indicate a downward trend
Transitions between colors:
Green → Red
Red → Green
These transition zones often mark strong reversal points.


Watermark by HAZEDEnhanced Watermark - Clean Chart Labeling
A professional watermark indicator for traders who want clean, customizable chart identification.
Features:
- Show/hide: Exchange prefix, timeframe, price change %, volume
- 9 positioning options - place anywhere on your chart
- Custom text styling - normal or spaced text modes
- Full color control - including transparency settings
- Size customization - independent sizing for each element
- Personal signature - add your trading brand
- Custom symbols - personalize arrows and indicators
Perfect for:
Content creators, educational posts, professional setups, and social media sharing.
Easy to use: Works immediately with smart defaults. Fully customizable to match your style.
Clean charts, professional presentation.

EMA Curl Strength📌 EMA Curl Strength
EMA Curl Strength is a trend momentum oscillator based on the slope of an EMA, normalized using Z-scores. It helps identify when a market is trending vs. ranging, and how strong the current momentum is.
⸻
🔍 How it works:
• Measures the slope of an EMA and standardizes it with Z-scores.
• Smooths the result and compares it to a signal line.
• The histogram shows the difference between the two.
• Color-coded lines represent mild, moderate, and strong trend strength.
⸻
🧠 How to use it:
• Watch for crosses of the zero line as possible trade signals.
• Use bright green/red for strong trends, gray/faint tones for weak or ranging conditions.
• Best used with other indicators (like RSI, moving averages, or price action) for trade confirmation.
⸻
⚙️ Key Features:
• Adjustable EMA, smoothing, and histogram settings
• Custom Z-score thresholds for trend strength
• Toggleable threshold lines (mild, moderate, strong)
• Optional zero-cross dots and color gradient fill
• All colors and styles customizable
⸻
🛠️ Input Overview:
• EMA Length: Speed of trend detection
• Smoothing Lengths: Control signal smoothness
• Z Lookback: Sensitivity to slope changes
• Histogram Settings: Affect shape and signal of histogram
• Gradient Opacity: Controls background color fill strength
• Toggle Lines & Dots: Show/hide elements like threshold lines or cross markers

Adaptive Multi-MA OptimizerAdaptive Multi-MA Optimizer
This indicator provides a powerful, customizable solution for traders seeking dynamically optimized moving averages with precision and control. It integrates multiple custom-built moving average types, applies real-time volatility-based optimization, and includes an optional composite smoothing engine.
🧠 Key Features
Dynamic Optimization:
Automatically selects the optimal lookback length based on market volatility stability using a custom standard deviation differential model.
Multiple Custom MA Types:
Includes fully custom implementations of:
SMA (Simple Moving Average)
EMA (Exponential Moving Average)
WMA (Weighted Moving Average)
VWMA (Volume Weighted MA)
DEMA (Double EMA)
TEMA (Triple EMA)
Hull MA
ALMA (Arnaud Legoux MA)
Composite MA Option:
A unique "Composite" mode blends all supported MAs into a single average, then applies optional smoothing for enhanced signal clarity.
Dynamic Smoothing:
The composite mode supports volatility-adjusted smoothing (based on optimized lookback), making it adaptable to different market regimes.
Fully Custom Logic:
No built-in MA functions are used — every moving average is hand-coded for transparency and educational value.
⚙️ How It Works
Optimization:
The script evaluates a range of lengths (minLen to maxLen) using the standard deviation of price returns. It selects the length with the most stable recent volatility profile.
Calculation:
The selected MA type is calculated using that optimized length. If "Composite" is chosen, all MA types are averaged and smoothed dynamically.
Visualization:
The adaptive MA is plotted on the chart, changing color based on its position relative to price.
📌 Use Cases
Trend-following strategies that adapt to different market conditions.
Traders wanting a high-fidelity composite of multiple MAs.
Analysts interested in visualizing market smoothness without lag-heavy signals.
Coders looking to learn how to build custom indicators from scratch.
🧪 Inputs
MA Type: Choose from 8 MA types or a blended Composite.
Lookback Range: Control min/max and step size for optimization.
Source: Choose any price series (e.g., close, hl2).
⚠️ Disclaimer
This indicator is for educational and informational purposes only and does not constitute financial advice, trading advice, or investment recommendations. Use of this script is at your own risk. Past performance does not guarantee future results. Always perform your own analysis and consult with a qualified financial advisor before making trading decisions.

📅 Non-Euclidean Fib Gibbonaci📅 *Non-Euclidean Fib Gibbonaci**
This indicator dynamically identifies high-probability liquidity zones using a combination of **weekly market structure**, **asymmetric Fibonacci geometry**, and **volume clustering**.
### 🔍 **What It Does:**
* **Detects Weekly Structure Shifts:**
Automatically checks each new week for a break in weekly highs or lows. If a structural change is detected, all liquidity levels are recalculated.
* **Builds Non-Euclidean Fibonacci Ranges:**
Instead of traditional swing-based Fibs, this indicator creates a **distorted Fibonacci zone** around the weekly close using the Golden Ratio (φ ≈ 1.618). This generates asymmetric, forward-projected Fib levels.
* **Volume-Based Liquidity Zones:**
For each projected level, volume is accumulated from the past 50 bars when the price closed near that level. These volumes are then **tiered dynamically based on the previous week’s total volume**.
* **5 Dynamic Volume Tiers:**
Liquidity levels are color-coded based on volume interaction:
* 🔴 **Very High**
* 🟠 **High**
* 🟡 **Mid**
* 🔵 **Low**
* ⚪ **Very Low**
(Thresholds are based on **percentage of last week’s volume**, fully adjustable via settings.)
* **Smart Drawing Engine:**
* Only draws when structure changes.
* Includes inverse bands (bottom-up projections), midlines (optional), and clean auto-clearing of old levels.
* Optional labels show Fib level and volume tier.
* **Predictive Liquidity Zones:**
High-volume extension levels (e.g. Fib 1.272 or above) trigger **"🔺 Potential Top"** and **"🔻 Potential Bottom"** labels, helping to forecast potential exhaustion zones.
---
### ⚙️ **Customizable Settings:**
* Enable/disable:
* Inverse Fibonacci bands
* Midlines between bands
* Volume-based labels
* Adjust:
* Volume tier thresholds (% of prior weekly volume)
* Label display filtering (only show top tiers)
---
### ✅ **Best Used For:**
* Traders who want to identify **key liquidity zones** based on structural shifts.
* Spotting **volume-backed Fib confluences** that may act as magnets or reversal zones.
* Forecasting **potential tops/bottoms** using historical price/volume behavior — dynamically, and in context.
---
### 🚫 No Repainting:
Once weekly structure is established, levels do not repaint. Volume clustering is based on actual historic bar closes.
---
Let me know if you want a shorter version or a version with emojis minimized for a more formal audience.

Yelober - Intraday ETF Dashboard# How to Read the Yelober Intraday ETF Dashboard
The Intraday ETF Dashboard provides a powerful at-a-glance view of sector performance and trading opportunities. Here's how to interpret and use the information:
## Basic Dashboard Reading
### Color-Coding System
- **Green values**: Positive performance or bullish signals
- **Red values**: Negative performance or bearish signals
- **Symbol colors**: Green = buy signal, Red = sell signal, Gray = neutral
### Example 1: Identifying Strong Sectors
If you see XLF (Financials) with:
- Day % showing +2.65% (green background)
- Symbol in green color
- RSI of 58 (not overbought)
**Interpretation**: Financial sector is showing strength and momentum without being overextended. Consider long positions in top financial stocks like JPM or BAC.
### Example 2: Spotting Weakness
If you see XLK (Technology) with:
- Day % showing -1.20% (red background)
- Week % showing -3.50% (red background)
- Symbol in red color
- RSI of 35 (approaching oversold)
**Interpretation**: Technology sector is showing weakness across multiple timeframes. Consider avoiding tech stocks or taking short positions in names like MSFT or AAPL, but be cautious as the low RSI suggests a bounce may be coming.
## Advanced Interpretations
### Example 3: Sector Rotation Detection
If you observe:
- XLE (Energy) showing +2.10% while XLK (Technology) showing -1.50%
- Both sectors' Week % values showing the opposite trend
**Interpretation**: This suggests money is rotating out of technology into energy stocks. This rotation pattern is actionable - consider reducing tech exposure and increasing energy positions (look at XOM, CVX in the Top Stocks column).
### Example 4: RSI Divergences
If you see XLU (Utilities) with:
- Day % showing +0.50% (small positive)
- RSI showing 72 (overbought, red background)
**Interpretation**: Despite positive performance, the high RSI suggests the sector is overextended. This divergence between price and indicator suggests caution - the rally in utilities may be running out of steam.
### Example 5: Relative Strength in Weak Markets
If SPY shows -1.20% but XLP (Consumer Staples) shows +0.30%:
**Interpretation**: Consumer staples are showing defensive strength during market weakness. This is typical risk-off behavior. Consider defensive positions in stocks like PG, KO, or PEP for protection.
## Practical Application Scenarios
### Day Trading Setup
1. **Morning Market Assessment**:
- Check which sectors are green pre-market
- Focus on sectors with Day % > 1% and RSI between 40-70
- Identify 2-3 stocks from the Top Stocks column of the strongest sector
2. **Midday Reversal Hunting**:
- Look for sectors with symbol color changing from red to green
- Confirm with RSI moving away from extremes
- Trade stocks from that sector showing similar pattern changes
### Swing Trading Application
1. **Trend Following**:
- Identify sectors with positive Day % and Week %
- Look for RSI values in uptrend but not overbought (45-65)
- Enter positions in top stocks from these sectors, using daily charts for confirmation
2. **Contrarian Setups**:
- Find sectors with deeply negative Day % but RSI < 30
- Look for divergence (price making new lows but RSI rising)
- Consider counter-trend positions in the stronger stocks within these oversold sectors
## Reading Special Conditions
### Example 6: Risk-Off Environment
If you observe:
- XLP (Consumer Staples) and XLU (Utilities) both green
- XLK (Technology) and XLY (Consumer Disc) both red
- SPY slightly negative
**Interpretation**: Classic risk-off rotation. Investors are moving to safety. Consider defensive positioning and reducing exposure to growth sectors.
### Example 7: Market Breadth Analysis
Count the number of sectors in green vs. red:
- If 7+ sectors are green: Strong bullish breadth, consider aggressive long positioning
- If 7+ sectors are red: Weak market breadth, consider defensive positioning or shorts
- If evenly split: Market is indecisive, focus on specific sector strength instead of broad market exposure
Remember that this dashboard is most effective when combined with broader market analysis and appropriate risk management strategies.
