Chartlense Dashboard (Data, Trend & Levels)Chartlense Dashboard (Data, Trend & Levels)
Overview
This dashboard is designed to solve two common problems for traders: chart clutter and the manual drawing of support and resistance levels . It consolidates critical data from multiple indicators into a clean table overlay and automatically plots the most relevant S&R levels based on recent price action. The primary goal is to provide a clear, at-a-glance overview of the market's structure and data.
It offers both a vertical and horizontal layout to fit any trader's workspace.
Key Concepts & Calculations Explained
This indicator is more than a simple collection of values; it synthesizes data to provide unique insights. Here’s a conceptual look at how its core components work:
Automatic Support & Resistance (Pivot-Based):
The dashed support (green) and resistance (red) lines are not manually drawn. They are dynamically calculated based on the most recent confirmed pivot highs and pivot lows . A pivot is a foundational concept in technical analysis that identifies potential turning points in price action.
How it works: A pivot high is a candle whose `high` is higher than a specific number of candles to its left and right (the "Pivot Lookback" is set to 5 by default in the settings). A pivot low is the inverse. By automatically identifying these confirmed structural points, the script visualizes the most relevant levels of potential supply and demand on the chart.
Relative Volume (RVOL):
This value in the table is not the standard volume. It measures the current bar's volume against its recent average (specifically, `current volume / 10-period simple moving average of volume`).
Interpretation: A reading above 2.0 (indicated by green text) suggests that the current volume is more than double the recent average. This technique is used to identify significant volume spikes, which can add conviction to breakouts or signal potential market climaxes.
Consolidated Data for Context:
Other values displayed in the table, such as the EMAs (9, 20, 200) , Bollinger Bands (20, 2) , RSI (14) , MACD (12, 26, 9) , and VWAP (on intraday charts), use their standard industry calculations. They are included to provide a complete contextual picture without needing to load each indicator separately, saving valuable chart space.
How to Use This in Your Trading
This dashboard is designed as a tool for confluence and context , not as a standalone signal generator. Here are some ways to integrate it into your analysis workflow:
As a Trend Filter: Before considering a trade, quickly glance at the EMAs and the MACD values in the table. A price above the key EMAs and a positive MACD can serve as a quick confirmation that you are aligned with the dominant trend.
To Validate Breakouts: When the price is approaching a key Resistance level (red pivot line), watch the RVOL value . A reading above 2.0 on the breakout candle adds significant confirmation that the move is backed by strong interest. The same logic applies to breakdowns below a support level.
To Spot Potential Reversals: Confluence is key. For example, if the price is testing a Support level (green pivot line) AND the RSI in the table is approaching oversold levels (e.g., near 30), it can signal a higher probability reversal setup.
About This Indicator
This indicator was developed by the team at ChartLense to help traders declutter their charts and focus on the data that matters. We believe in making complex analysis more accessible and organized. We hope this free tool is a valuable addition to your trading process.
Indicators and strategies

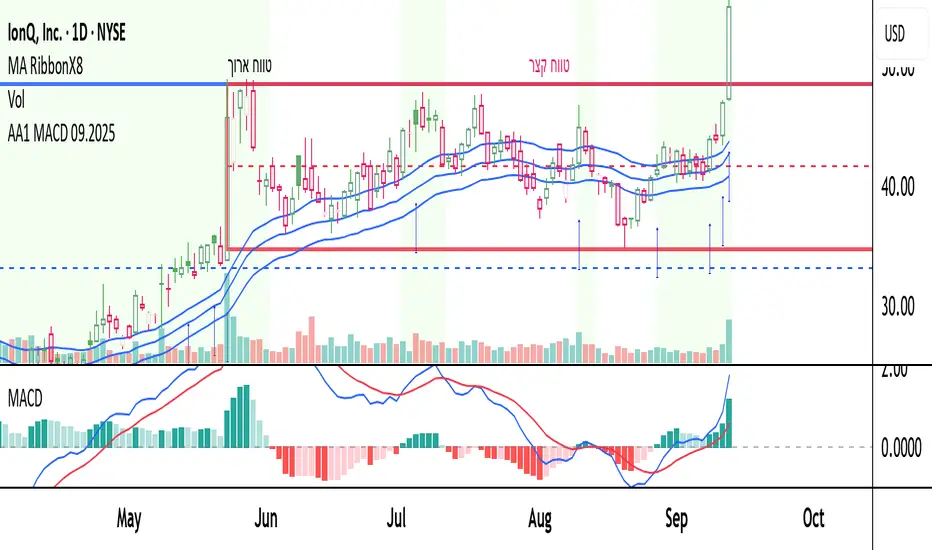
AA1 MACD 09.2025this is a learing project i want to share
the script is open for anyone
I combain some ema's mcad and more indicators to help find stocks in momentum
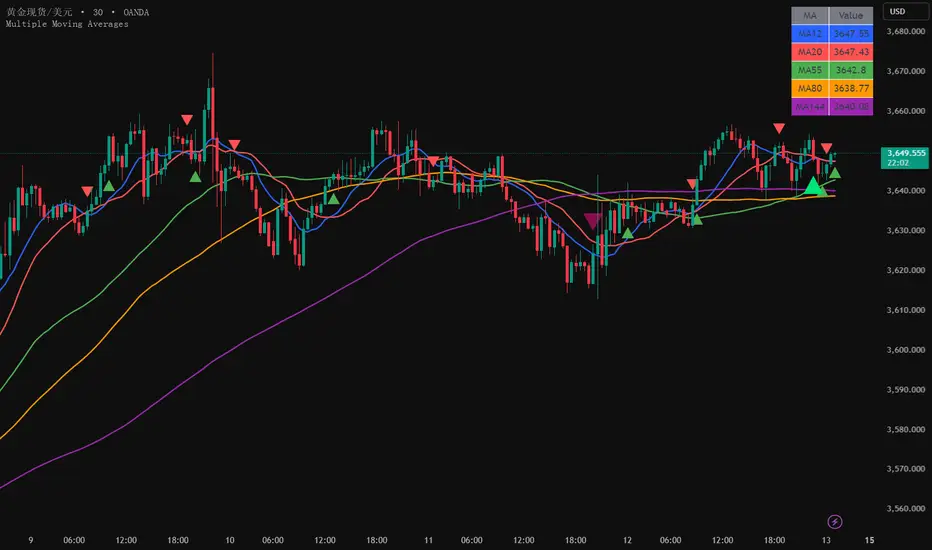
Multiple Moving Averages5 Simple Moving Averages: 12, 20, 55, 80, 144 periods
Different colors: Each moving average uses a different color for easy distinction
Crossover signals: Display crossover signals for MA12/MA20 and MA55/MA144
Value display: Show current specific values of each moving average in a table at the top right corner
Optional EMA: The commented section provides code for the EMA version, which can be uncommented if needed
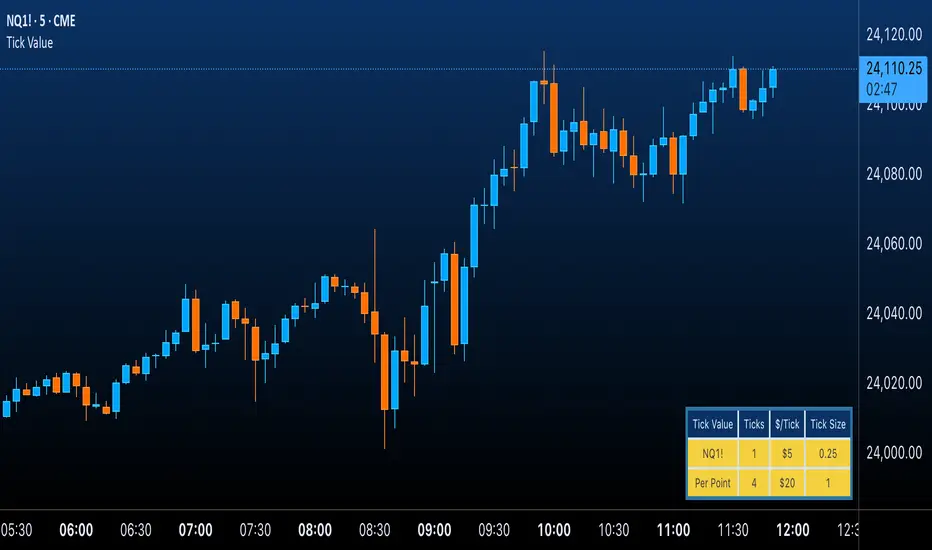
Futures Tick & Point Value [BoredYeti]Futures Tick & Point Value
This utility displays tick size, dollars per tick, and (optionally) a per-point row for the current futures contract.
Features
• Hardcoded $/tick map for common CME/NYMEX/CBOT/COMEX contracts
• Automatic fallback using pointvalue * mintick for any other symbol
• Table settings: adjustable position, text size, customizable colors
• Optional “Per Point” row showing ticks and $/point
Notes
• Contract specs can vary by broker/exchange and may change over time. Always confirm with official specifications.
• Educational tool only; not financial advice.
hidden buy or sell //@version=5
indicator(title="Institutional Flow & Trend", shorttitle="IF&T", overlay=true)
// --- INPUTS ---
// Trend EMA lengths
fast_ema_len = input.int(9, title="Fast EMA Length", minval=1)
slow_ema_len = input.int(21, title="Slow EMA Length", minval=1)
// OBV Moving Average length
obv_ema_len = input.int(10, title="OBV EMA Length", minval=1)
// RSI settings for hidden divergence (NEW)
rsi_len = input.int(14, title="RSI Length", minval=1)
// --- CALCULATIONS ---
// Calculate EMAs for trend
fast_ema = ta.ema(close, fast_ema_len)
slow_ema = ta.ema(close, slow_ema_len)
// Calculate On-Balance Volume and its moving average
obv_value = ta.obv
obv_ema = ta.ema(obv_value, obv_ema_len)
// Calculate RSI for divergence (NEW)
rsi_val = ta.rsi(close, rsi_len)
// --- HIDDEN DIVERGENCE LOGIC (NEW) ---
// Bullish hidden divergence: price makes a higher low, but RSI makes a lower low.
bullish_div = ta.lowest(low, 2) > ta.lowest(low, 2) and rsi_val > rsi_val
// Bearish hidden divergence: price makes a lower high, but RSI makes a higher high.
bearish_div = ta.highest(high, 2) < ta.highest(high, 2) and rsi_val < rsi_val
// --- SIGNAL LOGIC ---
// Bullish conditions:
// 1. Hidden bullish divergence is detected (NEW)
// 2. Fast EMA is above Slow EMA (uptrend)
// 3. OBV value is above its moving average (buying pressure)
bullish_signal = bullish_div and fast_ema > slow_ema and obv_value > obv_ema
// Bearish conditions:
// 1. Hidden bearish divergence is detected (NEW)
// 2. Fast EMA is below Slow EMA (downtrend)
// 3. OBV value is below its moving average (selling pressure)
bearish_signal = bearish_div and fast_ema < slow_ema and obv_value < obv_ema
// --- PLOTS & VISUALS ---
// Plot the EMAs on the chart
plot(fast_ema, title="Fast EMA", color=color.new(color.blue, 0), linewidth=2)
plot(slow_ema, title="Slow EMA", color=color.new(color.orange, 0), linewidth=2)
// Color the background based on signals
bgcolor(bullish_signal ? color.new(color.green, 90) : na, title="Bullish Zone")
bgcolor(bearish_signal ? color.new(color.red, 90) : na, title="Bearish Zone")
// Plot shapes for entry signals
plotshape(series=bullish_signal, title="Buy Signal", location=location.belowbar, color=color.new(color.green, 0), style=shape.triangleup, size=size.small)
plotshape(series=bearish_signal, title="Sell Signal", location=location.abovebar, color=color.new(color.red, 0), style=shape.triangledown, size=size.small)
// Plot shapes for divergence signals (NEW)
plotshape(series=bullish_div, title="Bullish Divergence", location=location.belowbar, color=color.new(color.lime, 0), style=shape.circle, size=size.tiny)
plotshape(series=bearish_div, title="Bearish Divergence", location=location.abovebar, color=color.new(color.red, 0), style=shape.circle, size=size.tiny)
// Alert conditions
alertcondition(bullish_signal, title="Bullish Reversal Signal", message="Institutional buying and trend aligned for a reversal!")
alertcondition(bearish_signal, title="Bearish Reversal Signal", message="Institutional selling and trend aligned for a reversal!")
// --- FOOTNOTE ---
// This indicator is a conceptual tool. Use it with other forms of analysis.
// Backtesting and optimization are crucial before live trading.

Distribution DaysThis script marks Distribution Days according to the Investors Business Daily method -- a significant decline on higher volume:
(1.) Price has declined > 0.2% from the prior day's close
(2.) Trading volume is greater than the prior day's volume

Herman 8-9 am SweepFrom x.com
1. Sweep 8-9am high/low
2. After sweep - 82.66% back to 9am candle open (before 10am)
The rectangle only appears when the 9 a.m. candle closes.
The yellow line only appears if there is a sweep of the High or Low of the rectangle.
The green line only appears if, after the sweep, the price returns to the line before 10 a.m.
If the line is not displayed, there is no sweep before 10 am.
Credits to: @R_Herman_ on X (Twitter)
Thanks and good trading

Ichimoku + MACD Combo (Two Alerts)The script is made in conjunction with below mentioned video which i watched few days ago
youtu.be
So i combined both ichimoku and MACD indicators and created the alerts as shown in the video

Trend-Strong Candle - 3 EMAs with Filters# Trend-Strong Candle - Professional Trading Indicator
## 📊 What It Does
Identifies high-probability entries by combining triple EMA trend analysis with strong candle detection. Only signals when all conditions align for maximum accuracy.
## 🎯 Core Features
- Triple EMA System: Fast (20) / Medium (50) / Slow (200) for trend confirmation
- Strong Candle Filter: ATR-based sizing ensures genuine momentum
- Advanced Filters: EMA close validation + trend stability checks
- Live Alerts: Instant notifications for real-time signals
- Session Filter: Trade only during active EU/US market hours
## ⚡ Quick Setup
Scalping (1-5min): Default settings + enable session filter
Day Trading (15-60min): Default settings work perfectly
Swing Trading (4H+): Increase ATR multiplier to 0.8-1.0
## 📈 Trading Rules
Long Signals: Green triangle below candle
- Strong bullish candle during confirmed uptrend
- All EMAs properly aligned (Fast > Medium > Slow)
Short Signals: Red triangle above candle
- Strong bearish candle during confirmed downtrend
- All EMAs properly aligned (Fast < Medium < Slow)
## ⚠️ Critical Success Factors
1. Always Verify the Trend Yourself
The indicator helps identify signals, but YOU must confirm the larger trend context. Check higher timeframes and overall market structure before entering.
2. Understand the "Big Players"
Strong candles in trend direction usually come from institutional money (banks, funds, algorithms). These create the momentum that retail traders can follow. The indicator catches these institutional moves.
3. Distance to Next Value Level
NEVER enter if price is too close to major resistance/support levels:
- Check distance to round numbers (1.1000, 1.1050, etc.)
- Ensure at least 20-30 pips room to next key level
- You need space for profit - tight levels = limited upside
4. Risk Management
- Stop Loss: 1-2 ATR from entry
- Take Profit: 2-3 ATR target (minimum 1:2 R/R)
- Position Size: Risk max 1-2% per trade
## 💡 Pro Tips
- Best Sessions: London open (8-12 UTC) and NY open (13-17 UTC)
- Avoid: Major news, low liquidity periods, choppy markets
- Multiple Timeframes: Confirm signals on higher timeframe
- Value Levels: Always check daily/weekly support/resistance before entering
## 🎯 Success Formula
Trend Confirmation + Strong Institutional Candle + Distance to Value Levels = High Probability Trade
*
Remember: The indicator finds the signals, but successful trading requires your analysis of trend context and value level positioning. Trade smart, not just frequent.

9:30 AM Open Percentage Lines//@version=5
indicator("9:30 AM Open Percentage Lines", overlay=true)
// Define the market open time in New York (or your local time zone if different)
// This is for 9:30 AM
var float opening_price = na
// Check if the current bar is the first one of the day at 9:30 AM
is_930_bar = (dayofweek == dayofweek.monday or dayofweek == dayofweek.tuesday or dayofweek == dayofweek.wednesday or dayofweek == dayofweek.thursday or dayofweek == dayofweek.friday) and hour(time("America/New_York")) == 9 and minute(time("America/New_York")) == 30
// On the first bar that meets the criteria, capture the opening price
if is_930_bar
opening_price := open
// Calculate the percentage levels based on the captured opening price
fivePercentAbove = opening_price * 1.05
sevenPercentAbove = opening_price * 1.07
twentySevenPercentAbove = opening_price * 1.27
// Plot the lines on the chart
// The `na` condition ensures the line is only plotted after the 9:30 AM bar has passed
plot(not na(opening_price) ? fivePercentAbove : na, title="5% Above 9:30 AM Open", color=color.new(color.rgb(255, 12, 12), 0), linewidth=2, trackprice=false)
plot(not na(opening_price) ? sevenPercentAbove : na, title="7% Above 9:30 AM Open", color=color.new(color.rgb(0, 150, 255), 0), linewidth=2, trackprice=false)
plot(not na(opening_price) ? twentySevenPercentAbove : na, title="27% Above 9:30 AM Open", color=color.new(color.rgb(255, 0, 0), 0), linewidth=2, trackprice=false)

black belt cloudThe EMA Cloud indicator highlights market trend direction by filling the space between multiple exponential moving averages with dynamic color-coded clouds.
When the market is in a bullish alignment, the cloud turns green, signaling strong upward momentum.
When the market shifts into a bearish alignment, the cloud turns red, warning of downside pressure.
During periods of mixed or uncertain conditions, the cloud appears yellow to indicate potential consolidation or indecision.
The indicator also includes alerts that trigger only on trend changes, helping traders react quickly when momentum shifts.
This tool makes it easy to:
Visualize trend strength at a glance
Avoid choppy, sideways market conditions
Combine with entry/exit strategies for improved decision-making

2ATR / Current Price %### **Real-Time 2ATR Volatility Ratio Indicator**
---
### **Overview**
This indicator provides a quick and visual way to understand market volatility by calculating the ratio between the **2ATR (Average True Range)** and the **current price**.
* **ATR (Average True Range)** is a widely-used measure of market volatility, showing the average price movement over a specific period.
* **2ATR** represents a price move that is twice the average volatility. Traders often use this value as a benchmark for potential support/resistance levels or for setting a dynamic stop-loss.
### **Key Features**
* **Real-Time Calculation**: Unlike many indicators that rely on the previous candle's close, this script calculates the 2ATR ratio using the **real-time current price**, providing you with up-to-the-second data.
* **Intuitive Display**: The final percentage value is shown in a clear **yellow label** at the **bottom-right** of your chart, making it easy to monitor without cluttering your view.
* **Customizable Input**: You can adjust the `ATR Period` setting to change the sensitivity of the volatility calculation, allowing you to adapt the indicator to different trading styles and timeframes.
### **How to Use It**
This tool is especially useful for **risk management and setting stop-loss orders**. The percentage displayed on the label tells you how much the price would need to move from its current level to equal a 2ATR change.
**Example**: If the indicator shows **3.5%**, it means a price drop of 3.5% from the current level would be equal to a 2ATR move. This gives you a clear and quantifiable number to help you set a **logical stop-loss** or to quickly assess the potential downside risk before entering a trade.

Climax Absorption Engine [AlgoPoint]Overview
Have you ever noticed that during a sharp, fast-moving trend, the single candle with the highest volume often appears right at the end, just before the price reverses? This is no coincidence. It's the footprint of a Climax Event.
This indicator is designed to detect these critical moments of maximum panic (capitulation) and maximum euphoria (FOMO). These are the moments when retail traders are driven by emotion, creating a massive pool of liquidity. The "Climax Absorption Engine" identifies when Smart Money is likely absorbing this liquidity to enter large positions against the crowd, right before a potential reversal.
It's a tool built not just on mathematical formulas, but on the principles of market psychology and smart money activity.
How It Works: The 3-Step Logic
The indicator uses a sequential, three-step process to identify high-probability reversal setups:
1. Momentum Move Detection: First, the engine identifies a period of strong, directional momentum. It looks for a series of consecutive, same-colored candles and confirms that the move is backed by a steeply sloped moving average. This ensures we are only looking for climactic events at the end of a significant, non-random move.
2. Climax Candle Identification: Within this momentum move, the indicator scans for a candle with abnormally high volume—a volume spike that is significantly larger than the recent average. This candle is marked on your chart with a diamond shape and is identified as the Climax Candle. This is the point of peak emotion and the primary area of interest. No signal is generated yet.
3. Absorption & Reversal Confirmation: A climax is a warning, not a signal. The final signal is only triggered after the market confirms the reversal.
- For a BUY Signal: After a bearish (red) Climax Candle, the indicator waits for a subsequent green candle to close decisively above the midpoint of the Climax Candle. This confirms that the panic selling has been absorbed by buyers.
- For a SELL Signal: After a bullish (green) Climax Candle, it waits for a subsequent red candle to close decisively below the midpoint. This confirms that the euphoric buying has evaporated.
How to Interpret & Use This Indicator
- The Diamond Shape: A diamond shape on your chart is an early warning. It signifies that a climax event has occurred and the underlying trend is exhausted. This is the time to pay close attention and prepare for a potential reversal.
- The BUY/SELL Labels: These are the final, actionable signals. They appear only after the reversal has been confirmed by price action.
- A BUY signal suggests that capitulation selling is over, and buyers have absorbed the pressure.
- A SELL signal suggests that FOMO buying is over, and sellers are now in control.
Key Settings
- Momentum Detection: Adjust the number of consecutive bars and the EMA slope required to define a valid momentum move.
- Climax Detection: Fine-tune the sensitivity of the volume spike detection using the Volume Multiplier. Higher values will find only the most extreme events.
- Confirmation Window: Define how many bars the indicator should wait for a reversal candle after a climax event before the setup is cancelled.

Kalman Adjusted Average True Range [BackQuant]Kalman Adjusted Average True Range
A volatility-aware trend baseline that fuses a Kalman price estimate with ATR “rails” to create a smooth, adaptive guide for entries, exits, and trailing risk.
Built on my original Kalman
This indicator is based on my original Kalman Price Filter:
That core smoother is used here to estimate the “true” price path, then blended with ATR to control step size and react proportionally to market noise.
What it plots
Kalman ATR Line the main baseline that turns up/down with the filtered trend.
Optional Moving Average of the Kalman ATR a secondary line for confluence (SMA/Hull/EMA/WMA/DEMA/RMA/LINREG/ALMA).
Candle Coloring (optional) paint bars by the baseline’s current direction.
Why combine Kalman + ATR?
Kalman reduces measurement noise and produces a stable path without the lag of heavy MAs.
ATR rails scale the baseline’s step to current volatility, so it’s calm in chop and more responsive in expansion.
The result is a single, intelligible line you can trade around: slope-up = constructive; slope-down = caution.
How it works (plain English)
Each bar, the Kalman filter updates an internal state (tunable via Process Noise , Measurement Noise , and Filter Order ) to estimate the underlying price.
An ATR band (Period × Factor) defines the allowed per-bar adjustment. The baseline cannot “jump” beyond those rails in one step.
A direction flip is detected when the baseline’s slope changes sign (upturn/downturn), and alerts are provided for both.
Typical uses
Trend confirmation Trade in the baseline’s direction; avoid fading a firmly rising/falling line.
Pullback timing Look for entries when price mean-reverts toward a rising baseline (or exits on tags of a falling one).
Trailing risk Use the baseline as a dynamic guide; many traders set stops a small buffer beyond it (e.g., a fraction of ATR).
Confluence Enable the MA overlay of the Kalman ATR; alignment (baseline above its MA and rising) supports continuation.
Inputs & what they do
Calculation
Kalman Price Source which price the filter tracks (Close by default).
Process Noise how quickly the filter can adapt. Higher = more responsive (but choppier).
Measurement Noise how much you distrust raw price. Higher = smoother (but slower to turn).
Filter Order (N) depth of the internal state array. Higher = slightly steadier behavior.
Kalman ATR
Period ATR lookback. Shorter = snappier; longer = steadier.
Factor scales the allowed step per bar. Larger factors permit faster drift; smaller factors clamp movement.
Confluence (optional)
MA Type & Period compute an MA on the Kalman ATR line , not on price.
Sigma (ALMA) if ALMA is selected, this input controls the curve’s shape. (Ignored for other MA types.)
Visuals
Plot Kalman ATR toggle the main line.
Paint Candles color bars by up/down slope.
Colors choose long/short hues.
Signals & alerts
Trend Up baseline turns upward (slope crosses above 0).
Alert: “Kalman ATR Trend Up”
Trend Down baseline turns downward (slope crosses below 0).
Alert: “Kalman ATR Trend Down”
These are state flips , not “price crossovers,” so you avoid many one-bar head-fakes.
How to start (fast presets)
Swing (daily/4H) ATR Period 7–14, Factor 0.5–0.8, Process Noise 0.02–0.05, Measurement Noise 2–4, N = 3–5.
Intraday (5–15m) ATR Period 5–7, Factor 0.6–1.0, Process Noise 0.05–0.10, Measurement Noise 2–3, N = 3–5.
Slow assets / FX raise Measurement Noise or ATR Period for calmer lines; drop Factor if the baseline feels too jumpy.
Reading the line
Rising & curving upward momentum building; consider long bias until a clear downturn.
Flat & choppy regime uncertainty; many traders stand aside or tighten risk.
Falling & accelerating distribution lower; short bias until a clean upturn.
Practical playbook
Continuation entries After a Trend Up alert, wait for a minor pullback toward the baseline; enter on evidence the line keeps rising.
Exit/reduce If long and the baseline flattens then turns down, trim or exit; reverse logic for shorts.
Filters Add a higher-timeframe check (e.g., only take longs when the daily Kalman ATR is rising).
Stops Place stops just beyond the baseline (e.g., baseline − x% ATR for longs) to avoid “tag & reverse” noise.
Notes
This is a guide to state and momentum, not a guarantee. Combine with your process (structure, volume, time-of-day) for decisions.
Settings are asset/timeframe dependent; start with the presets and nudge Process/Measurement Noise until the baseline “feels right” for your market.
Summary
Kalman ATR takes the noise-reduction of a Kalman price estimate and couples it with volatility-scaled movement to produce a clean, adaptive baseline. If you liked the original Kalman Price Filter (), this is its trend-trading cousin purpose-built for cleaner state flips, intuitive trailing, and confluence with your existing

RSI Trend Navigator [QuantAlgo]🟢 Overview
The RSI Trend Navigator integrates RSI momentum calculations with adaptive exponential moving averages and ATR-based volatility bands to generate trend-following signals. The indicator applies variable smoothing coefficients based on RSI readings and incorporates normalized momentum adjustments to position a trend line that responds to both price action and underlying momentum conditions.
🟢 How It Works
The indicator begins by calculating and smoothing the RSI to reduce short-term fluctuations while preserving momentum information:
rsiValue = ta.rsi(source, rsiPeriod)
smoothedRSI = ta.ema(rsiValue, rsiSmoothing)
normalizedRSI = (smoothedRSI - 50) / 50
It then creates an adaptive smoothing coefficient that varies based on RSI positioning relative to the midpoint:
adaptiveAlpha = smoothedRSI > 50 ? 2.0 / (trendPeriod * 0.5 + 1) : 2.0 / (trendPeriod * 1.5 + 1)
This coefficient drives an adaptive trend calculation that responds more quickly when RSI indicates bullish momentum and more slowly during bearish conditions:
var float adaptiveTrend = source
adaptiveTrend := adaptiveAlpha * source + (1 - adaptiveAlpha) * nz(adaptiveTrend , source)
The normalized RSI values are converted into price-based adjustments using ATR for volatility scaling:
rsiAdjustment = normalizedRSI * ta.atr(14) * sensitivity
rsiTrendValue = adaptiveTrend + rsiAdjustment
ATR-based bands are constructed around this RSI-adjusted trend value to create dynamic boundaries that constrain trend line positioning:
atr = ta.atr(atrPeriod)
deviation = atr * atrMultiplier
upperBound = rsiTrendValue + deviation
lowerBound = rsiTrendValue - deviation
The trend line positioning uses these band constraints to determine its final value:
if upperBound < trendLine
trendLine := upperBound
if lowerBound > trendLine
trendLine := lowerBound
Signal generation occurs through directional comparison of the trend line against its previous value to establish bullish and bearish states:
trendUp = trendLine > trendLine
trendDown = trendLine < trendLine
if trendUp
isBullish := true
isBearish := false
else if trendDown
isBullish := false
isBearish := true
The final output colors the trend line green during bullish states and red during bearish states, creating visual buy/long and sell/short opportunity signals based on the combined RSI momentum and volatility-adjusted trend positioning.
🟢 Signal Interpretation
Rising Trend Line (Green): Indicates upward momentum where RSI influence and adaptive smoothing favor continued price advancement = Potential buy/long positions
Declining Trend Line (Red): Indicates downward momentum where RSI influence and adaptive smoothing favor continued price decline = Potential sell/short positions
Flattening Trend Lines: Occur when momentum weakens and the trend line slope approaches neutral, suggesting potential consolidation before the next move
Built-in Alert System: Automated notifications trigger when bullish or bearish states change, sending "RSI Trend Bullish Signal" or "RSI Trend Bearish Signal" messages for timely entry/exit
Color Bar Candles Option: Optional candle coloring feature that applies the same green/red trend colors to price bars, providing additional visual confirmation of the current trend direction

Black Belt cloudThe EMA Cloud indicator highlights market trend direction by filling the space between multiple exponential moving averages with dynamic color-coded clouds.
When the market is in a bullish alignment, the cloud turns green, signaling strong upward momentum.
When the market shifts into a bearish alignment, the cloud turns red, warning of downside pressure.
During periods of mixed or uncertain conditions, the cloud appears gray to indicate potential consolidation or indecision.
The indicator also includes alerts that trigger only on trend changes, helping traders react quickly when momentum shifts.
This tool makes it easy to:
Visualize trend strength at a glance
Avoid choppy, sideways market conditions
Combine with entry/exit strategies for improved decision-making
Bias + VWAP Pullback — v4 (PA + BOS/CHOCH)Simple idea: I identify the trend (bias) from the larger timeframe, and only trade pullbacks to the VWAP/EMA during liquidity (London/New York). When the trend is clear, gold moves strongly, and its pullbacks to the balance lines provide clear opportunities.
Timeframe and Sessions (Cairo Time)
Analysis: H1 to determine the trend.
Implementation: 5m (or 1m if professional).
Trading window:
London Opening: 10:00–12:30
New York Opening: 16:30–19:00
(avoid the rest of the day unless there is exceptional traffic).
Direction determination (BIAS)
On H1:
If the price is above the 200 EMA and the daily VWAP is bullish and the price is above it → uptrend (long-only).
If the price is below the 200 EMA and the daily VWAP is bearish and the price is below it → bearish trend (short-only).
Determine your levels: yesterday's high/low (PDH/PDL) + approximate Asia range (03:00–09:30).
Entry Rules (Setup A: Trend Continuation)
Asia range breakout towards Bias during liquidity window.
Wait for a withdrawal to:
Daily VWAP, or
EMA50 on 5m frame (best if both cross).
Confirmation: Confirmation low/high on 5m (HL buy/LH sell) + clear impulse candle (Body is greater than average of last 10 candles).
Entry:
Buy: When the price returns above VWAP/EMA50 with a confirmation candle close.
Sell: The exact opposite.
Stop Loss (SL): Below/above the last confirmation low/high or ATR(14, 5m) x 1.5 (largest).
Objectives:
TP1 = 1R (Close 50% and move the rest Break-even).
TP2 = 2.5R to 3R or at an important HTF level (PDH/PDL/Bid/Demand Zone).
Entry Rules (Setup B: Reversion to VWAP – “Mean Reversion”)
Use with extreme caution, once daily maximum:
Price deviation from VWAP by more than ~1.5 x ATR(14, 5m) with rejection candles appearing near PDH/PDL.
Reverse entry towards the return of VWAP.
SL small behind rejection top/bottom.
Main target: VWAP. (Don't get greedy — this scenario is for extended periods only.)
News Filtering and Risk Management
Avoid trading 15–30 minutes before/after strong US news (CPI, NFP, FOMC).
Maximum daily loss: 1.5–2% of account balance.
Risk per trade: 0.25–0.5% (if you are learning) or 0.5–1% (if you are experienced).
Do not exceed two consecutive losing trades per day.
Don't chase the market after the opportunity has passed — wait for the next pullback.
Smart Deal Management
After TP1: Move stop to entry point + trail the rest with EMA20 on 5m or ATR Trailing = ATR(14)×1.0.
If the price touches a strong daily level (PDH/PDL) and fails to break, consider taking additional profit.
If VWAP starts to flatten and breaks against the trend on H1, stop trading for the day.
Quick Checklist (Before Entry)
H1 trend is clear and consistent with 200EMA + VWAP.
Penetrating the Asia range towards Bias.
Clean pull to VWAP/EMA50 on 5m.
Confirmation candle and real push.
SL is logical (behind swing/ATR×1.5) and R :R ≥ 1:2.
No red news coming soon.
Example of "ready-made" settings
EMA: 20, 50, 200 on 5m, 200 only on H1.
VWAP: Daily (reset daily).
ATR: 14 on 5m.
Levels: PDH/PDL + Asia Band (03:00–09:30 Cairo).
Gold Notes
Gold is fast and sharp at the open; don't get in early — wait for the draw.
Fakeouts are common before news: it is best to call with the trend after the price returns above/below VWAP.
Don't expect 80% consistent wins every day — the advantage comes from discipline, filtering out bad days, and only withdrawing when you're on the right track.
تعتبر شركة الماسة الألمانية أحد المؤسسات العاملة بالمملكة العربية السعودية ولها تاريخ طويل من الخدمات الكثيرة والمتنوعة التى مازالت تقدمها للكثير من العملاء داخل جميع مدن وأحياء المملكة حيث نقدم أفضل ما لدينا من خلال مجموعة الشركات التالية والتي من خلالها ستتلقي كل ما تحتاج إلية في كل المجال المختلفة فنحن نعمل منذ عام 2015 ولنا سابقات اعمال فى مختلف المجالات الحيوية التى نخدم من خلالها عملائنا ونوفر لهم أرخص الأسعار وبأعلى جودة من الممكن توفرها فى المجالات التالية :-
خدمات تنظيف المنازل والفلل والشقق
خدمات عزل الخزانات تنظيف غسيل صيانة اصلاح
خدمات جلي البلاط والرخام والسيراميك
خدمات نقل العفش عمالة فلبينية مدربة
خدمات مكافحة الحشرات بجدة
كل هذة الخدمات وأكثر نوفرها لكل المتعاقدين بأفضل الطرق مع توفير خطط وبرامج متنوعة لأتمام العمل المسنود إلينا بأفضل وأحدث الطرق الحديثة والعصرية سواء فى شركات النظافة بجدة ومكة المكرمة أو شركات نقل العفش بجدة عمالة فلبينية وباقى الخدمات مثل جلي وتلميع الرخام بمكة وجدة ولا ننسي شركة مكافحة حشرات بجدة التى ساعدت آلاف المواطنين على تنظيف منازلهم من الحشرات بأفضل مبيدات حشرية.

Multi-Strategy Trading Screener SummaryI only combined famous scripts, all thanks to wonderful scripts and community out there .
ThankYou !
------
Core Architecture
Multi-Symbol Analysis: Tracks up to 5 configurable tickers simultaneously
Multi-Timeframe Support: Each symbol can use different timeframes
Real-Time Dashboard: Color-coded table displaying all signals and analysis
Trend Validation: All signals include trend alignment confirmation
Integrated Trading Strategies
1. Breaker Blocks (Order Blocks)
Detects institutional order blocks using swing analysis
Tracks when blocks are broken and become "breaker blocks"
Monitors retests of broken levels
Shows trend alignment (✓ aligned, ⚠️ misaligned)
2. Chandelier Exit
ATR-based trend-following exit system
Provides BUY/SELL signals based on dynamic stop levels
Uses configurable ATR multiplier and lookback period
3. Smart Money Breakout
Channel breakout detection with volatility normalization
Identifies accumulation/distribution phases
Generates persistent BUY/SELL signals on breakouts
4. Trendline Breakout
Dynamic trendline detection using pivot highs/lows
Calculates trendline slopes and breakout points
Provides BUY signals on upward breaks, SELL on downward breaks
Dashboard Columns Explained
Symbol: Ticker being analyzed
Trend: Overall SuperTrend direction (🟢 UP / 🔴 DOWN / ⚪ FLAT)
Timeframe: Analysis timeframe with clock icon
Breaker Block: Type (Bullish/Bearish) with trend alignment indicator
Status: Price position relative to breaker block (Inside/Approaching/Far)
Retests: Number of times the broken level was retested (indicates level strength)
Volume: Volume associated with the order block formation
Chandelier: BUY/SELL signals from Chandelier Exit strategy
Smart Money: BUY/SELL signals from breakout detection
Trendline: BUY/SELL signals from trendline breakouts
Key Features
No HOLD States: All signals show definitive BUY (🟢) or SELL (🔴) only
Persistent Signals: Signals remain active until opposite conditions trigger
Color Coding: Visual distinction between bullish (green) and bearish (red) signals
Trend Alignment: Enhanced accuracy through trend confirmation logic
This screener provides a comprehensive view of market conditions across multiple strategies, helping identify high-probability trading opportunities when signals align.

Triple-EMA Cloud (3× configurable EMAs + timeframe + fill)About This Script
Name: Triple-EMA Cloud (3× configurable EMAs + timeframe + fill)
What it does:
The script plots three Exponential Moving Averages (EMAs) on your chart.
You can set each EMA’s length (how many bars or days it averages over), source (for example, closing price, opening price, or the midpoint of high + low), and timeframe (you can have one EMA use daily data, another hourly data, etc.).
The indicator draws a “cloud” or channel by shading the area between the outermost two EMAs of the three. This lets you see a band or zone that the price is moving in, defined by those EMAs.
You also get full control over how each of the three EMA‐lines looks: color, thickness, transparency, and plot style (solid line, steps, circles, etc.).
How to Use It (for Beginners)
Here’s how a trader who’s new to charts can use this tool, especially when looking for pullbacks or undercut price action.
Key Concepts
Trend: Imagine the market price is generally going up or down. EMAs are a way to smooth out price movements so you can see the trend more clearly.
Pullback: When a price has been going up (an uptrend), sometimes it dips down a little before going up again. That dip is the pullback. It’s a chance to enter or add to a position at a “better price.”
Undercut: This is when price drops below an important level (for example an EMA) and then comes back up. It looks like it broke below, but then it recovers. That may show reverse pressure or strength building.
How the Script Helps With Pullbacks & Undercuts
Marking Trend Zones with the Cloud
The cloud between the outer EMA lines gives you a zone of expected support/resistance. If the price is above the cloud, that zone can act like a “floor” in uptrends; if it is below, the cloud might act like a “ceiling” in downtrends.
Watching Price vs the EMAs
If the price pulls back toward the cloud (or toward one of the EMAs) and then bounces back up, that’s a signal that the uptrend might continue.
If the price undercuts (goes a bit below) one of the EMAs or the cloud and then returns above it, that can also be a signal. It suggests that even though there was a temporary drop, buyers stepped in.
Using the Three EMAs for Confirmation
Because the script uses three EMAs, you can see how tightly or loosely they are spaced.
If all three EMAs are broadly aligned (for example, in an uptrend: shorter length above longer length, each pulling from reliable price source), that gives more confidence in trend strength.
If the middle EMA (or different source/timeframe) is holding up as support while others are above, it strengthens signal.
Entry & Exit Points
Entry: For example, after a pullback toward the cloud or “mid‐EMA”, wait for price to show a bounce up. That could be a better entry than buying at the top.
Stop Loss / Risk: You might place a stop loss just below the cloud or the lowest of your selected EMAs so that if price breaks through, the idea is invalidated.
Profit Target: Could be a recent high, resistance level, or a fixed reward-risk multiple (for example aiming to make twice what you risked).
Practical Steps for New Traders
Set up the EMAs
Choose simple lengths like 10, 21, 50.
For example, EMA #1 = length 10, source Close, timeframe “current chart”; EMA #2 = length 21, source (H+L)/2; EMA #3 = length 50, maybe timeframe daily.
Observe the Price Action
When price moves up, then dips, see if it comes back near the shaded cloud or one of the EMAs.
See if the dip touches the EMAs lightly (not a big drop) and then price starts climbing again.
Look for undercuts
If price briefly goes below a line (or below cloud) and then closes back above, that’s undercut + recovery. That bounce back is often meaningful.
Manage risk
Only put in money you can afford to lose.
Use small position size until you get comfortable.
Use stop-loss (as mentioned) in case the price doesn’t bounce as expected.
Practice
Put this indicator on charts (stocks you follow) in past time periods. See how price behaved with pullbacks / undercuts relative to the EMAs & cloud. This helps you learn to see signals.
What It Doesn’t Do (and What to Be Careful Of)
It doesn’t predict the future — it simply shows zones and trends. Price can still break down through the cloud.
In a “choppy” market (i.e. when price is going up and down without a clear trend), signals from EMAs / clouds are less reliable. You’ll get more “false bounces.”
Under / overshoots & big news events can break through clean levels, so always watch for confirmation (volume, price behavior) before putting big money in.

Weekly Session DividerThis indicator plots vertical divider lines at the start of each new weekly trading session (Sunday 8 PM ET / Monday 00:00 UTC in crypto).
It helps traders quickly spot the opening point of every weekly candle when viewing intraday charts.
Features:
Automatically detects the start of a new week using TradingView’s weekly time stamps.
Customizable line color, width, and style (solid, dashed, dotted).
Only displays on intraday timeframes to keep higher-timeframe charts clean.
Extends divider lines above and below the current chart for easy visibility.
Use case:
Great for crypto and futures traders who want to align intraday trading setups with higher-timeframe weekly opens, track session-to-session structure, or mark where the market’s new weekly trend may begin.

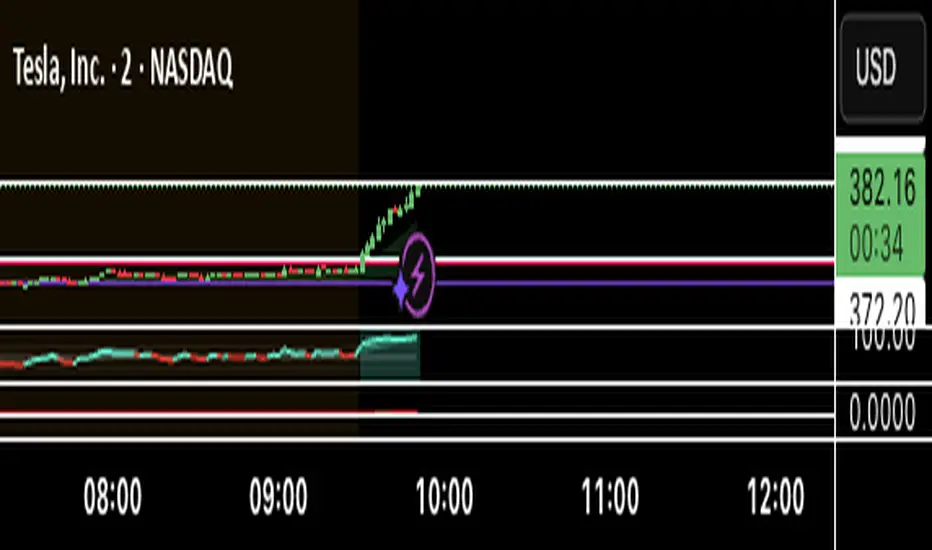
Champs LevelsEasy Bullish & Bearish sentiments to show short term trends.
How it works:
Orange line → 8 EMA
Purple line → Premarket High
Red line → Premarket Low
Background flashes green when above both, red when below both
🚀 marker = bullish breakout, ⚠ marker = bearish breakdown
Alerts for both sides

Post 9/21 EMA Cross — Paint X Bars v2.0
# **Post 9/21 EMA Cross — Time Blocks & Session Colors**
This indicator highlights candles after a **9/21 EMA crossover**, but with extra controls that let you focus only on the sessions and time windows that matter to you.
---
## 🔑 What It Does
1. **EMA Cross Trigger**
* Bullish trigger: 9 EMA crosses above 21 EMA.
* Bearish trigger: 9 EMA crosses below 21 EMA.
2. **Bar Painting**
* After a valid cross, the indicator paints a set number of bars (you choose how many).
* You can require the **2nd bar to confirm momentum** (“displacement” filter) so weak signals are ignored.
3. **Time Block Control**
* Define up to **four custom time blocks** (like `08:00–09:30` or `12:00–13:00`).
* Painting only occurs inside those blocks if you enable the filter.
4. **Session-Aware Colors**
* Use one set of bullish/bearish colors for **regular hours**, another set for **pre-market**, and another for **post-market**.
* That way you can instantly see *when* the signal occurred.
---
## 🎨 Visuals
* Candles recolored in your chosen bull/bear colors.
* Optional EMA lines plotted on the chart for reference.
* Different colors for RTH, pre-market, and post-market activity.
---
## ⚙️ Inputs
* **EMA lengths (fast & slow)**
* **Number of bars to paint after a cross**
* **Displacement filter (loose or strict)**
* **Show/hide EMA lines**
* **Up to four custom time blocks** (on/off toggles + start/end times)
* **Bull/bear colors for RTH, Pre, Post**
---
## 📈 Why Use It
* **Clarity** – Only shows cross signals in the hours you actually trade.
* **Focus** – Different colors remind you at a glance whether the move was in pre-market, RTH, or post-market.
* **Discipline** – The optional 2nd-bar displacement filter prevents false starts by requiring real momentum.
---
## 🚨 Practical Use
* Treat the painted window as a **momentum phase**: enter on confirmation, manage risk while bars are painted, and stand aside once painting ends.
* Restrict painting to time blocks that match your personal trading routine (e.g., open drive 09:30–10:00, or late-day momentum 15:00–16:00).
* Use session colors to keep pre/post-market action separate from regular session strategies.

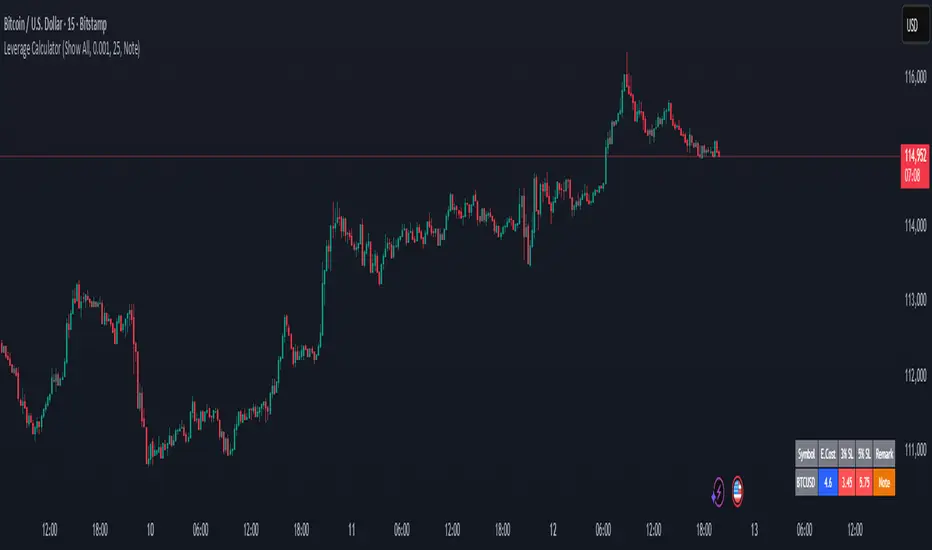
Margin Cost Calculator Screener - Taylor V1.2# Leverage Position Cost Calculator & Stop Lose Cost Screener #
Designed to provide traders with crucial insights into their leveraged positions directly on the TradingView chart.
Key Features:
> Dynamic Display: Choose to view only the estimated entry cost, or a comprehensive overview including potential losses at specific stop-loss levels, and a custom remark.
> Contract Size Input: Easily specify the contract size for your trades.
> Leverage Level Input: Set your desired leverage level, with helpful tooltips explaining the margin requirements for various leverage ratios (e.g., 25x, 10x, 5x) and an included fee estimate.
> Cost Calculation: Accurately calculates the estimated entry cost for your position based on the current market price, contract size, and leverage.
> Stop-Loss Projections: It projects potential losses for stop-loss orders set at 3% and 5% below the entry price, helping you manage risk effectively.
> Clear Table Visualization: All calculated data is presented in a clean, organized table anchored to the bottom-left of your chart, making it easy to reference at a glance.
> Symbol Identification: Automatically displays the short ticker symbol for the asset you are analyzing.
This tool is invaluable for traders who utilize leverage and need a quick, visual way to understand their financial exposure and potential outcomes before entering or managing a trade.