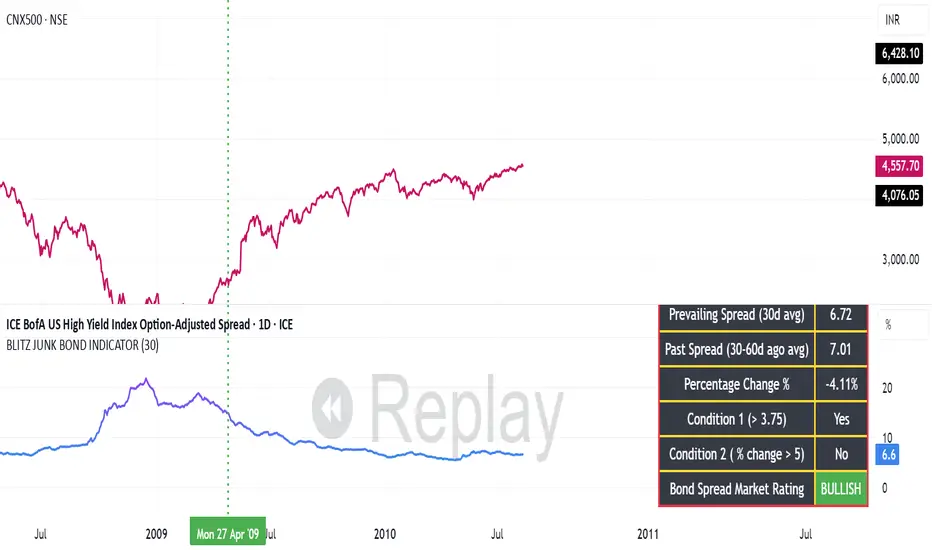
BLITZ JUNK BOND INDICATORThe given indicator considers the fluctuations in the bond market and the spread that are existing as a premium demanded by investors for high risk corporate junk bonds.
1. The junk bond spread indicator precisely anticipates market phases, especially any panic kind of scenario.
2. Junk bond spread indicator often face choppy market zone and entirely we must rely on our portfolio churning skills if such scenario occurs and the broader markets failed to perform even if the indicator has made us to make a buy position
3. Whenever Bullish signal comes, same is to be confirmed with the price action of the broader market index, then same to be confirmed in the junk bond spreads chart if the spreads are going down steadily or is breaking down from the nearest swing low and cooling off. This, scenario indicates we must expose our portfolio to equities
4. Whenever Bearish signal comes, same to be cofirmed with the price action of the broader market index, then same to be confirmed in the junk bond spread charts if the spreads are heating up breaking nearby swing highs or steadily moving up. In such scenario, we must prepare for heavy market drawdowns or must anticipate some panic scenario in the markets and thus should avoid equities.
Indicators and strategies
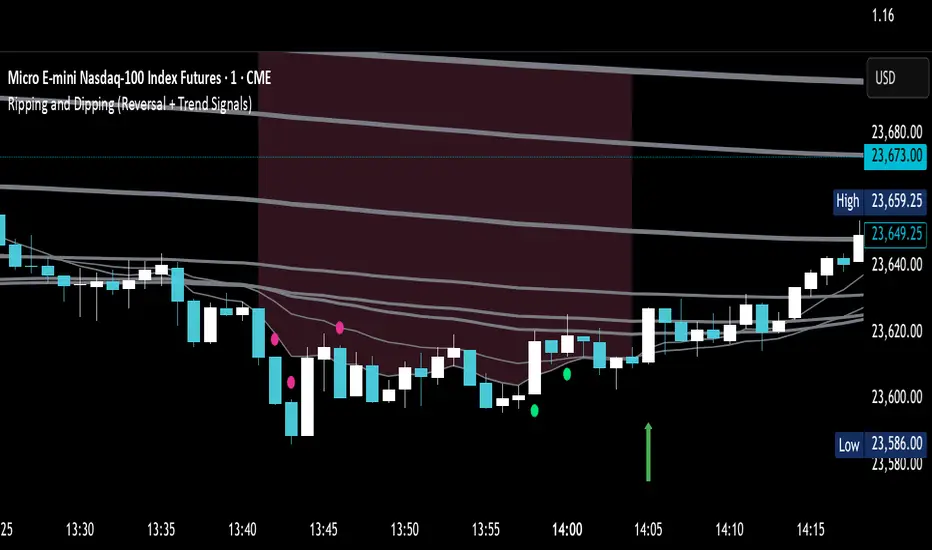
Ripping and Dipping (Reversal + Trend Signals)Waits for a series of EMAs to be stacking from fastest to slowest for a user input X bars, then signals trend or reversal trades based on a simple close above/below the high/low of the last bar. Designed to catch quick trend trades once strength is confirmed, and quick reversal trades once trend has overextended.

WEBBERISKI TRADESWEBBERISKI Indicator
The WEBBERISKI indicator is a powerful tool designed for traders seeking to capitalize on short-term price movements in volatile markets. It generates buy signals based on a combination of RSI crossovers, EMA breakouts, and VWAP conditions, with customizable filters to restrict signals to prices above or below the anchored VWAP. The indicator tracks both active and ignored trades, providing detailed performance metrics, including win/loss percentages, drop percentages, and time-to-take-profit buckets (<1h, 1-2h, 2-3h, 3-4h, >4h). Visual labels (W, L, IW, IL) mark trade outcomes on the chart, while two tables display drop percentage distributions and comprehensive trade statistics, including VWAP-based win rates. Ideal for day traders and scalpers, WEBBERISKI offers flexible inputs for take-profit, stop-loss, and technical parameters to optimize trading strategies.
The indicator works best and has the highest probability win rates when SL is 5%+ so you need nerves to take trades. But can provide 60%+ win rates with lower SL (1%).
Default TP/SL setting is 0.6% for TP, 5% for SL. Ideally take trades and place your buy order 0.3-0.4% below the signal candle for a TP% of 0.9-1.0%.

4 DU DINHSample Indicator Introduction (English)
Title:
Adaptive Trend & Momentum Indicator
Short Description:
An adaptive indicator that combines trend detection and momentum confirmation to help identify potential entry and exit points in various markets.
Full Description:
This indicator is designed to provide traders with a clear view of both trend direction and momentum strength. It dynamically adjusts to different market conditions, making it suitable for cryptocurrencies, stocks, and forex.
Main Features:
Trend Identification: Uses adaptive moving averages to detect bullish or bearish market phases.
Momentum Confirmation: Integrates oscillator-based signals to reduce false entries during sideways markets.
Customizable Inputs: Adjustable sensitivity, smoothing factors, and signal thresholds.
Non-repainting Logic: Signals are only confirmed after candle close to avoid misleading entries.
How to Use:
A bullish signal occurs when trend direction turns positive and momentum confirms.
A bearish signal occurs when trend direction turns negative with momentum confirmation.
Recommended for H1 and higher timeframes, but can be tuned for intraday strategies.
⚠️ Disclaimer: This indicator is for educational purposes only. It does not guarantee profits. Always combine with proper risk management and backtesting before trading live.

Swing Guardrail — 30-sec Midterm Check (EBITDA Margin & EV/EBITDWhat it does
Before a short-term swing entry, this indicator right-sizes positions by a quick midterm (3–12m) durability screen using two fundamentals:
EBITDA Margin (TTM) → earning power / operational resilience
EV/EBITDA (TTM) → price tag vs earning capacity (payback feel)
A high-contrast table (top-right) shows both metrics and a verdict:
PASS — both meet thresholds → normal size
HALF — only one meets → reduce size
FAIL — neither meets → avoid
Why check “midterm” for a short-term trade?
Short swings still face earnings/news gaps, failed breakouts, and regime shifts. Names with weak margins or stretched valuation tend to break faster and deeper. A 30-sec durability check helps you:
Filter fragile setups (avoid expensive + weakening names)
Stabilize drawdowns (size down when quality/price don’t align)
Keep timing unchanged while improving risk-adjusted returns
Inputs (defaults)
Min EBITDA Margin % (TTM): 8%
Max EV/EBITDA (TTM): 12
Dark chart? High-contrast colors
How to use with a swing system
Get your entry from price/volume (e.g., Ichimoku cloud break, Kijun reclaim, Tenkan>Kijun; or your A/B/C rules).
Run this check only to set size (not timing).
Optional alerts: Once per bar close for PASS / HALF / FAIL.
Size mapping & event guard
PASS → 100% of your planned size
HALF → ~50% size / tighter stops
FAIL → watchlist only
If earnings < ~10 JP business days, drop one tier; ≤3 days → avoid.
Sector guides (tweak as needed)
Software/Internet: Margin ≥ 15%, EV/EBITDA ≤ 18
Industrials/Consumer: Margin ≥ 8%, EV/EBITDA ≤ 12
Retail: Margin ≥ 5–7%, EV/EBITDA ≤ 10–12
Edge cases / substitutions
Banks/Insurers/REITs or net-cash/negative EBITDA: EV/EBITDA may mislead → consider Net Debt/EBITDA or sector metrics (CET1/LTV/DSCR).
Sparse data / fresh listings: numbers may be NA until updates.
Notes & limitations
Data via request.financial() (TTM/most-recent). Some tickers/regions can show NA until fundamentals refresh.
This is a risk-screen / sizing tool, not a buy/sell signal.
Disclaimer
Educational use only. Not investment advice.
日本語
タイトル
スイング用ガードレール―中期“壊れにくさ”30秒チェック(EBITDAマージン & EV/EBITDA, TTM)
概要
短期スイングのエントリー前に、中期(3〜12か月)の耐久性を2指標で素早く確認し、ポジションサイズを決めるためのツールです。
EBITDAマージン(TTM):事業の稼ぐ力・体力
EV/EBITDA(TTM):その体力に対する“値札”(回収年数の感覚)
右上の高コントラスト表に数値と判定を表示:
PASS:両方クリア → 通常サイズ
HALF:片方のみ → サイズ半分
FAIL:両方NG → 見送り
なぜ短期でも“中期”を確認?
短期でも決算・ニュースのギャップ、ブレイク失敗、地合い転換は起きます。マージンが弱い/割高すぎる銘柄は崩れやすく、戻りも鈍い傾向。30秒の耐久性チェックで
脆いセットアップを回避
ドローダウンを平準化(サイズで吸収)
タイミングは変えずに、リスク調整後リターンの改善を狙えます。
入力(既定)
最低EBITDAマージン:8%
最大EV/EBITDA:12
黒背景向け:高コントラスト表示
使い方(スイング手法と併用)
まずは価格シグナル(一目の雲上抜け/基準線回復/転換線>基準線、またはA/B/Cルール)。
本インジの判定でサイズのみ決定(エントリーのタイミングは出しません)。
任意でバー確定アラート(PASS/HALF/FAIL)を設定。
サイズ目安 & イベント抑制
PASS:計画サイズ100%
HALF:約50%(ストップもタイトに)
FAIL:見送り
決算まで≦10営業日なら1段階サイズダウン、≦3営業日は原則見送り。
セクター目安(調整推奨)
ソフト/ネット:マージン 15%以上、EV/EBITDA 18以下
工業/一般消費:マージン 8%以上、EV/EBITDA 12以下
小売:マージン 5〜7%以上、EV/EBITDA 10〜12以下
例外・代替
銀行・保険・REIT/ネットキャッシュ・EBITDAマイナス:EV/EBITDAは適さない場合 → Net Debt/EBITDAやCET1/LTV/DSCR等で補助。
新規上場・データ薄:更新までNAのことあり。
注意
データは request.financial() を使用。更新前はNAの可能性。
本ツールはリスク確認/サイズ調整用で、売買シグナルではありません。
免責
情報提供のみ。投資判断は自己責任で。

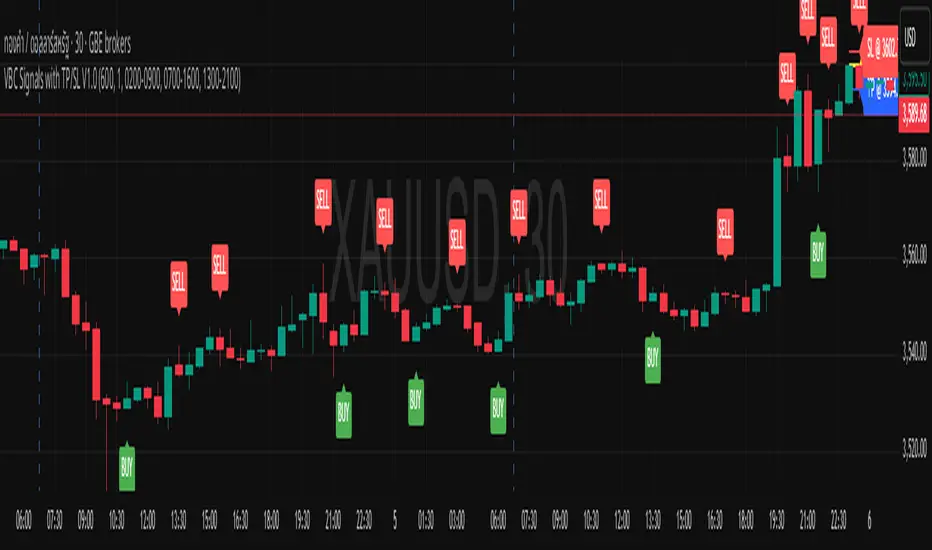
VBC Signals with TP/SL V1.0This script was based on volume break candle theory.
VBC has a very simple idea. It uses the principle that if the price of the XAUUSD asset rises above a specified range of at least 600 points (configuarable) continuously, and a candle breaks the upward trend, a signal will be generated to sell. The entry principle is to enter at the price at the last bullish candle with TP300 SL300.
On the other hand, if the price of xauusd falls below the specified level of 600 points and a candle breaks the price down by 1 candle, a BUY signal will occur, and the ENTRY and TP SL will use the same values as the SELL signalใ
How it works:
SELL SIGNAL : When the asset price rises above 600 points continuously and a "SELL" signal occurs, place a limit sell order at the pair of green and red bars that formed the signal, specifying a TP of 300 and SL of 300.
BUY SIGNAL : When the asset price falls more than 600 points continuously and a "BUY" signal occurs, place a limit sell order at the double bar pattern of the red and green bars that formed the signal, specifying a TP of 300 and a SL of 300.
Disclaimer: This script is for educational purposes only. It does not constitute financial advice. Always do your own research before making trading decisions.
NOTE: For certain XAUUSD of certain broker (for instance XAUUSD on OANDA), the signal might found to often, just multiple the threshold by 10, then 600 will be come 6000

STOCK SCHOOL | FVGThe Stock School FVG Indicator is designed to help traders identify and trade Fair Value Gaps (FVGs) and Inverse FVGs (IFVGs) with precision.
Built for both intraday and swing traders, this tool highlights high-probability trading zones where institutions leave imbalances in the market.
✨ Key Features:
Auto-detects FVGs & IFVGs in real-time
Works on all timeframes and instruments (Nifty, BankNifty, Stocks, Forex, Crypto)
Non-repainting logic for reliable signals
Clean and easy-to-use interface with Stock School styling
Perfect for Smart Money Concept (SMC) traders
🚀 With this indicator, you can:
Spot institutional footprints quickly
Combine with BOS, CHoCH, Order Blocks for high accuracy
Trade liquidity sweeps + FVG collisions with confidence
💡 Disclaimer:
This indicator is for educational purposes only. Trading involves risk. Always use proper risk management.

Bot Analyzer📌 Script Name: Bot Analyzer
This TradingView Pine Script v5 indicator creates a dashboard table on the chart that helps you analyze any asset for running a martingale grid bot on futures.
🔧 User Inputs
TP % (tpPct): Take Profit percentage.
SO step % (soStepPct): Step size between safety orders.
SO n (soCount): Number of safety orders.
M mult (martMult): Martingale multiplier (how much each next order increases in size).
Lev (leverage): Leverage used in futures.
BB len / BB mult: Bollinger Bands settings for measuring channel width.
ATR len: ATR period for volatility.
HV days: Lookback window (days) for Historical Volatility calculation.
📐 Calculations
ATR % (atrPct): Normalized ATR relative to price.
Bollinger Band width % (bbPct): Market channel width as percentage of basis.
Historical Volatility (hvAnn): Annualized volatility, calculated from daily log returns.
Dynamic Step % (dynStepPct): Step size for safety orders, automatically adjusted from ATR and clamped between 0.3% and 5%.
Covered Move % (coveredPct): Total percentage move the bot can withstand before last safety order.
Martingale Size Factor (sizeFactor): Total position size multiplier after all safety orders, based on martingale multiplier.
Risk Score (riskLabel): Simple risk estimate:
Low if risk < 30
Mid if risk < 60
High if risk ≥ 60
📊 Output (Table on Chart)
At the top-right of the chart, the script draws a table with 9 rows:
Metric Value
BB % Bollinger Band width in %
HV % Historical Volatility (annualized %)
TP % Take profit setting
SO step % Safety order step size
SO n Number of safety orders
M mult Martingale multiplier
Dyn step % Dynamic step based on ATR
Size x Total position size factor (e.g., 4.5x)
Risk Risk label (Low / Mid / High)
⚙️ Use Case
Helps choose coins for a martingale bot:
If BB% is wide and HV% is high → the asset is volatile enough.
If Risk shows "High" → parameters are aggressive, you may need to adjust step size, SO count, or leverage.
The dashboard lets you compare assets quickly without switching between multiple indicators.

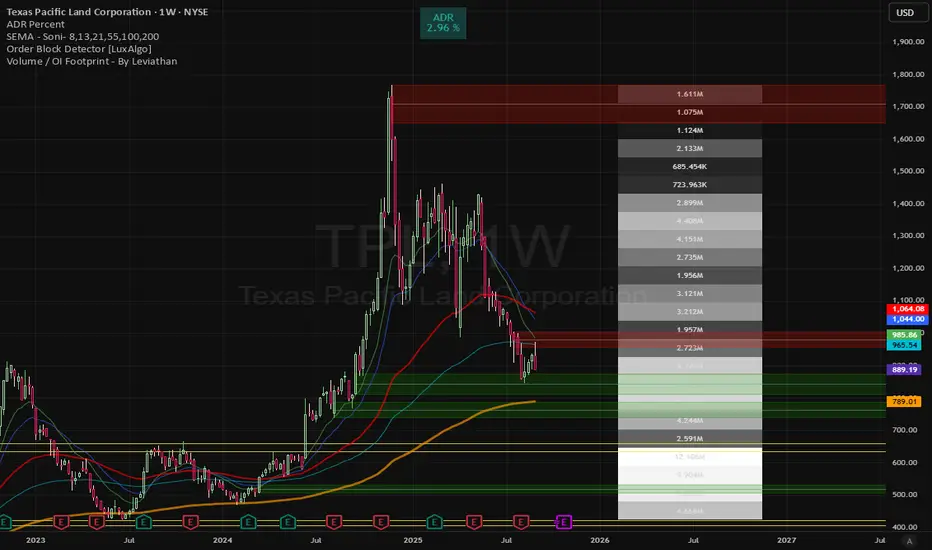
Volume gaps Volume gaps (white-highlighted zones) are unfinished business in the market. Mark them between low–high, and expect price to revisit them. They’re excellent targets for mean reversion trades and confluence levels for continuation setups
TRAPPER TRENDLINES — RSIBuilds dynamic RSI trendlines by connecting the two most recent confirmed RSI swing points (highs→highs for resistance, lows→lows for support). Includes optional channel shading for the 30–70 zone, an RSI moving average, clean break alerts, and simple bullish/bearish divergence alerts versus price.
How it works
RSI pivots: A point on RSI is a swing high/low only if it is the most extreme value compared with a set number of bars on the left and the right (the Pivot Lookback).
RSI trendlines:
Resistance connects the last two confirmed RSI swing highs.
Support connects the last two confirmed RSI swing lows.
Lines can be Full Extend (update into the future) or Pivot Only.
Channel block: Optional fill of the 30–70 range for fast visual context.
Alerts:
Breaks of RSI support/resistance trendlines.
Basic bullish/bearish RSI divergences versus price pivots.
Inputs
RSI
RSI Length: Default 14 (standard).
Pivot Lookback: Bars to the left/right required to confirm an RSI swing.
Overbought / Oversold: 70 / 30 by default.
Line Extension: Full Extend or Pivot Only.
Visuals
Show RSI Moving Average / Signal Length: Optional smoothing line on RSI.
RSI/Signal colors: Customize plot colors.
Show 30–70 Channel Block: Toggle the middle-zone fill.
Tint pane background when RSI in channel: Optional subtle background when RSI is between OB/OS.
Divergences & Alerts
Enable RSI TL Break Alerts: Alert conditions for RSI line breaks.
Enable Divergence Alerts: Bullish/Bearish divergence alerts versus price.
Pairing with price for confluence/divergence
For accurate confluence and clearer divergences, align this RSI tool with your price trendline tool (for example, TRAPPER TRENDLINES — PRICE):
Set RSI Pivot Lookback equal to the Pivot Left/Right size used on price.
Example: Price uses Pivot Left = 50 and Pivot Right = 50 → set RSI Pivot Lookback = 50.
Keep RSI Length = 14 and OB/OS = 70/30 unless you have a specific edge.
Interpretation:
Confluence: Price reacts at its trendline while RSI reacts at its own line in the same direction.
Divergence: Price makes a higher high while RSI makes a lower high (bearish), or price makes a lower low while RSI makes a higher low (bullish), using matched pivot windows.
Suggested settings
Higher timeframes (4H / 1D / 1W): Pivot Lookback = 50; optional RSI MA length 14; channel block ON.
Intraday (15m / 30m / 1H): Pivot Lookback = 30; optional RSI MA length 14.
Always mirror your price pivot size to this RSI Pivot Lookback for consistent swings.
Reading the signals
RSI trendline touch/hold: Momentum reacting at structure; look for confluence with price levels.
RSI Trendline Break Up / Down: Momentum shift; consider price structure and retests.
Bullish/Bearish Divergence: Confirm only when pivots are matched and the new swing is confirmed.
Notes & limitations
Pivots require future bars to confirm by design; trendlines update as new swings confirm.
Divergence logic compares RSI pivots to price pivots with the same lookback; mismatched windows can produce false positives.
No strategy entries/exits or performance claims are provided. This is an analytical tool.
Alerts (titles/messages)
RSI: Trendline Break Up — “RSI broke falling resistance line.”
RSI: Trendline Break Down — “RSI broke rising support line.”
RSI: Bullish Divergence — “Bullish RSI divergence confirmed.”
RSI: Bearish Divergence — “Bearish RSI divergence confirmed.”
Quick start
Add the indicator to a separate pane.
Set Pivot Lookback to match your price tool’s pivot size (e.g., 50).
Optionally toggle the RSI MA and Channel Block for clarity.
Enable alerts if you want notifications on RSI line breaks and divergences.
Use with TRAPPER TRENDLINES — PRICE or any price-based trendline tool for confluence/divergence analysis.
Compliance
This script is for educational purposes only and does not constitute financial advice. Trading involves risk. Past performance does not guarantee future results. No performance claims are made.

Zenova1. Key Levels (Daily Reference Levels)
Previous Day High
Previous Day Low
Midpoint = (High + Low) ÷ 2
These are plotted with clouds:
Green fill above Mid (High → Mid).
Red fill below Mid (Mid → Low).
Midpoint is shown as a yellow cross line.
Only today’s levels are shown (current day only).
2. Indicators
RSI (14)
Z-Score (lookback = 75 by default, configurable)
Z-Score Moving Average (SMA of Z-Score, same length as Z-Score lookback)
3. Daily Flags
Two internal “flags” are used to confirm reversal conditions:
hadOBAbove → set when RSI ≥ 70 and price is above Midline.
hadOSBelow → set when RSI ≤ 30 and price is below Midline.
These flags reset at the start of each new trading day.
4. Sell Reversal (Short Entry Signal)
A Sell Reversal is triggered when:
RSI previously went overbought (≥ 70) above the Midline.
RSI crosses below 50.
Current open price is above Midline.
Z-Score < Z-Score MA.
✅ If true → plot SELL REVERSAL (red triangle above bar).
5. Buy Reversal (Long Entry Signal)
A Buy Reversal is triggered when:
RSI previously went oversold (≤ 30) below the Midline.
RSI crosses above 50.
Current open price is below Midline.
Z-Score > Z-Score MA.
✅ If true → plot BUY REVERSAL (green triangle below bar).
6. Notes
Only one signal per OB/OS event (flags reset daily).
Works intraday, signals based on previous day levels.
No PSAR or IFZ in this version — this is the clean base.

TRAPPER TRENDLINES — PRICEDraws dynamic trendlines on price by connecting the two most recent confirmed swing points (highs to highs for resistance, lows to lows for support). Swings are defined with a symmetric left/right pivot window. Old anchors are ignored so lines stay attached to current structure. Optional break alerts are included.
How it works (plain language)
Pivots: A bar is a swing high (or low) only if it’s the most extreme point compared with a set number of bars on the left and the right.
Lines:
Support connects the last two confirmed swing lows.
Resistance connects the last two confirmed swing highs.
Lines can be extended right only or both left & right (toggle).
Recency filter: Only swings within the last N bars are kept. This avoids anchoring to very old pivots far from current price.
Alerts: Optional alerts fire when price closes above resistance or below support.
Inputs
Auto Settings
Auto pivot size by chart timeframe: When ON, the script picks a pivot size suitable for the current timeframe (you can scale it with Auto pivot multiplier). When OFF, the manual left/right inputs are used.
Auto pivot multiplier: Scales the auto pivot size (e.g., 1.5 makes pivots stricter).
Manual Pivots
Pivot Left / Pivot Right: Bars to the left/right required to confirm a swing. Example: Left=50 & Right=50 keeps only major swings.
Recency Filter
Use last N bars for pivots: Swings older than this window are discarded so trendlines stay relevant to current price.
Style
Support/Resistance color: Line colors.
Extend Left & Right: When ON, both endpoints extend; when OFF, lines extend to the right only.
Alerts
Enable Break Alerts: When ON, alert conditions are exposed:
Price: Break Up — close above resistance.
Price: Break Down — close below support.
Suggested settings
Higher timeframes (4H / 1D / 1W):
Manual: Pivot Left = 50, Pivot Right = 50, Use last N bars = 400–800.
Or enable Auto with Auto pivot multiplier = 1.0–1.5.
Intraday (15m / 30m / 1H):
Manual: Pivot Left = 30, Pivot Right = 30, Use last N bars = 300–500.
Or enable Auto with multiplier ≈ 1.0–1.2.
Pairing with RSI for confluence/divergence
This tool is designed to pair with a companion TRAPPER TRENDLINES — RSI (or any RSI trendline script):
To mirror swings, set RSI Pivot Lookback equal to the price Pivot Left/Right you use here.
Example: Price = 50/50 → RSI Pivot Lookback = 50.
Keep RSI at Length 14 with 70/30 channel for clarity.
Confluence: Price holds/rejects at a trendline while RSI trendline agrees.
Divergence: Price prints a higher high (resistance line rising) while RSI prints a lower high (RSI resistance line falling), or vice-versa for lows. Matching pivot windows makes these relationships clear and reduces false signals.
Reading the signals
Trendline touch/hold: Potential reaction area; wait for follow-through.
Break Up / Break Down (alerts): Close beyond the line. Consider retest behavior, higher-timeframe context, and volume/RSI confirmation.
Notes & limitations
Pivots require future bars to confirm (by design). Lines update as pivots confirm.
“Use last N bars” purposely ignores very old swings. Increase this value if you need legacy structure.
Lines are based on two most recent confirmed pivots per side; rapidly changing markets can replace anchors as new swings confirm.
This is a visual/analytical tool. No strategy entries/exits or performance claims are provided.
Compliance
This script is for educational purposes only and does not constitute financial advice. Trading involves risk. Past results do not guarantee future outcomes. No promises of profit, accuracy, or performance are made.
Alerts (titles/messages)
Price: Break Up — “Price broke above resistance trendline.”
Price: Break Down — “Price broke below support trendline.”
Quick start
Add the indicator to your chart.
Choose Auto or set Pivot Left/Right manually.
Set Use last N bars for how far back to consider swings.
Toggle Extend Left & Right to your preference.
(Optional) Add your RSI trendline indicator and match Pivot Lookback with your price pivot size for clean confluence/divergence.
Enable alerts if you want notifications on breaks.

Simplified Market ForecastSimplified Market Forecast Indicator
This indicator pairs nicely with the Contrarian 100 MA and can be located here:
Overview
The "Simplified Market Forecast" (SMF) indicator is a streamlined technical analysis tool designed for traders to identify potential buy and sell opportunities based on a momentum-based oscillator. By analyzing price movements relative to a defined lookback period, SMF generates clear buy and sell signals when the oscillator crosses customizable threshold levels. This indicator is versatile, suitable for various markets (e.g., forex, stocks, cryptocurrencies), and optimized for daily timeframes, though it can be adapted to other timeframes with proper testing. Its intuitive design and visual cues make it accessible for both novice and experienced traders.
How It Works
The SMF indicator calculates a momentum oscillator based on the price’s position within a specified range over a user-defined lookback period. It then smooths this value to reduce noise and plots the result as a line in a separate lower pane. Buy and sell signals are generated when the smoothed oscillator crosses above a user-defined buy level or below a user-defined sell level, respectively. These signals are visualized as triangles either on the main chart or in the lower pane, with a table displaying the current ticker and oscillator value for quick reference.
Key Components
Momentum Oscillator: The indicator measures the price’s position relative to the highest high and lowest low over a specified period, normalized to a 0–100 scale.
Signal Generation: Buy signals occur when the oscillator crosses above the buy level (default: 15), indicating potential oversold conditions. Sell signals occur when the oscillator crosses below the sell level (default: 85), suggesting potential overbought conditions.
Visual Aids: The indicator includes customizable horizontal lines for buy and sell levels, shaded zones for clarity, and a table showing the ticker and current oscillator value.
Mathematical Concepts
Oscillator Calculation: The indicator uses the following formula to compute the raw oscillator value:
c1I = close - lowest(low, medLen)
c2I = highest(high, medLen) - lowest(low, medLen)
fastK_I = (c1I / c2I) * 100
The result is smoothed using a 5-period Simple Moving Average (SMA) to produce the final oscillator value (inter).
Signal Logic:
A buy signal is triggered when the smoothed oscillator crosses above the buy level (ta.crossover(inter, buyLevel)).
A sell signal is triggered when the smoothed oscillator crosses below the sell level (ta.crossunder(inter, sellLevel)).
Entry and Exit Rules
Buy Signal (Blue Triangle): Triggered when the oscillator crosses above the buy level (default: 15), indicating a potential oversold condition and a buying opportunity. The signal appears as a blue triangle either below the price bar (if plotted on the main chart) or at the bottom of the lower pane.
Sell Signal (White Triangle): Triggered when the oscillator crosses below the sell level (default: 85), indicating a potential overbought condition and a selling opportunity. The signal appears as a white triangle either above the price bar (if plotted on the main chart) or at the top of the lower pane.
Exit Rules: Traders can exit positions when an opposite signal occurs (e.g., exit a buy on a sell signal) or based on additional technical analysis tools (e.g., support/resistance, trendlines). Always apply proper risk management.
Recommended Usage
The SMF indicator is optimized for the daily timeframe but can be adapted to other timeframes (e.g., 1H, 4H) with careful testing. It performs best in markets with clear momentum shifts, such as trending or range-bound conditions. Traders should:
Backtest the indicator on their chosen asset and timeframe to validate signal reliability.
Combine with other indicators (e.g., moving averages, support/resistance) or price action for confirmation.
Adjust the lookback period and buy/sell levels to suit market volatility and trading style.
Customization Options
Intermediate Length: Adjust the lookback period for the oscillator calculation (default: 31 bars).
Buy/Sell Levels: Customize the threshold levels for buy (default: 15) and sell (default: 85) signals.
Colors: Modify the colors of the oscillator line, buy/sell signals, and threshold lines.
Signal Display: Toggle whether signals appear on the main chart or in the lower pane.
Visual Aids: The indicator includes dotted horizontal lines at the buy (green) and sell (red) levels, with shaded zones between 0–buy level (green) and sell level–100 (red) for clarity.
Ticker Table: A table in the top-right corner displays the current ticker and oscillator value (in percentage), with customizable colors.
Why Use This Indicator?
The "Simplified Market Forecast" indicator provides a straightforward, momentum-based approach to identifying potential reversals in overbought or oversold markets. Its clear signals, customizable settings, and visual aids make it easy to integrate into various trading strategies. Whether you’re a swing trader or a day trader, SMF offers a reliable tool to enhance decision-making and improve market timing.
Tips for Users
Test the indicator thoroughly on your chosen asset and timeframe to optimize settings.
Use in conjunction with other technical tools for stronger trade confirmation.
Adjust the buy and sell levels based on market conditions (e.g., lower levels for less volatile markets).
Monitor the ticker table for real-time oscillator values to gauge market momentum.
Happy trading with the Simplified Market Forecast indicator!


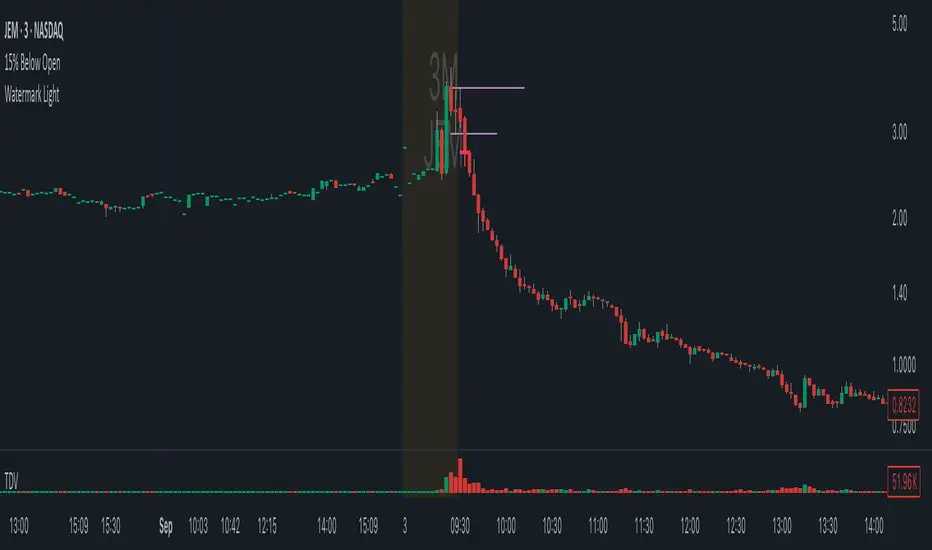
15% Below Open- plots first candle 15% below open
- plots a cross across the close of the candle once that condition is met
EMA Envelope + SMA + Purple DotThis indicator combines three tools into one:
📈 EMA Envelope with wedge and range contraction signals to highlight volatility squeezes.
🔵 SMA with optional smoothing (SMA/EMA/WMA/SMMA/VWMA) and optional Bollinger Bands.
🟣 Purple Dot “PowerBars” that mark strong momentum bars when price ROC (%) and volume exceed user-defined thresholds.
It also includes:
Background highlighting of contraction zones (bullish/bearish/neutral colors).
A summary table showing PowerBar count and return (%) over custom lookback periods.
Flexible display settings (table position, dark/light theme, highlight toggle).
Designed for traders who want to track momentum bursts, volatility contraction, and trend strength all in one tool.

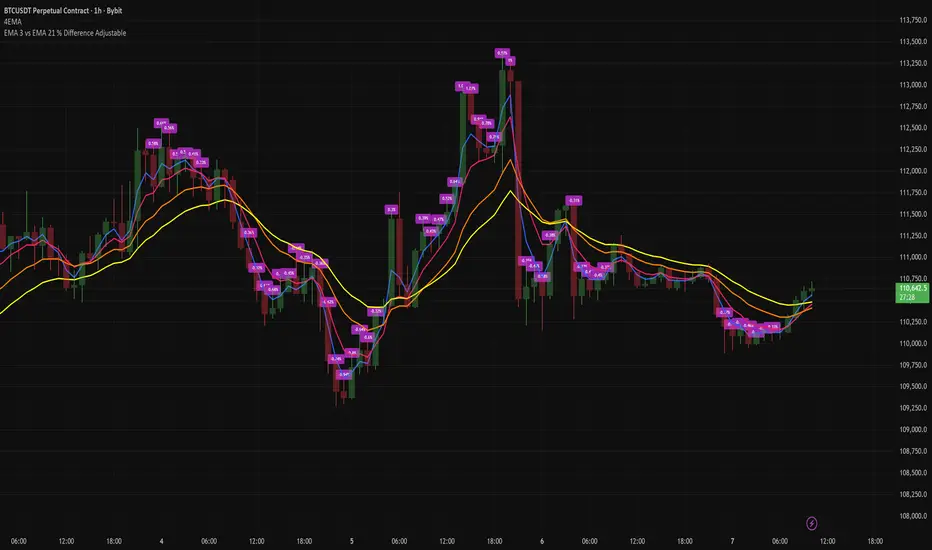
EMA 3 vs EMA 21 % Difference AdjustableTitle: EMA 3 vs EMA 21 % Difference with Adjustable Labels
Description:
This script calculates the percentage difference between EMA 3 and EMA 21 and displays it directly on the chart as a label. Labels are shown only when the difference exceeds a user-defined threshold, helping traders easily spot significant deviations.
Features:
Calculates EMA 3 and EMA 21.
Displays percentage difference as labels above or below candles.
Adjustable label style and size.
User-defined percentage threshold for label visibility.
Plots EMA lines for visual reference.
Ideal for traders who want to monitor short-term EMA divergence relative to a longer-term trend in a clean and customizable way.
[blackcat] L2 Trend LinearityOVERVIEW
The L2 Trend Linearity indicator is a sophisticated market analysis tool designed to help traders identify and visualize market trend linearity by analyzing price action relative to dynamic support and resistance zones. This powerful Pine Script indicator utilizes the Arnaud Legoux Moving Average (ALMA) algorithm to calculate weighted price calculations and generate dynamic support/resistance zones that adapt to changing market conditions. By visualizing market zones through colored candles and histograms, the indicator provides clear visual cues about market momentum and potential trading opportunities. The script generates buy/sell signals based on zone crossovers, making it an invaluable tool for both technical analysis and automated trading strategies. Whether you're a day trader, swing trader, or algorithmic trader, this indicator can help you identify market regimes, support/resistance levels, and potential entry/exit points with greater precision.
FEATURES
Dynamic Support/Resistance Zones: Calculates dynamic support (bear market zone) and resistance (bull market zone) using weighted price calculations and ALMA smoothing
Visual Market Representation: Color-coded candles and histograms provide immediate visual feedback about market conditions
Smart Signal Generation: Automatic buy/sell signals generated from zone crossovers with clear visual indicators
Customizable Parameters: Four different ALMA smoothing parameters for various timeframes and trading styles
Multi-Timeframe Compatibility: Works across different timeframes from 1-minute to weekly charts
Real-time Analysis: Provides instant feedback on market momentum and trend direction
Clear Visual Cues: Green candles indicate bullish momentum, red candles indicate bearish momentum, and white candles indicate neutral conditions
Histogram Visualization: Blue histogram shows bear market zone (below support), aqua histogram shows bull market zone (above resistance)
Signal Labels: "B" labels mark buy signals (price crosses above resistance), "S" labels mark sell signals (price crosses below support)
Overlay Functionality: Works as an overlay indicator without cluttering the chart with unnecessary elements
Highly Customizable: All parameters can be adjusted to suit different trading strategies and market conditions
HOW TO USE
Add the Indicator to Your Chart
Open TradingView and navigate to your desired trading instrument
Click on "Indicators" in the top menu and select "New"
Search for "L2 Trend Linearity" or paste the Pine Script code
Click "Add to Chart" to apply the indicator
Configure the Parameters
ALMA Length Short: Set the short-term smoothing parameter (default: 3). Lower values provide more responsive signals but may generate more false signals
ALMA Length Medium: Set the medium-term smoothing parameter (default: 5). This provides a balance between responsiveness and stability
ALMA Length Long: Set the long-term smoothing parameter (default: 13). Higher values provide more stable signals but with less responsiveness
ALMA Length Very Long: Set the very long-term smoothing parameter (default: 21). This provides the most stable support/resistance levels
Understand the Visual Elements
Green Candles: Indicate bullish momentum when price is above the bear market zone (support)
Red Candles: Indicate bearish momentum when price is below the bull market zone (resistance)
White Candles: Indicate neutral market conditions when price is between support and resistance zones
Blue Histogram: Shows bear market zone when price is below support level
Aqua Histogram: Shows bull market zone when price is above resistance level
"B" Labels: Mark buy signals when price crosses above resistance
"S" Labels: Mark sell signals when price crosses below support
Identify Market Regimes
Bullish Regime: Price consistently above resistance zone with green candles and aqua histogram
Bearish Regime: Price consistently below support zone with red candles and blue histogram
Neutral Regime: Price oscillating between support and resistance zones with white candles
Generate Trading Signals
Buy Signals: Look for price crossing above the bull market zone (resistance) with confirmation from green candles
Sell Signals: Look for price crossing below the bear market zone (support) with confirmation from red candles
Confirmation: Always wait for confirmation from candle color changes before entering trades
Optimize for Different Timeframes
Scalping: Use shorter ALMA lengths (3-5) for 1-5 minute charts
Day Trading: Use medium ALMA lengths (5-13) for 15-60 minute charts
Swing Trading: Use longer ALMA lengths (13-21) for 1-4 hour charts
Position Trading: Use very long ALMA lengths (21+) for daily and weekly charts
LIMITATIONS
Whipsaw Markets: The indicator may generate false signals in choppy, sideways markets where price oscillates rapidly between support and resistance
Lagging Nature: Like all moving average-based indicators, there is inherent lag in the calculations, which may result in delayed signals
Not a Standalone Tool: This indicator should be used in conjunction with other technical analysis tools and risk management strategies
Market Structure Dependency: Performance may vary depending on market structure and volatility conditions
Parameter Sensitivity: Different markets may require different parameter settings for optimal performance
No Volume Integration: The indicator does not incorporate volume data, which could provide additional confirmation signals
Limited Backtesting: Pine Script limitations may restrict comprehensive backtesting capabilities
Not Suitable for All Instruments: May perform differently on stocks, forex, crypto, and futures markets
Requires Confirmation: Signals should always be confirmed with other indicators or price action analysis
Not Predictive: The indicator identifies current market conditions but does not predict future price movements
NOTES
ALMA Algorithm: The indicator uses the Arnaud Legoux Moving Average (ALMA) algorithm, which is known for its excellent smoothing capabilities and reduced lag compared to traditional moving averages
Weighted Price Calculations: The bear market zone uses (2low + close) / 3, while the bull market zone uses (high + 2close) / 3, providing more weight to recent price action
Dynamic Zones: The support and resistance zones are dynamic and adapt to changing market conditions, making them more responsive than static levels
Color Psychology: The color scheme follows traditional trading psychology - green for bullish, red for bearish, and white for neutral
Signal Timing: The signals are generated on the close of each bar, ensuring they are based on complete price action
Label Positioning: Buy signals appear below the bar (red "B" label), while sell signals appear above the bar (green "S" label)
Multiple Timeframes: The indicator can be applied to multiple timeframes simultaneously for comprehensive analysis
Risk Management: Always use proper risk management techniques when trading based on indicator signals
Market Context: Consider the overall market context and trend direction when interpreting signals
Confirmation: Look for confirmation from other indicators or price action patterns before entering trades
Practice: Test the indicator on historical data before using it in live trading
Customization: Feel free to experiment with different parameter combinations to find what works best for your trading style
THANKS
Special thanks to the TradingView community and the Pine Script developers for creating such a powerful and flexible platform for technical analysis. This indicator builds upon the foundation of the ALMA algorithm and various moving average techniques developed by technical analysis pioneers. The concept of dynamic support and resistance zones has been refined over decades of market analysis, and this script represents a modern implementation of these timeless principles. We acknowledge the contributions of all traders and developers who have contributed to the evolution of technical analysis and continue to push the boundaries of what's possible with algorithmic trading tools.

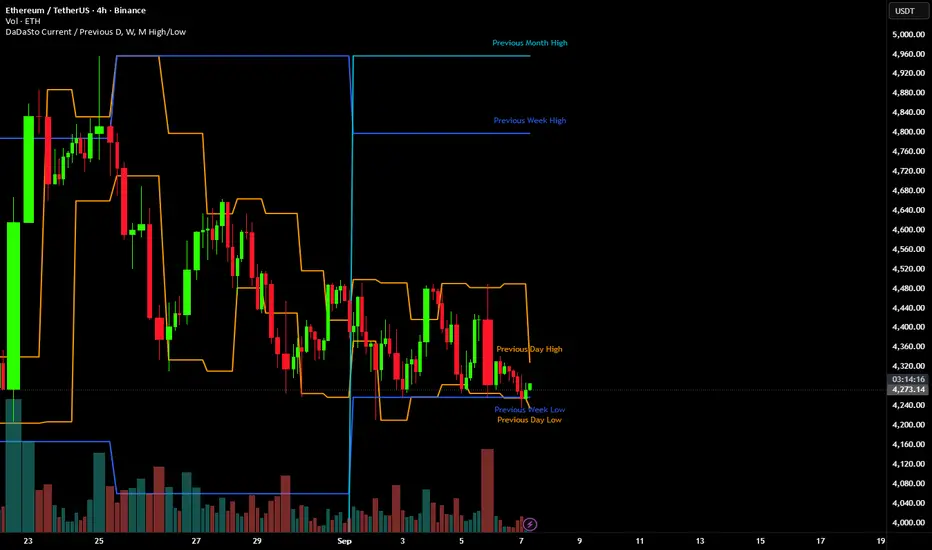
DaDaSto Current / Previous D, W, M High/Low
This script plots the current and previous Month/Week/Day High and Low. It allows for custom color and label inputs.
The original script credit to @The-Hunter
Theil-Sen Line Filter [BackQuant]Theil-Sen Line Filter
A robust, median-slope baseline that tracks price while resisting outliers. Designed for the chart pane as a clean, adaptive reference line with optional candle coloring and slope-flip alerts.
What this is
A trend filter that estimates the underlying slope of price using a Theil-Sen style median of past slopes, then advances a baseline by a controlled fraction of that slope each bar. The result is a smooth line that reacts to real directional change while staying calm through noise, gaps, and single-bar shocks.
Why Theil-Sen
Classical moving averages are sensitive to outliers and shape changes. Ordinary least squares is sensitive to large residuals. The Theil-Sen idea replaces a single fragile estimate with the median of many simple slopes, which is statistically robust and less influenced by a few extreme bars. That makes the baseline steadier in choppy conditions and cleaner around regime turns.
What it plots
Filtered baseline that advances by a fraction of the robust slope each bar.
Optional candle coloring by baseline slope sign for quick trend read.
Alerts when the baseline slope turns up or down.
How it behaves (high level)
Looks back over a fixed window and forms many “current vs past” bar-to-bar slopes.
Takes the median of those slopes to get a robust estimate for the bar.
Optionally caps the magnitude of that per-bar slope so a single volatile bar cannot yank the line.
Moves the baseline forward by a user-controlled fraction of the estimated slope. Lower fractions are smoother. Higher fractions are more responsive.
Inputs and what they do
Price Source — the series the filter tracks. Typical is close; HL2 or HLC3 can be smoother.
Window Length — how many bars to consider for slopes. Larger windows are steadier and slower. Smaller windows are quicker and noisier.
Response — fraction of the estimated slope applied each bar. 1.00 follows the robust slope closely; values below 1.00 dampen moves.
Slope Cap Mode — optional guardrail on each bar’s slope:
None — no cap.
ATR — cap scales with recent true range.
Percent — cap scales with price level.
Points — fixed absolute cap in price points.
ATR Length / Mult, Cap Percent, Cap Points — tune the chosen cap mode’s size.
UI Settings — show or hide the line, paint candles by slope, choose long and short colors.
How to read it
Up-slope baseline and green candles indicate a rising robust trend. Pullbacks that do not flip the slope often resolve in trend direction.
Down-slope baseline and red candles indicate a falling robust trend. Bounces against the slope are lower-probability until proven otherwise.
Flat or frequent flips suggest a range. Increase window length or decrease response if you want fewer whipsaws in sideways markets.
Use cases
Bias filter — only take longs when slope is up, shorts when slope is down. It is a simple way to gate faster setups.
Stop or trail reference — use the line as a trailing guide. If price closes beyond the line and the slope flips, consider reducing exposure.
Regime detector — widen the window on higher timeframes to define major up vs down regimes for asset rotation or risk toggles.
Noise control — enable a cap mode in very volatile symbols to retain the line’s continuity through event bars.
Tuning guidance
Quick swing trading — shorter window, higher response, optionally add a percent cap to keep it stable on large moves.
Position trading — longer window, moderate response. ATR cap tends to scale well across cycles.
Low-liquidity or gappy charts — prefer longer window and a points or ATR cap. That reduces jumpiness around discontinuities.
Alerts included
Theil-Sen Up Slope — baseline’s one-bar change crosses above zero.
Theil-Sen Down Slope — baseline’s one-bar change crosses below zero.
Strengths
Robust to outliers through median-based slope estimation.
Continuously advances with price rather than re-anchoring, which reduces lag at turns.
User-selectable slope caps to tame shock bars without over-smoothing everything.
Minimal visuals with optional candle painting for fast regime recognition.
Notes
This is a filter, not a trading system. It does not account for execution, spreads, or gaps. Pair it with entry logic, risk management, and higher-timeframe context if you plan to use it for decisions.
