ICT Macro H1 v2"H1 Candle Time Box" is a custom TradingView indicator that highlights a configurable time window surrounding the close of each 1-hour (H1) candle. The indicator draws a transparent box 15 minutes before and after each H1 candle close (by default), helping traders visualize time-based reaction zones.
🔍 Features:
Custom time window: Users can set how many minutes before and after the H1 close the box should appear.
Dynamic positioning: Boxes are drawn slightly above the candles to avoid overlap with price bars.
Live time labels: Each box displays its time range (e.g., "08:45 - 09:15") based on the start and end time of the zone.
Auto-cleaning: Only a limited number of recent boxes (default: 5) are shown, keeping the chart clean.
Requires 1-minute chart for precise timing.
This tool is especially helpful for intraday traders to identify areas of interest or market reactions before and after key hourly closes.
Indicators and strategies

Zonas de Compra y Venta ScalpingRIXAR, buy and sell zones in xauusdBUY
rixar, buy and sell zones in xauusd,
indicator for gold, where the red zone indicates sells and the green zone indicates buys.
indicator
.
.

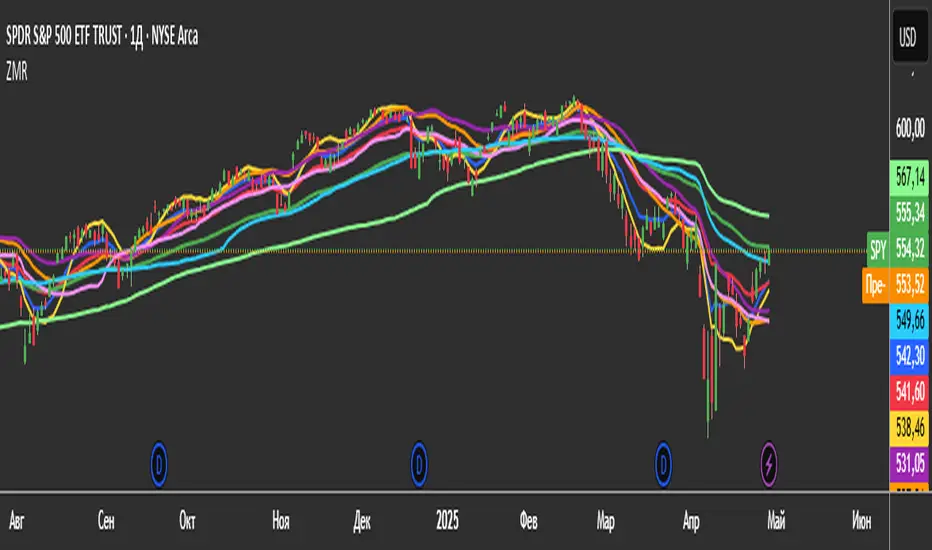
3 Zero Lag + 3 Moving Averages + 3 RVWAPThe "3 Zero Lag + 3 Moving Averages + 3 RVWAP" (ZMR) indicator combines three groups of tools for technical analysis.
1. Three Customizable Moving Averages (MAs):
Configuration for Each MA:
Choice of 7 types (SMA, EMA, WMA, HMA, VWMA, LSMA, SMMA).
Independent periods and price sources for each line.
Visualization:
MA1 (Blue), MA2 (Red), MA3 (Green).
2. Three Zero Lag EMAs (ZLEMA) with Individual Settings:
Lag Reduction: Corrects traditional EMA lag using:
Adjusted Price = 2 * Current Price - Price .
Flexibility:
Unique lengths (20, 50, 70) and individual price sources for each ZLEMA (HLC3, HL2, Close, etc.).
Colors:
ZLEMA1 (Yellow), ZLEMA2 (Orange), ZLEMA3 (Purple).
3. Three Rolling VWAPs with Custom Parameters:
Volume-Weighted Average Price (VWAP):
Calculated for three periods (20, 50, 100) with dedicated price sources for each VWAP.
Colors:
VWAP1 (Pink), VWAP2 (Light Blue), VWAP3 (Neon Green).

ICT Macro H1"H1 Candle Time Box" is a custom TradingView indicator that highlights a configurable time window surrounding the close of each 1-hour (H1) candle. The indicator draws a transparent box 15 minutes before and after each H1 candle close (by default), helping traders visualize time-based reaction zones.
🔍 Features:
Custom time window: Users can set how many minutes before and after the H1 close the box should appear.
Dynamic positioning: Boxes are drawn slightly above the candles to avoid overlap with price bars.
Live time labels: Each box displays its time range (e.g., "08:45 - 09:15") based on the start and end time of the zone.
Auto-cleaning: Only a limited number of recent boxes (default: 5) are shown, keeping the chart clean.
Requires 1-minute chart for precise timing.
This tool is especially helpful for intraday traders to identify areas of interest or market reactions before and after key hourly closes.

True Range Orginal📌 Description – True Range Original
This indicator calculates the range (price spread) of the last N candles and displays it directly on the chart, along with suggested dynamic stop-loss levels based on recent volatility. Ideal for scalpers and day traders working on short timeframes such as 1-minute charts.
🔍 Features:
Calculates the difference between the highest high and lowest low of the last N bars (default: 15).
Plots a floating label with the current range value, updated every 5 candles.
Displays 4 dynamic stop levels:
For long positions:
Stop at 1x range (green line)
Stop at 1.5x range (light green line)
For short positions:
Stop at 1x range (red line)
Stop at 1.5x range (dark red line)
⚙️ Inputs:
Range period (number of bars)
Stop multiplier 1 (default: 1.0)
Stop multiplier 2 (default: 1.5)
📈 Usage:
This tool helps you size your stop-loss dynamically based on recent price action instead of using fixed values. It can be used alone or in combination with other tools like support/resistance, volume, or aggression indicators.

[blackcat] L3 Ichimoku FusionCOMPREHENSIVE ANALYSIS OF THE L3 ICHIMOKU FUSION INDICATOR
🌐 Overview:
The L3 Ichimoku Fusion is a sophisticated multi-layered technical analysis tool integrating classic Japanese market forecasting techniques with enhanced dynamic elements designed specifically for identifying potential turning points in financial instruments' pricing action.
Key Purpose:
To provide traders with an intuitive yet powerful framework combining established ichimoku principles while incorporating additional validation checkpoints derived from cross-timeframe convergence studies.
THEORETICAL FOUNDATION EXPLAINED
🎓 Conceptual Background:
:
• Conversion & Base Lines tracking intermediate term averages
• Lagging Span providing delayed feedback mechanism
• Lead Spans projecting future equilibrium states
:
• Adaptive parameter scaling options
• Automated labeling system for critical junctures
• Real-time alert infrastructure enabling immediate response capability
PARAMETER CONFIGURATION GUIDE
⚙️ Input Parameters Explained In Detail:
Regional Setting Selection:**
→ Oriental Configuration: Standardized approach emphasizing slower oscillation cycles
→ Occidental Variation: Optimized settings reducing lag characteristics typical of original methodology
Multiplier Adjustment Functionality:**
↔ Allows fine-graining oscillator responsiveness without altering core relationship dynamics
↕ Enables adaptation to various instrument volatility profiles efficiently
Displacement Value Control:**
↓ Controls lead/lag offset positioning relative to current prices
↑ Provides flexibility in adjusting visual representation alignment preferences
DYNAMIC CALCULATION PROCESSES
💻 Algorithmic Foundation:
:
Utilizes highest/lowest extremes over specified lookback windows
Produces more responsive conversions compared to simple MAs
:
→ Confirms directional bias across multiple independent criteria
← Ensures higher probability outcomes reduce random noise influence
:
♾ Creates persistent annotations documenting significant events
🔄 Handles complex state transitions maintaining historical record integrity
VISUALIZATION COMPONENTS OVERVIEW
🎨 Display Architecture Details:
:
→ Solid colored trendlines representing conversion/base relationships
↑ Fill effect overlay differentiating expansion/compression phases
↔ Offset spans positioned according to calculated displacement values
:
→ Green shading indicates positive configuration scenarios
↘ Red filling highlights negative arrangement situations
⟳ Orange transition areas mark transitional periods requiring caution
:
✔️ LE: Long Entry opportunity confirmed
❌ SE: Short Setup validated
☑ XL/XS: Position closure triggers active
✓ RL/RS: Potential re-entry chances emerging
STRATEGIC APPLICATION FRAMEWORK
📋 Practical Deployment Guidelines:
Initial Integration Phase:
Select appropriate timeframe matching trading horizon preference
Configure input parameters aligning with target asset behavior traits
Test thoroughly under simulated conditions prior to live usage
Active Monitoring Procedures:
• Regular observation of cloud formation evolution
• Tracking label placements against actual price movements
• Noting pattern development leading up to signaled entry/exit moments
Decision Making Process Flowchart:
→ Identify clear breakout/crossover events exceeding confirmation thresholds
← Evaluate contextual factors supporting/rejecting indicated direction
↑ Execute trades only after achieving required number of confirming inputs
PERFORMANCE OPTIMIZATION TECHNIQUES
🚀 Refinement Strategies:
Calibration Optimization Approach:
→ Start testing with default suggested configurations
↓ Gradually adjust individual components observing outcome changes
↑ Document findings systematically building personalized version profile
Context Adaptability Methods:
➕ Add supplementary indicators enhancing overall reliability
➖ Remove unnecessary complexity layers if causing confusion
✨ Incorporate custom rules adapting to specific security behaviors
Efficiency Improvement Tactics:
🔧 Streamline redundant processing routines where possible
♻️ Leverage shared data streams whenever feasible
⚡ Optimize refresh frequencies balancing update speed vs computational load
RISK MITIGATION PROTOCOLS
🛡️ Safety Measures Implementation Guide:
Position Sizing Principles:
∅ Never exceed preset maximum exposure limits defined by risk tolerance
± Scale positions proportionally per account size/market capitalization
× Include slippage allowances within planning stages accounting for liquidity variations
Validation Requirements Hierarchy:
☐ Verify signals meet minimum number of concurrent validations
⛔ Ignore isolated occurrences lacking adequate evidence backing
▶ Look for convergent evidence strengthening conviction level
Emergency Response Planning:
↩ Establish predefined exit strategies including trailing stops mechanisms
🌀 Plan worst-case scenario responses ahead avoiding panic reactions
⇄ Maintain contingency plans addressing unexpected adverse developments
USER EXPERIENCE ENHANCEMENT FEATURES
🌟 Additional Utility Functions:
Alert System Infrastructure:
→ Automatic notifications delivered directly to user devices
↑ Message content customized explaining triggered condition specifics
↔ Timing optimization ensuring minimal missed opportunities due to latency issues
Historical Review Capability:
→ Ability to analyze past performance retrospectively
↓ Assess effectiveness across varying market regimes objectively
↗ Generate statistics measuring success/failure rates quantitatively
Community Collaboration Support:
↪ Share personal optimizations benefiting wider trader community
↔ Exchange experiences improving collective understanding base
✍️ Provide constructive feedback aiding ongoing refinement process
CONCLUSION AND NEXT STEPS
This comprehensive guide serves as your roadmap toward mastering the capabilities offered by the L3 Ichimoku Fusion indicator effectively. Success relies heavily on disciplined application combined with continuous learning and adjustment processes throughout implementation journey.
Wishing you prosperous trading endeavors! 👋💰

ICT Macro H1"H1 Candle Time Box" is a custom TradingView indicator that highlights a configurable time window surrounding the close of each 1-hour (H1) candle. The indicator draws a transparent box 15 minutes before and after each H1 candle close (by default), helping traders visualize time-based reaction zones.
🔍 Features:
Custom time window: Users can set how many minutes before and after the H1 close the box should appear.
Dynamic positioning: Boxes are drawn slightly above the candles to avoid overlap with price bars.
Live time labels: Each box displays its time range (e.g., "08:45 - 09:15") based on the start and end time of the zone.
Auto-cleaning: Only a limited number of recent boxes (default: 5) are shown, keeping the chart clean.
Requires 1-minute chart for precise timing.
This tool is especially helpful for intraday traders to identify areas of interest or market reactions before and after key hourly closes.

Hộp thời gian quanh đóng nến H1"H1 Candle Time Box" is a custom TradingView indicator that highlights a configurable time window surrounding the close of each 1-hour (H1) candle. The indicator draws a transparent box 15 minutes before and after each H1 candle close (by default), helping traders visualize time-based reaction zones.
🔍 Features:
Custom time window: Users can set how many minutes before and after the H1 close the box should appear.
Dynamic positioning: Boxes are drawn slightly above the candles to avoid overlap with price bars.
Live time labels: Each box displays its time range (e.g., "08:45 - 09:15") based on the start and end time of the zone.
Auto-cleaning: Only a limited number of recent boxes (default: 5) are shown, keeping the chart clean.
Requires 1-minute chart for precise timing.
This tool is especially helpful for intraday traders to identify areas of interest or market reactions before and after key hourly closes.

Volatility Regime Classifier | ATRP Percentile ZonesThis indicator helps you understand the current volatility environment of any asset by comparing recent ATR-based values to its historical range.
It defines four regimes:
🔴 Low Volatility: Volatility is decreasing
🟢 Normal: Volatility is increasing but still below average
🟠 High: Volatility is elevated
🟣 Extreme: Volatility is very high compared to recent history
⚙️ How it works
We calculate the Average True Range (ATR) as a percentage of price (ATRP), then compare a short-term ATR to a longer-term one. Their difference shows whether volatility is picking up or slowing down.
To make the signal more adaptive, we look at the distribution of recent volatility over a rolling window. We compute the 50th and 70th percentiles of that history to set dynamic thresholds.
About distribution & percentiles
Volatility in financial markets doesn't follow a normal (Gaussian) distribution, it's often skewed, with sudden spikes and fat tails. That means fixed thresholds (like "ATR > 20") can be misleading or irrelevant across assets and timeframes.
Using percentiles solves this:
The 50th percentile marks the middle of the recent volatility range.
The 70th percentile captures a zone where volatility is unusually high, but not too rare, which keeps the signal usable and not overly sensitive.
These levels offer a balance:
⚖️ not too reactive, not too slow — just enough to highlight meaningful shifts.
✅ Use cases
Spot changes in market conditions
Filter or adapt strategies depending on the regime
Adjust position sizing and risk dynamically

Small Cap Momentum Entry System✅ Features Included:
Momentum entry detection
Trailing stop overlay
Alert for entry and exit
Pre-market high line (optional display toggle)

Dual-Phase Trend Regime Oscillator (Zeiierman)█ Overview
Trend Regime: Dual-Phase Oscillator (Zeiierman) is a volatility-sensitive trend classification tool that dynamically switches between two oscillators, one optimized for low volatility, the other for high volatility.
By analyzing standard deviation-based volatility states and applying correlation-derived oscillators, this indicator reveals not only whether the market is trending but also what kind of trend regime it is in —Bullish or Bearish —and how that regime reacts to market volatility.
█ Its Uniqueness
Most trend indicators assume a static market environment; they don't adjust their logic when the underlying volatility shifts. That often leads to false signals in choppy conditions or late entries in trending phases.
Trend Regime: Dual-Phase Oscillator solves this by introducing volatility-aware adaptability. It switches between a slow, stable oscillator in calm markets and a fast, reactive oscillator in volatile ones, ensuring the right sensitivity at the right time.
█ How It Works
⚪ Volatility State Engine
Calculates returns-based volatility using standard deviation of price change
Smooths the current volatility with a moving average
Builds a volatility history window and performs median clustering to determine typical "Low" and "High" volatility zones
Dynamically assigns the chart to one of two internal volatility regimes: Low or High
⚪ Dual Oscillators
In Low Volatility, it uses a Slow Trend Oscillator (longer lookback, smoother)
In High Volatility, it switches to a Fast Trend Oscillator (shorter lookback, responsive)
Both oscillators use price-time correlation as a measure of directional strength
The output is normalized between 0 and 1, allowing for consistent interpretation
⚪ Trend Regime Classification
The active oscillator is compared to a neutral threshold (0.5)
If above: Bullish Regime, if below: Bearish Regime, else: Neutral
The background and markers update to reflect regime changes visually
Triangle markers highlight bullish/bearish regime shifts
█ How to Use
⚪ Identify Current Trend Regime
Use the background color and chart table to immediately recognize whether the market is trending up or down.
⚪ Trade Regime Shifts
Use triangle markers (▲ / ▼) to spot fresh regime entries, which are ideal for confirming breakouts within trends.
⚪ Pullback Trading
Look for pullbacks when the trend is in a stable condition and the slow oscillator remains consistently near the upper or lower threshold. Watch for moments when the fast oscillator retraces back toward the midline, or slightly above/below it — this often signals a potential pullback entry in the direction of the prevailing trend.
█ Settings Explained
Length (Slow Trend Oscillator) – Used in calm conditions. Longer = smoother signals
Length (Fast Trend Oscillator) – Used in volatile conditions. Shorter = more responsive
Volatility Refit Interval – Controls how often the system recalculates Low/High volatility levels
Current Volatility Period – Lookback used for immediate volatility measurement
Volatility Smoothing Length – Applies an SMA to the raw volatility to reduce noise
-----------------
Disclaimer
The content provided in my scripts, indicators, ideas, algorithms, and systems is for educational and informational purposes only. It does not constitute financial advice, investment recommendations, or a solicitation to buy or sell any financial instruments. I will not accept liability for any loss or damage, including without limitation any loss of profit, which may arise directly or indirectly from the use of or reliance on such information.
All investments involve risk, and the past performance of a security, industry, sector, market, financial product, trading strategy, backtest, or individual's trading does not guarantee future results or returns. Investors are fully responsible for any investment decisions they make. Such decisions should be based solely on an evaluation of their financial circumstances, investment objectives, risk tolerance, and liquidity needs.

1-Candle Order Block DetectorThis simple indicator is based on the 1-Candle rule. During an impulsive move toward the upside or downside, an order block is plotted based on a single down-closed or up-closed candle.
Inputs can be easily customized based on preferences or strength of trend filtering.

Premium Lux AlgoCombining multiple indicators to receive buy and sell signals and create support and resistance levels and cloud space

Global Liquidity IndexThis indicator tracks worldwide liquidity by aggregating the sum of the global M2 money supply, and major central bank balance sheets and subtracting the U.S. Treasury General Account (TGA), the Federal Reserve’s Reverse Repo (RRP) facility. It offers insight into the overall liquidity environment, often a key driver of risk asset performance.

Custom MACD//@version=5
indicator("Custom MACD", overlay=false)
fastLength = input.int(8, title="Fast EMA Length")
slowLength = input.int(21, title="Slow EMA Length")
signalSmoothing = input.int(5, title="Signal Smoothing")
= ta.macd(close, fastLength, slowLength, signalSmoothing)
plot(macdLine, color=color.blue, title="MACD Line")
plot(signalLine, color=color.red, title="Signal Line")
plot(histLine, style=plot.style_histogram, color=histLine >= 0 ? color.green : color.red, title="Histogram")

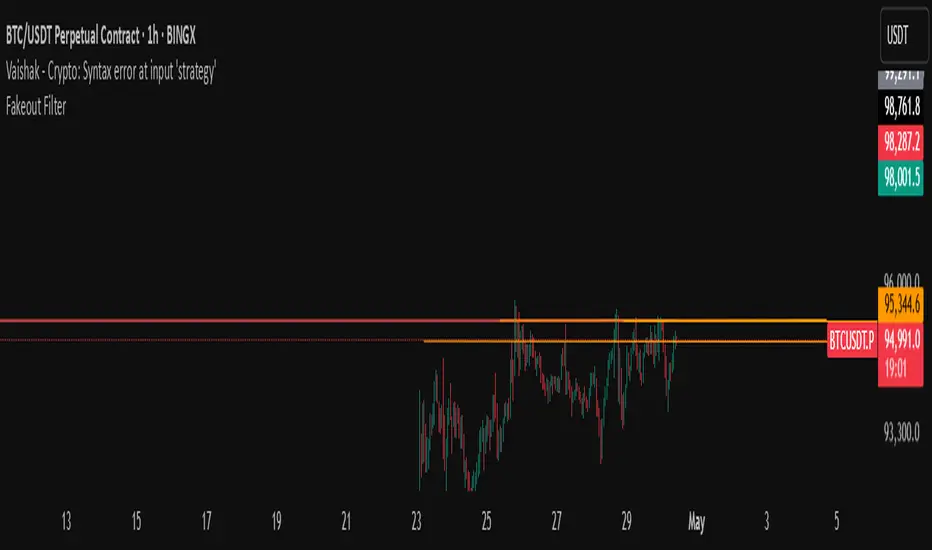
Fakeout Filter📈 Fakeout Filter by ARV
🔍 Overview:
The Fakeout Filter is a smart breakout validation tool designed to help traders avoid false breakouts and focus only on high-probability breakout trades. This indicator combines price action, volume analysis, RSI divergence detection, and OBV trend confirmation to filter out noise and improve your entries.
⚙️ Key Features:
✅ Breakout Detection
Detects when the price closes above a user-defined resistance level.
✅ Volume Spike Confirmation
Confirms breakouts only if there’s a significant increase in volume (customizable via settings).
✅ RSI Bearish Divergence Filter
Warns you of bearish RSI divergence, which often signals fakeouts during breakouts.
✅ OBV Trend Confirmation
Ensures On-Balance Volume (OBV) is rising, aligning volume flow with price movement.
✅ EMA Filter (Trend Confirmation)
Adds a safety filter using Exponential Moving Average (EMA) to ensure price action aligns with the short-term trend.
📌 How to Use:
Set Resistance Level:
In the indicator settings, input a key resistance level (manual input based on your chart analysis).
Watch for Signals:
A green background and “Breakout” label appear when:
Price closes above the resistance.
Volume is significantly higher than average.
OBV is rising.
No bearish RSI divergence is detected.
Price is above the EMA (trend confirmation).
Entry Suggestion:
Consider entering long positions only when the breakout label appears.
For additional confirmation, wait for a retest of the resistance as support before entering.
🔧 Settings:
Resistance Level – Manually set the level you're watching.
Volume Multiplier – Adjusts sensitivity to volume spikes (default: 1.5x average).
RSI Period – RSI used for divergence detection (default: 14).
EMA Period – For trend direction confirmation (default: 21).
✅ Best Use Cases:
Scalpers and intraday traders avoiding fakeouts on 5m–1H timeframes.
Swing traders validating breakout setups.
BTC, ETH, and major altcoins in consolidation or breakout zones.
⚠️ Disclaimer:
This tool is for educational purposes only. Always combine it with your own market analysis and risk management.
3-Candle Pattern StrategyBuy Conditions:
Candle 2 bars ago: close > open
Previous candle: close < open
Current candle: close > open
Current candle: (high - close) < (high - low) * 0.15
Current candle: volume > previous volume
Sell Conditions:
Candle 2 bars ago: close < open
Previous candle: close > open
Current candle: close < open
Current candle: (close - low) < (high - low) * 0.15
Current candle: volume > previous volume

Vol Spike + Super Trend by Ralpinoy
DESCRIPTION:
A combination of trend indicators in one with and Volume Spikes and some personal touch
A trend-following band built off w ATR. When price closes above the upper band, it flips “Bullish,” and when it closes below the lower band, it flips “Bearish.”
Always remember that the Green Band (UP trending) "TATAAS ang price in Tagalog" then when the Red band its (DOWN Trending) "PAGBABA".
Buy signal when the band flips from red → green; Sell signal when it flips green → red.
Flags bars where volume is “X times” above its moving average.
Additional filters (local highs/lows, hammer/shooter candles, same-color closes) let you only highlight truly significant volume bursts.
Bullish spike = orange circle below bar; Bearish spike = orange circle above bar.
HOW DOES THIS WORKS
ATR & Bands:
The script computes a smoothed ATR.
Upper band = (HL2 − Multiplier·ATR), Lower band = (HL2 + Multiplier·ATR).
Bands “trail” price, flipping direction only on a clear close beyond them—this helps keep you in strong trends and avoids whipsaws.
TREND LOGIC
A simple state variable (trend) holds +1 or –1.
When price closes above the prior lower-band, trend flips to +1; when it closes below the prior upper-band, it flips to –1.
Volume Spike Logic:
volume > MA(volume)×Multiplier flags extreme activity.
Optional “only valid highs & lows,” “only hammers/shooters,” and “same-color” filters give you cleaner, more actionable spikes.
READING THE SIGNALS
Stay long while SuperTrend is green.
Stay short (or stay out of longs) while SuperTrend is red.
Entry Triggers
Buy: SuperTrend flips red→green and prints a “GREEN DOT” label on the band.
Sell: SuperTrend flips green→red and prints a “RED DOT” label.
Volume Spike Confluence
A bullish volume spike (circle below bar) near a SuperTrend flip adds conviction to a long entry.
A bearish volume spike near a down-trend flip adds conviction to a short.
Exits & Stops
A common stop-loss is just beyond the opposite SuperTrend band.
You can also exit when the SuperTrend flips back (i.e. you trade only from flip→next flip).
BEST PRACTICES AND APPLICATIONS
Timeframes: SuperTrend is reliable on 1 H, 4 H, Daily charts. On 1 min/5 min, increase the ATR period or multiplier to reduce noise.
Multipliers:
ATR Multiplier 2–3 for faster flips, 4–5 for more conservative signals.
Volume Multiplier 1.5–2 for catching strong spikes, higher for only extreme activity.
Load the script and toggle only the SuperTrend on. Watch how it trails price.
Activate volume spikes and see which bars light up—note whether they line up with trend flips.
Practice on a demo account: enter on the flip + a confirming volume spike, stop just beyond the opposite band, and target a multiple of your risk ex.x2 (just do it)
With this combo you get a visual, rules-based trend system plus a volume filter to help you catch powerful, momentum-backed moves.
Enjoy, and let me know how does it works for you! Dont be shy to like and comment this indicator, Ralpinoy

ICT Macro Zone Boxes w/ Individual H/L Tracking v3.1ICT Macro Zones (Grey Box Version
This indicator dynamically highlights key intraday time-based macro sessions using a clean, minimalistic grey box overlay, helping traders align with institutional trading cycles. Inspired by ICT (Inner Circle Trader) concepts, it tracks real-time highs and lows for each session and optionally extends the zone box after the session ends — making it a precision tool for intraday setups, order flow analysis, and macro-level liquidity sweeps.
### 🔍 **What It Does**
- Plots **six predefined macro sessions** used in Smart Money Concepts:
- AM Macro (09:50–10:10)
- London Close (10:50–11:10)
- Lunch Macro (11:30–13:30)
- PM Macro (14:50–15:10)
- London SB (03:00–04:00)
- PM SB (15:00–16:00)
- Each zone:
- **Tracks high and low dynamically** throughout the session.
- **Draws a consistent grey shaded box** to visualize price boundaries.
- **Displays a label** at the first bar of the session (optional).
- **Optionally extends** the box to the right after the session closes.
### 🧠 **How It Works**
- Uses Pine Script arrays to define each session’s time window, label, and color.
- Detects session entry using `time()` within a New York timezone context.
- High/Low values are updated per bar inside the session window.
- Once a session ends, the box is optionally closed and fixed in place.
- All visual zones use a standardized grey tone for clarity and consistency across charts.
### 🛠️ **Settings**
- **Shade Zone High→Low:** Enable/disable the grey macro box.
- **Extend Box After Session:** Keep the zone visible after it ends.
- **Show Entry Label:** Display a label at the start of each session.
### 🎯 **Why This Script is Unique**
Unlike basic session markers or colored backgrounds, this tool:
- Focuses on **macro moments of liquidity and reversal**, not just open/close times.
- Uses **per-session logic** to individually track price behavior inside key time windows.
- Supports **real-time high/low tracking and clean zone drawing**, ideal for Smart Money and ICT-style strategies.
Perfect — based on your list, here's a **bundle-style description** that not only explains the function of each script but also shows how they **work together** in a Smart Money/ICT workflow. This kind of cross-script explanation is exactly what TradingView wants to see to justify closed-source mashups or interdependent tools.
---
📚 ICT SMC Toolkit — Script Integration Guide
This set of advanced Smart Money Concept (SMC) tools is designed for traders who follow ICT-based methodologies, combining liquidity theory, time-based precision, and engineered confluences for high-probability trades. Each indicator is optimized to work both independently and synergistically, forming a comprehensive trading framework.
---
First FVG Custom Time Range
**Purpose:**
Plots the **first Fair Value Gap (FVG)** that appears within a defined session (e.g., NY Kill Zone, Custom range). Includes optional retest alerts.
**Best Used With:**
- Use with **ICT Macro Zones (Grey Box Version)** to isolate FVGs during high-probability times like AM Macro or PM SB.
- Combine with **Liquidity Levels** to assess whether FVGs form near swing points or liquidity voids.
---
ICT SMC Liquidity Grabs and OB s
**Purpose:**
Detects **liquidity grabs** (stop hunts above/below swing highs/lows) and **bullish/bearish order blocks**. Includes optional Fibonacci OTE levels for sniper entries.
**Best Used With:**
- Use with **ICT Turtle Soup (Reversal)** for confirmation after a liquidity grab.
- Combine with **Macro Zones** to catch order blocks forming inside timed macro windows.
- Match with **Smart Swing Levels** to confirm structure breaks before entry.
ICT SMC Liquidity Levels (Smart Swing Lows)
**Purpose:**
Automatically marks swing highs/lows based on user-defined lookbacks. Tracks whether those levels have been breached or respected.
**Best Used With:**
- Combine with **Turtle Soup** to detect if a swing level was swept, then reversed.
- Use with **Liquidity Grabs** to confirm a grab occurred at a meaningful structural point.
- Align with **Macro Zones** to understand when liquidity events occur within macro session timing.
ICT Turtle Soup (Liquidity Reversal)
**Purpose:**
Implements the classic ICT Turtle Soup model. Looks for swing failure and quick reversals after a liquidity sweep — ideal for catching traps.
Best Used With:
- Confirm with **Liquidity Grabs + OBs** to identify institutional activity at the reversal point.
- Use **Liquidity Levels** to ensure the reversal is happening at valid previous swing highs/lows.
- Amplify probability when pattern appears during **Macro Zones** or near the **First FVG**.
ICT Turtle Soup Ultimate V2
**Purpose:**
An enhanced, multi-layer version of the Turtle Soup setup that includes built-in liquidity checks, OTE levels, structure validation, and customizable visual output.
**Best Used With:**
- Use as an **entry signal generator** when other indicators (e.g., OBs, liquidity grabs) are aligned.
- Pair with **Macro Zones** for high-precision timing.
- Combine with **First FVG** to anticipate price rebalancing before explosive moves.
---
## 🧠 Workflow Example:
1. **Start with Macro Zones** to focus only on institutional trading windows.
2. Look for **Liquidity Grabs or Swing Sweeps** around key highs/lows.
3. Check for a **Turtle Soup Reversal** or **Order Block Reaction** near that level.
4. Confirm confluence with a **Fair Value Gap**.
5. Execute using the **OTE level** from the Liquidity Grabs + OB script.
---
Let me know which script you want to publish first — I’ll tailor its **individual TradingView description** and flag its ideal **“Best Used With” partners** to help users see the value in your ecosystem.

Price Change Sentiment Index [tradeviZion]Price Change Sentiment Index
A technical indicator that measures price changes relative to the day's range.
Indicator Overview
Normalizes price changes on a 0-100 scale
Uses a smoothing period for signal clarity
Shows potential overbought/oversold conditions
Inputs
Smoothing Period (default: 3)
Show Background Colors (on/off)
Overbought Level (default: 75)
Oversold Level (default: 25)
Reading the Indicator
Values above 75: Price change showing strong upward movement
Values below 25: Price change showing strong downward movement
Around 50: Neutral price movement
Technical Details
// Core calculation
changePct = (currClose - prevClose) / (high - low)
normalized = 50 + (changePct * 50)
smoothedNormalized = ta.sma(normalizedClamped, smoothingPeriod)
Usage Notes
Best used with other technical analysis tools
Adjustable smoothing period affects signal sensitivity
Background colors highlight extreme readings
Works on any timeframe
Settings Guide
Smoothing Period:
- Lower values (1-3): More responsive
- Higher values (5-10): Smoother output
Visual Settings: Toggle background colors
Levels: Adjust overbought/oversold thresholds
This indicator is a technical analysis tool. Please conduct your own research and testing before use.

AP_Ultimate CCI MTF v5**AP Ultimate CCI Multi-Timeframe Indicator**
*Track Commodity Channel Index trends across multiple timeframes in one view!*
**Overview:**
Adapted from ChrisMoody's popular RSI MTF concept, this enhanced version brings powerful multi-timeframe analysis to the CCI indicator. Perfect for traders who want to confirm trends across different time horizons without switching charts.
**Key Features:**
📈 **Dual CCI Analysis**
- Primary CCI (Default: 1H) + Secondary CCI (Default: 4H)
- Fully customizable timeframes for both indicators
- Independent length settings (14-50 periods recommended)
🚦 **Visual Trading Signals**
- Automatic Buy/Sell markers on crossovers
- 🟢 **B** Signals: When CCI crosses above -100 (Oversold reversal)
- 🔴 **S** Signals: When CCI crosses below +100 (Overbought reversal)
- Clean triangular markers at chart edges for clear visibility
🎨 **Customizable Visuals**
- Adjustable overbought/oversold levels (Default: ±100)
- Background highlights for extreme zones
- Modern color schemes with transparency control
- Optional zero line display
⚙️ **Technical Specs**
- Built in Pine Script v6
- Non-repainting calculations
- Timeframe-aware alerts support
- Optimized for all asset classes
**How to Use (my use case):**
1. Apply to 15M-4H charts for intraday trading
2. Default setup: Compare 1H vs 4H CCI
3. Look for confluence between timeframes:
- Strong trend = Both CCIs moving in same direction
- Reversal signal = Crossovers with volume confirmation
4. Combine with price action or support/resistance
**Why this Indicator:**
✅ Eliminates manual timeframe switching
✅ Identifies hidden divergences between time horizons
✅ Works equally well for stocks, forex, and crypto
✅ Perfect for momentum and mean-reversion strategies
*Pro Tip: Pair with volume indicators and moving averages for enhanced confirmation!*

Simple ScreenerThis is a basic easy to use screener.
In the code you will find an area with all the tickers and you can add your own it will look like this.
It uses the RSI, TSI, ADX, AND SUPER TREND! The code is open source if you would like to tinker and make it better with it. please message me if you have any questions or request.
s01 = input.symbol('AMD', group = 'Symbols', inline = 's01')
s02 = input.symbol('GOOG', group = 'Symbols', inline = 's02')
s03 = input.symbol('BKNG', group = 'Symbols', inline = 's03')
s04 = input.symbol('NIO', group = 'Symbols', inline = 's04')
s05 = input.symbol('NVDA', group = 'Symbols', inline = 's05')
s06 = input.symbol('SPY', group = 'Symbols', inline = 's06')
s07 = input.symbol('QQQ', group = 'Symbols', inline = 's07')
s08 = input.symbol('DIA', group = 'Symbols', inline = 's08')
s09 = input.symbol('IWM', group = 'Symbols', inline = 's09')
s10 = input.symbol('LCID', group = 'Symbols', inline = 's10')
s11 = input.symbol('PTON', group = 'Symbols', inline = 's11')
s12 = input.symbol('PLUG', group = 'Symbols', inline = 's12')
s13 = input.symbol('PLTR', group = 'Symbols', inline = 's13')
s14 = input.symbol('TSLA', group = 'Symbols', inline = 's14')
s15 = input.symbol('AMZN', group = 'Symbols', inline = 's15')
s16 = input.symbol('AAPL', group = 'Symbols', inline = 's16')
s17 = input.symbol('BA', group = 'Symbols', inline = 's17')
s18 = input.symbol('VXX', group = 'Symbols', inline = 's18')
s19 = input.symbol('OXY', group = 'Symbols', inline = 's19')
s20 = input.symbol('JNJ', group = 'Symbols', inline = 's20')
Just replace with the ticker that you would prefer!
