RSI DivergenceThe code originally belongs to Matthew J. Slabosz, the founder of Zen Trading (The Art of Trading). ✍️📈
👉 My contribution and improvement was adding a divergence line directly on the RSI chart.
Why? Because most people can’t confirm correctness just by reading the code. 🧑💻❌
They need to see it with their own eyes 👀✔️ — this prevents misinterpretation and makes divergences crystal clear.
✨ By adding these visual confirmations, the efficiency and usability of the code has been significantly enhanced. 🚀📊
Indicators and strategies

ICT Silver Bullet Zones (All Sessions, Custom Labels)CT Silver Bullet Zones
This indicator is designed for traders who follow the ICT *Silver Bullet* concept.
It automatically marks the **Silver Bullet window** (10:00–11:00 by default) across the **London, New York AM, New York PM, and Asia sessions**, with customizable settings for each session.
### Features:
* Separate adjustable time windows for **London, NY AM, NY PM, and Asia Silver Bullet sessions**.
* Colored session boxes with individual **opacity controls**.
* **Session labels placed at the top** of each zone, with customizable text size, color, and background opacity.
* Works on all timeframes and highlights only the Silver Bullet trading windows.
This tool is meant to help traders quickly identify ICT Silver Bullet opportunities in all major sessions without manual plotting.

GusteriTBL
time based liq
am salvat o copie de la OGDubsky, pentru a putea lucra ulterior pe aceasta

GC Checklist Signals (All TF, v6 • SR-safe • Clean blocks)GC (COMEX Gold) checklist strategy with a 3:1 reward-to-risk to your training bot. It enforces the following rules:
Heiken Ashi chart logic for color, wicks, and doji detection
100-EMA filter (only buys above / sells below)
Market structure: higher-low above EMA for buys; lower-high below EMA for sells (simple pivot check)
Clean pullback: at least 2 opposite-color candles; clean = no top wicks (buys) / no bottom wicks (sells)
Entry: on high-volume doji (body ≤ ~12% of range and volume ≥ last 1–3 candles), as soon as it closes
Stops: sell = above doji high; buy = below doji low

GC Checklist Signals (All Timeframes, v6)GC (COMEX Gold) checklist strategy with a 3:1 reward-to-risk to your training bot. It enforces your rules:
Heiken Ashi chart logic for color, wicks, and doji detection
100-EMA filter (only buys above / sells below)
Market structure: higher-low above EMA for buys; lower-high below EMA for sells (simple pivot check)
Clean pullback: at least 2 opposite-color candles; clean = no top wicks (buys) / no bottom wicks (sells)
Entry: on high-volume doji (body ≤ ~12% of range and volume ≥ last 1–3 candles), as soon as it closes
Stops: sell = above doji high; buy = below doji low

30s Opening Range with TargetsSimple 30 Second opening range with profit targets and adjustable fill transparency and profit targets

Volume SMA with Multiple Overlays in Separate PaneVolume plays a pivotal role in our trading. Stock market price movements are randam until and unless same is supported by volume. Voulme is the only leding indicator and can track instituitional activity.
This indicator analyses volume to indentify unsual volumes in the market. it draws there sma lines of last 1200 barrs as follows:
1. sma of 1200 bars represented by blue
2. sma of 1200 bars multiplied by 15, represented by red
3. sma of 1200 bars multiplied by 20, represented by black.
The clor codes and line width can be modified.

Chimera [theUltimator5]In myth, the chimera is an “impossible” hybrid—lion, goat, and serpent fused into one—striking to look at and formidable in presence. The word has come to mean a beautiful, improbable union of parts that shouldn’t work together, yet do.
Chimera is a dual-mode market context tool that blends a multi-input oscillator with classic ADX/DI trend strength, plus optional multi-timeframe “gap-line” tracking. Use it to visualize regime (trend vs. range), momentum swings around an adaptive midline, and higher timeframe (HTF) reference levels that auto-terminate on touch/cross.
Modes
1) Oscillator view
A smoothed composite of five common inputs—RSI, MACD (oscillator), Bollinger position, Stochastic, and an ATR/DI-weighted bias. Each is normalized to a comparable 0–100 style scale, averaged, and plotted as a candle-style oscillator (short vs. long smoothing, wickless for clarity). A dynamic midline with standard-deviation bands frames neutral → bearish/bullish zones. Colors ramp from neutral to your chosen Oversold/Overbought endpoints; consolidation can override to white.
Here is a description of the (5) signals used to calculate the sentiment oscillator:
RSI (14): Measures recent momentum by comparing average gains vs. losses. High = strength after advances; low = weakness after declines. (Z-score normalized to 0–100.)
MACD oscillator (12/26/9): Uses the difference between MACD and its signal (histogram) to gauge momentum shifts. Positive = bullish tilt; negative = bearish. (Z-score normalized.)
Bollinger Bands position (20, 2): Locates price within the bands (0–100 from lower → upper). Near upper suggests strength/expansion; near lower suggests weakness/contraction. (Then normalized.)
Stochastic (14, 3, 3): Shows where the close sits within the recent high-low range, smoothed via %D. Higher values = closes near highs; lower = near lows. (Scaled 0–100.)
ATR/DI composite (14): Volatility-weighted directional bias: (+DI − −DI) amplified by ATR as a % of price and its relative average. Positive = bullish pressure with volatility; negative = bearish. (Rank/scale normalized.)
All five are normalized and averaged into one composite, then smoothed (short/long) and compared to an adaptive midline with bands.
2) ADX view
Shows ADX, +DI, –DI with user-defined High Threshold. Transparency and color shift with regime. When ADX is strong, a directional “fire/ice” gradient fills the area between ADX and the high threshold, biased toward the dominant DI; when ADX is weak, a soft white fade highlights low-trend conditions.
HTF gap-line tracking (optional; both modes)
Detects “gap-like” reference levels after weak-trend consolidation flips into a sudden DI jump.
Anchors a line at the event bar’s open and auto-terminates upon first touch/cross (tick-size tolerance).
Auto-selects up to three higher timeframes suited to your chart resolution and prints non-overlapping lines with labels like 1H / 4H / 1D. Lower-priority duplicates are suppressed to reduce clutter.
Confirmation / repaint notes
Signals and lines finalize on bar close of the relevant timeframe.
HTF elements update only on the HTF bar close. During a forming bar they may appear transiently.
Line removal finalizes after the bar that produced the touch/cross closes.
Visual cues & effects
Oscillator candles: Open/High = long smoothing; Low/Close = short smoothing (no wicks).
Adaptive bands: Midline ± StdDev Multiplier × stdev of the blended series.
Consolidation tint: Optional white backdrop/candles when the consolidation condition is true (balance + low ADX).
Breakout VFX (optional): With strong DI/ADX and Bollinger breaks, renders a subtle “fire” flare above upper-band thrusts or “ice” shelf below lower-band thrusts.
Inputs (high-level)
Visual Style: Oscillator or ADX.
General (Oscillator): Lookback Period, Short/Long Smoothing, Standard Deviation Multiplier.
Color (Oscillator): Oversold/Overbought colors for gradient endpoints.
Plot (Oscillator): Show Candles, Show Slow MA Line, Show Individual Component (RSI/MACD/BB/Stoch/ATR).
Table (Oscillator): Show Information Table & position (compact dashboard of component values + status).
ADX / Gaps / VFX (both modes): ADX High Threshold, Highlight Backgrounds, Show Gap Labels, Visual Overlay Effects, and color choices for current-TF & HTF lines.
HTF selection: Automatic ladder (3 tiers) based on your chart timeframe.
Alerts (built-in)
Buy Signal – Primary: Oscillator exits oversold.
Sell Signal – Primary: Oscillator exits overbought.
Gap Fill Line Created (Any TF)
Gap Fill Line Terminated (Any TF)
ADX Crossed ABOVE/BELOW Low Threshold
ADX Crossed ABOVE/BELOW High Threshold
Consolidation Started
Alerts evaluate on the close of the relevant timeframe.
How to read it (quick guide)
Pick your lens: Oscillator for blended momentum around an adaptive midline; ADX for trend strength and DI skew.
Watch extremes & mean re-entries (Oscillator): Approaches to the top/bottom band show persistent momentum; returns toward the midline show normalization.
Check regime (ADX): Below Low = low-trend; above High = strong trend, with “fire/ice” bias toward +DI/–DI.
Track gap lines: Fresh labels mark new reference levels; lines auto-remove on first interaction. HTF lines add context but finalize only on HTF close.
The uniqueness from this indicator comes from multiple areas:
1. A unique multi-timeframe algorithm detects gap fill zones and plots them on the chart.
2. Visual effects for both visual modes were hand crafted to provide a visually stunning and intuitive interface.
3. The algorithm to determine sentiment uses a unique blend of weight and sensitivity adjustment to create a plot with elastic upper and lower bounds based off historical volatility and price action.

Market Order Risk CalculatorObviously the Long/Short Position tool does this, but when you are scalping, 10 - 15 seconds matters. What matters more than that is defined risk, you dont want your losses being scattered, 300 here 145 there, you want consistent risk to have consistent data.
What this does is when you are framing a trade, it provides a hands off tool that tells you exactly how many contracts to enter with, that way if you have bracket orders on, your stop will be exactly where you want it to be without going over your defined risk.

VPT-style Close-to-Close Indicator📈Cumulative momentum (close-to-close × rel. volume) | MA & Donchian optional | ⚡ Alerts
Key Features:
- Tracks cumulative price momentum using close-to-close changes weighted by relative volume.
- Optional smoothed line (SMA/EMA) to identify trend direction.
- Optional Donchian channels to detect potential breakouts and breakdowns.
- Includes alerts for:
- Moving average crosses (bullish/bearish)
- Local maxima/minima in cumulative momentum
- Donchian upper/lower channel breakouts
- Customizable inputs: smoothing length, channel lengths, scaling factor, and visibility toggles.
- Visual cues: line colors indicate momentum direction (green = up, red = down).
- Use Case: Quickly spot momentum shifts, trend direction, and breakout opportunities with clear alerts and visual cues.

Fractal FU//@version=5
indicator("Fractal FU", shorttitle="Fractal FU", overlay=true, max_labels_count=500)
// ===== Inputs
showBull = input.bool(true, "Show aligned bullish balls")
showBear = input.bool(true, "Show aligned bearish balls")
bullCol = input.color(color.blue, "Bull ball color")
bearCol = input.color(color.red, "Bear ball color")
ballSize = input.string("small", "Ball size", options= )
gateTo15 = input.bool(true, "Gate to 15m close (clean, fewer signals)")
showDebug = input.bool(false, "Show per-timeframe debug dots")
// ===== Helpers
// one-liner you asked for:
f_sig(res) => request.security(syminfo.tickerid, res, (high > high and low < low ) ? (close > open ? 1 : close < open ? -1 : 0) : 0, barmerge.gaps_off, barmerge.lookahead_off)
// Pull confirmed signals from each TF
sig1 = f_sig("1")
sig5 = f_sig("5")
sig10 = f_sig("10")
sig15 = f_sig("15")
// Alignment (all four agree)
bullAll = showBull and (sig1 == 1 and sig5 == 1 and sig10 == 1 and sig15 == 1)
bearAll = showBear and (sig1 == -1 and sig5 == -1 and sig10 == -1 and sig15 == -1)
// Emit control
emit15 = ta.change(time("15"))
emit = gateTo15 ? emit15 : barstate.isconfirmed // if not gated, show wherever alignment is true
// ===== Debug (tiny dots at bar to verify which TFs are firing)
plotshape(showDebug and sig1 == 1, title="1m bull", style=shape.circle, size=size.tiny, color=color.new(color.blue, 0), location=location.bottom)
plotshape(showDebug and sig5 == 1, title="5m bull", style=shape.circle, size=size.tiny, color=color.new(color.aqua, 0), location=location.bottom)
plotshape(showDebug and sig10 == 1, title="10m bull", style=shape.circle, size=size.tiny, color=color.new(color.teal, 0), location=location.bottom)
plotshape(showDebug and sig15 == 1, title="15m bull", style=shape.circle, size=size.tiny, color=color.new(color.navy, 0), location=location.bottom)
plotshape(showDebug and sig1 == -1, title="1m bear", style=shape.circle, size=size.tiny, color=color.new(color.red, 0), location=location.top)
plotshape(showDebug and sig5 == -1, title="5m bear", style=shape.circle, size=size.tiny, color=color.new(color.orange, 0), location=location.top)
plotshape(showDebug and sig10 == -1, title="10m bear", style=shape.circle, size=size.tiny, color=color.new(color.maroon, 0), location=location.top)
plotshape(showDebug and sig15 == -1, title="15m bear", style=shape.circle, size=size.tiny, color=color.new(color.purple, 0), location=location.top)
// ===== Markers (size must be const → gate each size)
off = gateTo15 ? -1 : 0 // when gated, place on the just-closed 15m bar
// ── Marker offset control stays the same ──
off2 = gateTo15 ? -1 : 0
// ── Bullish balls exactly at LOW ──
plot(bullAll and emit and ballSize == "tiny" ? low : na, title="Bullish tiny", style=plot.style_circles, color=bullCol, linewidth=1, offset=off2)
plot(bullAll and emit and ballSize == "small" ? low : na, title="Bullish small", style=plot.style_circles, color=bullCol, linewidth=2, offset=off2)
plot(bullAll and emit and ballSize == "normal" ? low : na, title="Bullish normal", style=plot.style_circles, color=bullCol, linewidth=3, offset=off2)
plot(bullAll and emit and ballSize == "large" ? low : na, title="Bullish large", style=plot.style_circles, color=bullCol, linewidth=4, offset=off2)
plot(bullAll and emit and ballSize == "huge" ? low : na, title="Bullish huge", style=plot.style_circles, color=bullCol, linewidth=5, offset=off2)
// ── Bearish balls exactly at HIGH ──
plot(bearAll and emit and ballSize == "tiny" ? high : na, title="Bearish tiny", style=plot.style_circles, color=bearCol, linewidth=1, offset=off2)
plot(bearAll and emit and ballSize == "small" ? high : na, title="Bearish small", style=plot.style_circles, color=bearCol, linewidth=2, offset=off2)
plot(bearAll and emit and ballSize == "normal" ? high : na, title="Bearish normal", style=plot.style_circles, color=bearCol, linewidth=3, offset=off2)
plot(bearAll and emit and ballSize == "large" ? high : na, title="Bearish large", style=plot.style_circles, color=bearCol, linewidth=4, offset=off2)
plot(bearAll and emit and ballSize == "huge" ? high : na, title="Bearish huge", style=plot.style_circles, color=bearCol, linewidth=5, offset=off2)
// Alerts
alertcondition(bullAll and emit, title="Aligned Bullish Outside (1/5/10/15)", message="Aligned bullish outside bar on 1/5/10/15m")
alertcondition(bearAll and emit, title="Aligned Bearish Outside (1/5/10/15)", message="Aligned bearish outside bar on 1/5/10/15m")
alertcondition((bullAll or bearAll) and emit, title="Aligned Any (1/5/10/15)", message="Aligned outside bar (bull or bear) on 1/5/10/15m")
BTCUSD Dual Thrust (1H)BTCUSD Dual Thrust (1H) — Indicator
Overview
The Dual Thrust is a classic breakout-type strategy designed to capture strong directional moves when markets show imbalance between buyers and sellers. This indicator adapts the method specifically for BTCUSD on the 1-Hour timeframe, showing dynamic Buy/Sell trigger levels and live signals.
Origin
The Dual Thrust system was originally introduced by Michael Vitucci and has been widely used in futures and high-volatility markets. It was designed as a day-trading breakout framework, where daily high/low and close data define the range for the next session’s trade triggers.
How it Works
Each new day, the indicator calculates a “breakout range” using daily price data.
Two trigger levels are projected from the daily open:
Buy Trigger: Open + Range × KUp
Sell Trigger: Open - Range × KDn
Range can be built from either:
Classic Dual Thrust formula: max(High - Close , Close - Low) over a lookback period, or
ATR-based range: for volatility-adaptive signals.
A LONG signal fires when price crosses above the Buy Trigger.
An EXIT signal fires when price crosses below the Sell Trigger.
Buy/Sell lines step forward across each intraday bar until recalculated at the next daily open.
Practical Use
Optimized for BTCUSD 1-Hour charts (crypto’s volatility provides stronger follow-through).
Use the Buy/Sell levels as dynamic breakout lines or as confluence with your own setups.
Alerts are built in, so you can receive notifications when a LONG or EXIT condition triggers.
Designed as an indicator only (not a backtest strategy).
Key Features
✅ Daily Buy/Sell trigger lines auto-calculated and forward-filled
✅ LONG / EXIT labels on signals
✅ Optional ATR mode for volatility regimes
✅ Optional bar coloring for easy visual scanning
✅ Alerts ready for live monitoring
⚡️ Tip: While this indicator highlights breakout opportunities, effectiveness can improve when combined with trend filters (e.g., 200-SMA) or when aligned with higher timeframe supply/demand zones.

Hidden Divergence with S/R & TP// This source code is subject to the terms of the Mozilla Public License 2.0 at mozilla.org
// © Gemini
// @version=5
// This indicator combines Hidden RSI Divergence with Support & Resistance detection
// and provides dynamic take-profit targets based on ATR. It also includes alerts.
indicator("Hidden Divergence with S/R & TP", overlay=true)
// === INPUTS ===
rsiLengthInput = input.int(14, "RSI Length", minval=1)
rsiSMALengthInput = input.int(5, "RSI SMA Length", minval=1)
pivotLookbackLeft = input.int(5, "Pivot Left Bars", minval=1)
pivotLookbackRight = input.int(5, "Pivot Right Bars", minval=1)
atrPeriodInput = input.int(14, "ATR Period", minval=1)
atrMultiplierTP1 = input.float(1.5, "TP1 ATR Multiplier", minval=0.1)
atrMultiplierTP2 = input.float(3.0, "TP2 ATR Multiplier", minval=0.1)
atrMultiplierTP3 = input.float(5.0, "TP3 ATR Multiplier", minval=0.1)
// === CALCULATIONS ===
// Calculate RSI and its SMA
rsiValue = ta.rsi(close, rsiLengthInput)
rsiSMA = ta.sma(rsiValue, rsiSMALengthInput)
// Calculate Average True Range for Take Profits
atrValue = ta.atr(atrPeriodInput)
// Identify pivot points for Support and Resistance
pivotLow = ta.pivotlow(pivotLookbackLeft, pivotLookbackRight)
pivotHigh = ta.pivothigh(pivotLookbackLeft, pivotLookbackRight)
// Define variables to track divergence and TP levels
var bool bullishDivergence = false
var bool bearishDivergence = false
var float tp1Buy = na
var float tp2Buy = na
var float tp3Buy = na
var float tp1Sell = na
var float tp2Sell = na
var float tp3Sell = na
// Reset divergence flags at each new bar
bullishDivergence := false
bearishDivergence := false
// === HIDDEN DIVERGENCE LOGIC ===
// Hidden Bullish Divergence (Higher low in price, lower low in RSI)
// Price makes a higher low, while RSI makes a lower low, suggesting trend continuation.
for i = 1 to 50 // Look back up to 50 bars for a confirmed pivot low
if not na(pivotLow ) and close < close and rsiValue < rsiValue
// Check if price is making a higher low than the pivot low, and RSI is making a lower low
if low > low and rsiValue < rsiValue
bullishDivergence := true
break // Exit loop once divergence is found
// Hidden Bearish Divergence (Lower high in price, higher high in RSI)
// Price makes a lower high, while RSI makes a higher high, suggesting trend continuation.
for i = 1 to 50 // Look back up to 50 bars for a confirmed pivot high
if not na(pivotHigh ) and close > close and rsiValue > rsiValue
// Check if price is making a lower high than the pivot high, and RSI is making a higher high
if high < high and rsiValue > rsiValue
bearishDivergence := true
break // Exit loop once divergence is found
// === SETTING TP LEVELS AND ALERTS ===
if bullishDivergence
buySignalPrice = low - atrValue * 0.5 // Entry below the low
tp1Buy := buySignalPrice + atrValue * atrMultiplierTP1
tp2Buy := buySignalPrice + atrValue * atrMultiplierTP2
tp3Buy := buySignalPrice + atrValue * atrMultiplierTP3
// Alert for buying signal
alert("Hidden Bullish Divergence Detected on " + syminfo.ticker + " - Buy Signal", alert.freq_once_per_bar_close)
else
tp1Buy := na
tp2Buy := na
tp3Buy := na
if bearishDivergence
sellSignalPrice = high + atrValue * 0.5 // Entry above the high
tp1Sell := sellSignalPrice - atrValue * atrMultiplierTP1
tp2Sell := sellSignalPrice - atrValue * atrMultiplierTP2
tp3Sell := sellSignalPrice - atrValue * atrMultiplierTP3
// Alert for selling signal
alert("Hidden Bearish Divergence Detected on " + syminfo.ticker + " - Sell Signal", alert.freq_once_per_bar_close)
else
tp1Sell := na
tp2Sell := na
tp3Sell := na
// === PLOTTING SIGNALS AND TAKE PROFITS ===
// Plotting shapes for buy/sell signals
plotshape(bullishDivergence, title="Buy Signal", style=shape.triangleup, location=location.belowbar, color=color.new(color.green, 0), text="Buy", textcolor=color.black)
plotshape(bearishDivergence, title="Sell Signal", style=shape.triangledown, location=location.abovebar, color=color.new(color.red, 0), text="Sell", textcolor=color.black)
// Plotting take-profit lines
plot(tp1Buy, "TP1 Buy", color=color.new(color.lime, 0), style=plot.style_linebr)
plot(tp2Buy, "TP2 Buy", color=color.new(color.lime, 0), style=plot.style_linebr)
plot(tp3Buy, "TP3 Buy", color=color.new(color.lime, 0), style=plot.style_linebr)
plot(tp1Sell, "TP1 Sell", color=color.new(color.orange, 0), style=plot.style_linebr)
plot(tp2Sell, "TP2 Sell", color=color.new(color.orange, 0), style=plot.style_linebr)
plot(tp3Sell, "TP3 Sell", color=color.new(color.orange, 0), style=plot.style_linebr)
// Plotting the RSI and its SMA on a sub-pane
plot(rsiValue, "RSI", color.new(color.fuchsia, 0))
plot(rsiSMA, "RSI SMA", color.new(color.yellow, 0))
hline(50, "50 Midline", color=color.new(color.gray, 50))
// Plotting background for signals
bullishColor = color.new(color.green, 90)
bearishColor = color.new(color.red, 90)
bgcolor(bullishDivergence ? bullishColor : na, title="Bullish Divergence Zone")
bgcolor(bearishDivergence ? bearishColor : na, title="Bearish Divergence Zone")
// === EXPLANATION OF CONCEPTS ===
// Deep Knowledge of Market from AI:
// This indicator is based on a powerful, yet often misunderstood, concept: divergence.
// While standard divergence signals a potential trend reversal, hidden divergence signals a
// continuation of the prevailing trend. This is crucial for traders who want to capitalize
// on the momentum of a move rather than trying to catch tops and bottoms.
// Hidden Bullish Divergence: Occurs in an uptrend when price makes a higher low, but the
// RSI makes a lower low. This suggests that while there was a brief period of weakness, the
// underlying buying pressure is returning to push the trend higher. It’s a "re-energizing"
// of the bullish momentum.
// Hidden Bearish Divergence: Occurs in a downtrend when price makes a lower high, but the
// RSI makes a higher high. This indicates that while the sellers paused, the underlying
// selling pressure remains strong and is likely to continue pushing the price down. It's a
// subtle signal that the bears are regaining control.
// Combining Divergence with S/R: The true power of this indicator comes from its
// "confluence" principle. A divergence signal alone can be noisy. By requiring it to occur
// at a key support or resistance level (identified using pivot points), we are filtering
// out weaker signals and only focusing on high-probability setups where the market is
// likely to respect a previous area of interest. This tells us that not only is the trend
// likely to continue, but it is doing so from a strategic, well-defined point on the chart.
// Dynamic Take-Profit Targets: The take-profit targets are based on the Average True Range (ATR).
// ATR is a measure of market volatility. Using it to set targets ensures that your profit
// levels are dynamic and adapt to current market conditions. In a volatile market, your
// targets will be wider, while in a calm market, they will be tighter, helping you avoid
// unrealistic expectations and improving your risk management.

Information Flow Analysis[b🔄 Information Flow Analysis: Systematic Multi-Component Market Analysis Framework
SYSTEM OVERVIEW AND ANALYTICAL FOUNDATION
The Information Flow Kernel - Hybrid combines established technical analysis methods into a unified analytical framework. This indicator systematically processes three distinct data streams - directional price momentum, volume-weighted pressure dynamics, and intrabar development patterns - integrating them through weighted mathematical fusion to produce statistically normalized market flow measurements.
COMPREHENSIVE MATHEMATICAL FRAMEWORK
Component 1: Directional Flow Analysis
The directional component analyzes price momentum through three mathematical vectors:
Price Vector: p = C - O (intrabar directional bias)
Momentum Vector: m = C_t - C_{t-1} (bar-to-bar velocity)
Acceleration Vector: a = m_t - m_{t-1} (momentum rate of change)
Directional Signal Integration:
S_d = \text{sgn}(p) \cdot |p| + \text{sgn}(m) \cdot |m| \cdot 0.6 + \text{sgn}(a) \cdot |a| \cdot 0.3
The signum function preserves directional information while absolute values provide magnitude weighting. Coefficients create a hierarchy emphasizing intrabar movement (100%), momentum (60%), and acceleration (30%).
Final Directional Output: K_1 = S_d \cdot w_d where w_d is the directional weight parameter.
Component 2: Volume-Weighted Pressure Analysis
Volume Normalization: r_v = \frac{V_t}{\overline{V_n}} where \overline{V_n} represents the n-period simple moving average of volume.
Base Pressure Calculation: P_{base} = \Delta C \cdot r_v \cdot w_v where \Delta C = C_t - C_{t-1} and w_v is the velocity weighting factor.
Volume Confirmation Function:
f(r_v) = \begin{cases}
1.4 & \text{if } r_v > 1.2 \
0.7 & \text{if } r_v < 0.8 \
1.0 & \text{otherwise}
\end{cases}
Final Pressure Output: K_2 = P_{base} \cdot f(r_v)
Component 3: Intrabar Development Analysis
Bar Position Calculation: B = \frac{C - L}{H - L} when H - L > 0 , else B = 0.5
Development Signal Function:
S_{dev} = \begin{cases}
2(B - 0.5) & \text{if } B > 0.6 \text{ or } B < 0.4 \
0 & \text{if } 0.4 \leq B \leq 0.6
\end{cases}
Final Development Output: K_3 = S_{dev} \cdot 0.4
Master Integration and Statistical Normalization
Weighted Component Fusion: F_{raw} = 0.5K_1 + 0.35K_2 + 0.15K_3
Sensitivity Scaling: F_{master} = F_{raw} \cdot s where s is the sensitivity parameter.
Statistical Normalization Process:
Rolling Mean: \mu_F = \frac{1}{n}\sum_{i=0}^{n-1} F_{master,t-i}
Rolling Standard Deviation: \sigma_F = \sqrt{\frac{1}{n}\sum_{i=0}^{n-1} (F_{master,t-i} - \mu_F)^2}
Z-Score Computation: z = \frac{F_{master} - \mu_F}{\sigma_F}
Boundary Enforcement: z_{bounded} = \max(-3, \min(3, z))
Final Normalization: N = \frac{z_{bounded}}{3}
Flow Metrics Calculation:
Intensity: I = |z|
Strength Percentage: S = \min(100, I \times 33.33)
Extreme Detection: \text{Extreme} = I > 2.0
DETAILED INPUT PARAMETER SPECIFICATIONS
Sensitivity (0.1 - 3.0, Default: 1.0)
Global amplification multiplier applied to the master flow calculation. Functions as: F_{master} = F_{raw} \cdot s
Low Settings (0.1 - 0.5): Enhanced precision for subtle market movements. Optimal for low-volatility environments, scalping strategies, and early detection of minor directional shifts. Increases responsiveness but may amplify noise.
Moderate Settings (0.6 - 1.2): Balanced sensitivity for standard market conditions across multiple timeframes.
High Settings (1.3 - 3.0): Reduced sensitivity to minor fluctuations while emphasizing significant flow changes. Ideal for high-volatility assets, trending markets, and longer timeframes.
Directional Weighting (0.1 - 1.0, Default: 0.7)
Controls emphasis on price direction versus volume and positioning factors. Applied as: K_{1,weighted} = K_1 \times w_d
Lower Values (0.1 - 0.4): Reduces directional bias, favoring volume-confirmed moves. Optimal for ranging markets where momentum may generate false signals.
Higher Values (0.7 - 1.0): Amplifies directional signals from price vectors and acceleration. Ideal for trending conditions where directional momentum drives price action.
Velocity Weighting (0.1 - 1.0, Default: 0.6)
Scales volume-confirmed price change impact. Applied in: P_{base} = \Delta C \times r_v \times w_v
Lower Values (0.1 - 0.4): Dampens volume spike influence, focusing on sustained pressure patterns. Suitable for illiquid assets or news-sensitive markets.
Higher Values (0.8 - 1.0): Amplifies high-volume directional moves. Optimal for liquid markets where volume provides reliable confirmation.
Volume Length (3 - 20, Default: 5)
Defines lookback period for volume averaging: \overline{V_n} = \frac{1}{n}\sum_{i=0}^{n-1} V_{t-i}
Short Periods (3 - 7): Responsive to recent volume shifts, excellent for intraday analysis.
Long Periods (13 - 20): Smoother averaging, better for swing trading and higher timeframes.
DASHBOARD SYSTEM
Primary Flow Gauge
Bilaterally symmetric visualization displaying normalized flow direction and intensity:
Segment Calculation: n_{active} = \lfloor |N| \times 15 \rfloor
Left Fill: Bearish flow when N < -0.01
Right Fill: Bullish flow when N > 0.01
Neutral Display: Empty segments when |N| \leq 0.01
Visual Style Options:
Matrix: Digital blocks (▰/▱) for quantitative precision
Wave: Progressive patterns (▁▂▃▄▅▆▇█) showing flow buildup
Dots: LED-style indicators (●/○) with intensity scaling
Blocks: Modern squares (■/□) for professional appearance
Pulse: Progressive markers (⎯ to █) emphasizing intensity buildup
Flow Intensity Visualization
30-segment horizontal bar graph with mathematical fill logic:
Segment Fill: For i \in : filled if \frac{i}{29} \leq \frac{S}{100}
Color Coding System:
Orange (S > 66%): High intensity, strong directional conviction
Cyan (33% ≤ S ≤ 66%): Moderate intensity, developing bias
White (S < 33%): Low intensity, neutral conditions
Extreme Detection Indicators
Circular markers flanking the gauge with state-dependent illumination:
Activation: I > 2.0 \land |N| > 0.3
Bright Yellow: Active extreme conditions
Dim Yellow: Normal conditions
Metrics Display
Balance Value: Raw master flow output ( F_{master} ) showing absolute directional pressure
Z-Score Value: Statistical deviation ( z_{bounded} ) indicating historical context
Dynamic Narrative System
Context-sensitive interpretation based on mathematical thresholds:
Extreme Flow: I > 2.0 \land |N| > 0.6
Moderate Flow: 0.3 < |N| \leq 0.6
High Volatility: S > 50 \land |N| \leq 0.3
Neutral State: S \leq 50 \land |N| \leq 0.3
ALERT SYSTEM SPECIFICATIONS
Mathematical Trigger Conditions:
Extreme Bullish: I > 2.0 \land N > 0.6
Extreme Bearish: I > 2.0 \land N < -0.6
High Intensity: S > 80
Bullish Shift: N_t > 0.3 \land N_{t-1} \leq 0.3
Bearish Shift: N_t < -0.3 \land N_{t-1} \geq -0.3
TECHNICAL IMPLEMENTATION AND PERFORMANCE
Computational Architecture
The system employs efficient calculation methods minimizing processing overhead:
Single-pass mathematical operations for all components
Conditional visual rendering (executed only on final bar)
Optimized array operations using direct calculations
Real-Time Processing
The indicator updates continuously during bar formation, providing immediate feedback on changing market conditions. Statistical normalization ensures consistent interpretation across varying market regimes.
Market Applicability
Optimal performance in liquid markets with consistent volume patterns. May require parameter adjustment for:
Low-volume or after-hours sessions
News-driven market conditions
Highly volatile cryptocurrency markets
Ranging versus trending market environments
PRACTICAL APPLICATION FRAMEWORK
Market State Classification
This indicator functions as a comprehensive market condition assessment tool providing:
Trend Analysis: High intensity readings ( S > 66% ) with sustained directional bias indicate strong trending conditions suitable for momentum strategies.
Reversal Detection: Extreme readings ( I > 2.0 ) at key technical levels may signal potential trend exhaustion or reversal points.
Range Identification: Low intensity with neutral flow ( S < 33%, |N| < 0.3 ) suggests ranging market conditions suitable for mean reversion strategies.
Volatility Assessment: High intensity without clear directional bias indicates elevated volatility with conflicting pressures.
Integration with Trading Systems
The normalized output range facilitates integration with automated trading systems and position sizing algorithms. The statistical basis provides consistent interpretation across different market conditions and asset classes.
LIMITATIONS AND CONSIDERATIONS
This indicator combines established technical analysis methods and processes historical data without predicting future price movements. The system performs optimally in liquid markets with consistent volume patterns and may produce false signals in thin trading conditions or during news-driven market events. This indicator is provided for educational and analytical purposes only and does not constitute financial advice. Users should combine this analysis with proper risk management, position sizing, and additional confirmation methods before making any trading decisions. Past performance does not guarantee future results.
Note: The term "kernel" in this context refers to modular calculation components rather than mathematical kernel functions in the formal computational sense.
As quantitative analyst Ralph Vince noted: "The essence of successful trading lies not in predicting market direction, but in the systematic processing of market information and the disciplined management of probability distributions."
— Dskyz, Trade with insight. Trade with anticipation.

ROAD200K Wickrange BarLaa umnuh laanii wick dotor haagdval
wick nii range ni uuruu sonirholiin bus bolj huvirdag

Gold ATR/VOLThis Strategy is not for you it shows Gold how the prices reacts to the ATR and RSI and EMI 20 / 50
ORB + SMA 20/50 Crossover BUY/SELL by Yuvaraj Veppampattu Plots ORB High & Low lines for the first X minutes.
Adds SMA 20 & SMA 50 lines on chart.
Shows BUY arrow when SMA20 crosses ABOVE SMA50.
Shows SELL arrow when SMA20 crosses BELOW SMA50.
Adds alerts for both ORB breakouts & SMA crossovers.

ORB + SMA + EMA + BUY/SELL by yuvaraj ORB (Opening Range Breakout)
Meaning:
ORB stands for Opening Range Breakout.
It is a trading strategy where you watch the price movement for the first few minutes after the market opens (for example, 9:15 – 9:30 AM in India).
You mark the high and low during this period.
If price goes above the high, it signals a possible buy (long trade).
If price goes below the low, it signals a possible sell (short trade).
Why traders use it:
First few minutes decide the market direction.
Helps catch early momentum trades.
Very popular for intraday traders (Nifty, BankNifty, Crude Oil, etc.).
Example:
Market opens at 9:15.
First 5 minutes: High = 100, Low = 95.
If price moves above 100 → Buy.
If price moves below 95 → Sell.
📌 SMA (Simple Moving Average)
Meaning:
SMA stands for Simple Moving Average.
It is the average closing price of a stock over a certain number of candles.
Example:
SMA 9 → Average price of last 9 candles.
SMA 50 → Average price of last 50 candles.
Why traders use it:
Shows trend direction.
SMA going up → Uptrend, SMA going down → Downtrend.
You can use multiple SMAs (for example SMA 9 and SMA 50):
If SMA 9 crosses above SMA 50 → Buy signal.
If SMA 9 crosses below SMA 50 → Sell signal.
🔑 Key Difference:
Feature ORB SMA
Type Strategy (price breakout) Indicator (average price)
Use Entry trigger for trades Identifies trend direction
Works Best Intraday (first minutes) Any timeframe (intraday or swing)
Plots ORB High/Low lines for the first few minutes
Plots SMA 9/50/180 & EMA 20
Plots trailing stopline + Buy/Sell arrows
Optional bar color / background color toggle
Alert conditions for Buy/Sell
ORB high/low lines
SMA 9/50/180 + EMA 20
Buy/Sell arrows + trailing stopline

Consecutive Candles Box with MidpointHelps to identify consecutive candle closes for potential ranges.

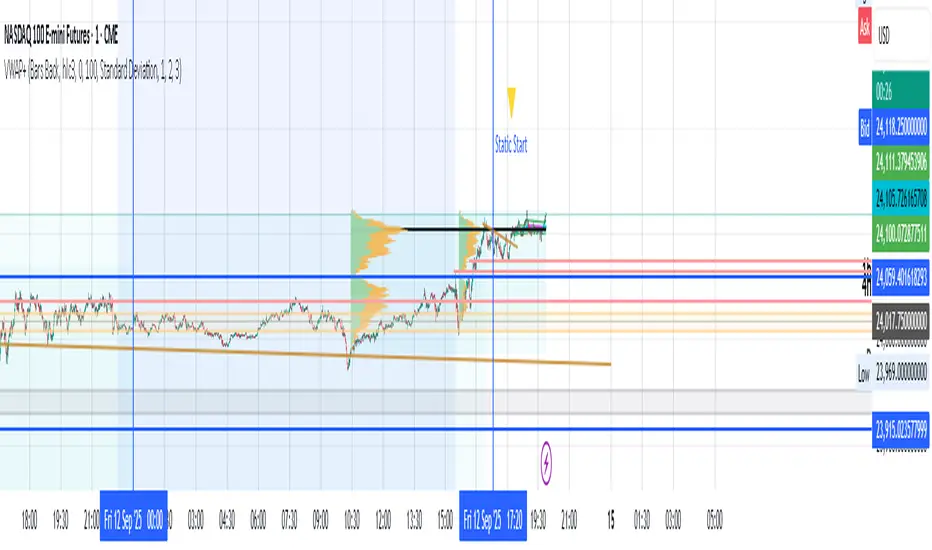
Volume Weighted Average AZ++Volume Weighted Average original script plus:
* anchor from a specific date and time in the past
* anchor from a specific numbers of bars back

Volume Weighted Average AZ++Volume Weighted Average modified to:
* add a custom starting date and time
* add a custom period back in bars, to anchor vWAP