macd color bar cryptosmartDescription
The MACD Color Bar CryptoSmart indicator is a visual trading tool designed to help traders quickly identify trend changes by coloring the chart's price bars based on MACD (Moving Average Convergence Divergence) signals.
Instead of looking down at the MACD panel, you can see the trend's momentum directly on your price chart, making it easier to spot potential entries and exits.
How It Works
The indicator monitors the MACD line and its signal line in the background.
Bullish Trend (Green Bars): When the MACD line crosses above the signal line, the price bars will turn green. This color persists, signaling that the momentum is currently bullish.
Bearish Trend (Red Bars): When the MACD line crosses below the signal line, the price bars will turn red. This color persists, indicating that the momentum has shifted to bearish.
This immediate visual feedback helps you stay aligned with the current trend as defined by the MACD.
How to Use
Trend Identification: Use the bar colors for a quick "at-a-glance" understanding of the prevailing trend. Green bars suggest an uptrend, while red bars suggest a downtrend.
Entry Signals: A color change from red to green can be seen as a potential bullish entry signal. Conversely, a change from green to red can suggest a potential bearish entry.
Confirmation: Use the bar colors to confirm signals from your primary trading strategy. For example, if you get a buy signal from another indicator, a green bar color adds confluence to your trade idea.
All MACD settings (Fast Length, Slow Length, Signal Length) and the bar colors are fully customizable in the indicator's settings menu.
Indicators and strategies

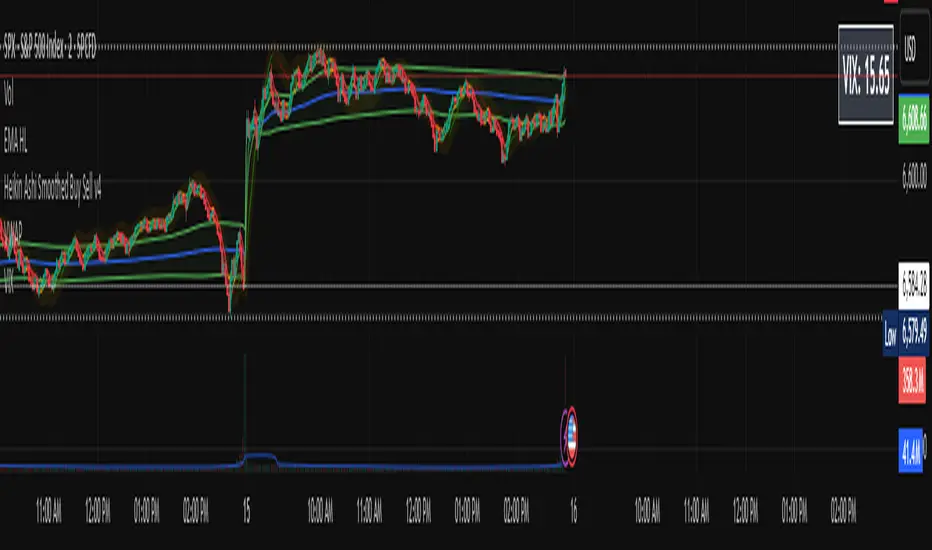
VIX Price BoxVIX Price Box (Customizable Colors)
This indicator displays the current VIX (CBOE Volatility Index) value in a fixed box on the top-right corner of the chart. It’s designed to give traders a quick, at-a-glance view of market volatility without needing to switch tickers.
Features
Pulls the live VIX price and updates automatically on every bar.
Displays the value inside a table box that stays fixed in the top-right corner.
Threshold-based coloring: the text color changes depending on whether the VIX is below, between, or above your chosen threshold levels.
5 built-in color modes:
Custom mode – choose your own colors for low, medium, and high volatility zones.
Adjustable threshold levels, background color, and frame color.
Use Cases
Monitor overall market risk sentiment while trading other instruments.
Identify periods of low vs. high volatility at a glance.
Pair with strategies that rely on volatility (options trading, hedging, breakout setups, etc.).
Trend Line Break DetectorTrend line break detector that is open sourced anyone can build on it. It does not work as intended as of now.

EMA-RSI-ADX Trend Bands
📌 EMA-RSI-ADX Trend Bands (ERA Trend Bands)
🔥 Overview
The ERA Trend Bands indicator combines Exponential Moving Average (EMA), Relative Strength Index (RSI), and Average Directional Index (ADX) into a powerful multi-factor trend system.
It helps traders:
Identify trend direction (Bullish / Bearish)
Measure trend strength using EMA deviation bands
Confirm momentum with RSI & ADX filters
Visualize conditions with dynamic colors, labels, tables, and signals
⚡ Key Features
📍 EMA Trend Bands
EMA100 with gradient glow effect showing trend bias
Strength bands around EMA (Very Weak → Hyper levels)
Bands color-coded for bullish/bearish extremes
📊 RSI + ADX Confluence
Bullish Signal: RSI ≥ threshold & ADX ≥ threshold → 🟢
Bearish Signal: RSI ≤ threshold & ADX ≤ threshold → 🔴
Candles recolored when conditions are met
Auto-generated labels show live RSI/ADX values
🧩 Strength Levels
Classifies deviation from EMA into 8 levels:
Neutral → Very Weak → Weak → Moderate → Strong → Very Strong → Extreme → Hyper
Dashboard table shows deviation % ranges & strength colors
Dynamic labels display Trend, Strength, Deviation %, RSI & ADX
🎨 Visual Enhancements
Gradient EMA line with glow effect
Bullish (greens) & bearish (reds) vibrant palettes
Background coloring (optional) based on strength
Symbols & labels for entry confirmation
🎯 How to Use
Trend Direction – EMA color + deviation bands show whether market is bullish or bearish.
Strength Confirmation – Use strength labels & dashboard table to gauge overextension.
Entry Signals – Watch for RSI/ADX confluence (green/red labels on chart).
Exits – Monitor when strength fades back toward Neutral/Weak levels.
⚙️ Settings & Inputs
EMA Settings → Length, Line Width, Gradient Intensity
RSI Settings → Length & Thresholds (Bullish / Bearish)
ADX Settings → Length & Thresholds (Bullish / Bearish)
Bands → Enable/disable EMA deviation bands
Labels/Table → Toggle strength info display
Colors → Fully customizable vibrant palettes
🚨 Alerts & Signals
Bullish Condition → RSI & ADX above thresholds
Bearish Condition → RSI & ADX below thresholds
Visual confirmation with labels, candles, and background
⚠️ Disclaimer
This script is for educational purposes only.
It does not constitute financial advice.
Always backtest and use proper risk management before trading live.
✨ Add EMA-RSI-ADX Trend Bands (ERA Trend Bands) to your chart to trade with clarity, strength, and precision.

8, 21 & 50 EMA, 100 & 200 SMA Able to identify trends with key moving averages to enable you to make better informed trading decisions.

macd + stochastic cryptosmart## macd + stochastic cryptosmart
This indicator is a technical analysis tool designed to find high-probability trading signals by merging two of the most powerful oscillators: the MACD and the Stochastic.
The core strategy is not just to use each indicator separately, but to identify moments of confluence, where both send the same message. When a momentum signal from the MACD occurs while the Stochastic is in an extreme zone, the probability of a strong, sustained move increases significantly.
## The Confluence Logic: The Core Strategy ✨
The power of this indicator lies in the confirmation of signals. Instead of acting on a single clue, you wait for two experts to give you the same recommendation.
📈 High-Probability Buy Signal (Bullish Confluence)
A buy signal is considered especially strong when the following two conditions occur at nearly the same time:
Stochastic at an Extreme: The Stochastic oscillator is in the oversold zone (typically below 20), indicating that selling pressure may be exhausted and the price is "cheap."
MACD Crossover: The MACD line crosses above its signal line (a bullish crossover). This confirms that the market's momentum is beginning to shift in favor of the buyers.
The logic is: The Stochastic tells you when the market is ready for a potential bounce, and the MACD crossover gives you the confirmation that the bounce is starting with force.
📉 High-Probability Sell Signal (Bearish Confluence)
A high-quality sell signal occurs when:
Stochastic at an Extreme: The Stochastic is in the overbought zone (above 80), suggesting the asset may be overvalued and ready for a correction.
MACD Crossover: The MACD line crosses below its signal line (a bearish crossover). This confirms that momentum is turning negative.
The logic is: The Stochastic alerts you to a potential price "bubble," and the MACD crossover confirms that the bubble is beginning to deflate.
## Key Features
MACD Normalization: To make comparison easier, the indicator can normalize the MACD to the same 0-100 scale as the Stochastic. This allows you to view both oscillators in a similar context.
Smart Visualization:
The indicator's background changes color depending on whether the Stochastic is in an overbought, oversold, or neutral zone.
The "shadow" between the MACD lines is colored green or red to show you at a glance whether momentum is bullish or bearish.
In summary, this indicator doesn't reinvent the MACD or the Stochastic but integrates them in a smart, visual way so you can apply a confluence strategy more effectively, filtering out weak signals and focusing on those with the highest probability of success.

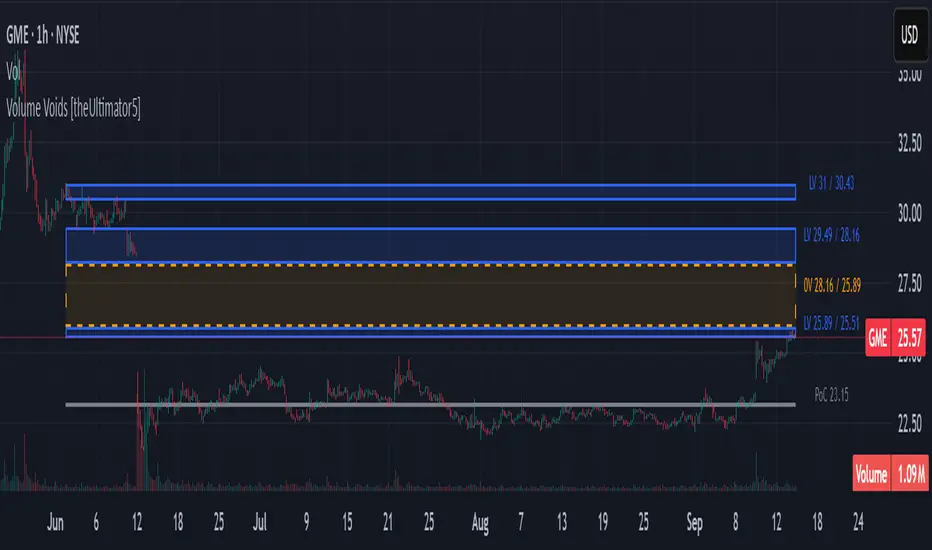
Volume Voids [theUltimator5]Volume Voids highlights price regions with no or unusually thin participation over a chosen lookback. It bins the lookback’s full price range into equal steps, assigns each bar’s close to a bin, and accumulates volume per bin. Contiguous runs of zero-volume bins are shown as “voids,” while low-volume runs (below a dynamic threshold) mark thin-liquidity “corridors” where price often traverses quickly when revisited.
An optional PoC (Point of Control) line marks the mid-price of the highest-volume bin—commonly treated as a recent “value” area that price may revisit.
What it draws on your chart
Histogram (optional): Right-anchored horizontal volume-by-price bars built from your lookback and bin count. Bars tint green→red via a simple delta proxy (up-bar volume minus down-bar volume) to hint at directional participation inside each price band.
Point of Control (optional): A horizontal line at the highest-volume bin’s mid-price (the PoC).
Zero-Volume Voids: Translucent boxes where no bin volume printed within the window (detected between the first and last non-empty bins ).
Low-Volume Zones: Translucent boxes where bin volume is below a dynamic threshold (see formula below), often acting like low-friction corridors.
How it works
Slice the lookback’s high→low into N equal price bins.
Assign each bar’s closing price to a bin and add that bar’s volume to the bin total. A simple up/down-bar delta proxy drives the histogram’s tinting.
PoC = bin with the maximum accumulated volume.
Zero-Volume Voids = contiguous runs of bins with exactly zero volume (bounded by the first/last occupied bins).
Low-Volume Zones = contiguous runs of bins with volume below:
threshold = total_window_volume ÷ (divisor × number_of_bins)
Lower divisor → more LV boxes; higher divisor → stricter/fewer boxes.
Note: This is a lightweight, chart-native approximation of a volume profile. Volume is binned by bar close (not by tick-level prints or intrabar distribution), so “voids”/“thin” areas reflect this approximation.
Key inputs
Lookback Period: Window for calculations.
Number of Volume Boxes (bins): Histogram resolution.
PoC / Show Histogram / Anchor to Right Side: Visibility and layout controls.
Low-Volume Threshold Divisor: Sensitivity for LV detection.
Colors & Labels: Customize zero-volume / low-volume box colors and optional labels with offsets.
How to use (educational, not signals)
Context: High-volume = acceptance; thin/zero-volume = inefficiency. Price often rotates near acceptance and moves faster through thin areas.
Revisits: On returns to prior voids/LV zones, watch for accelerated moves or fills; PoC can serve as a balance reference.
Confluence: Pair with trend tools (e.g., ADX), VWAP/session markers, or structure levels for timing and risk.
Limitations & performance
Bins use closing price only; intrabar distribution is not modeled.
Detections refresh on the live bar; visuals can be heavy on large lookbacks/high bin counts—reduce bins/lookback or hide labels if needed.
EMA/SMA Stack Analysis Table (Lite – Current Only)📘 EMA/SMA Stack Analysis Table (Lite – Current Only)
This script is a simplified learning tool designed for novice traders who want to understand how moving averages (MAs) stack up in different market conditions.
The table displays:
Current MA stack (e.g., 9 > 20 > 50 > 100 > 200)
Interpretation (Perfect Bullish, Perfect Bearish, Mixed, etc.)
Risk label (Low, Medium, High)
A novice-friendly “Allowed?” guide with score
✅ YES (Buy on dips / Starter)
⏳ WAIT (no clear edge)
❌ NO (Avoid longs)
Why this matters
A Perfect Bullish stack (9 > 20 > 50 > 100 > 200) suggests a strong uptrend.
A Perfect Bearish stack (200 > 100 > 50 > 20 > 9) indicates a strong downtrend.
Mixed stacks can reflect transitions, pauses, or pullbacks.
The score helps summarize multiple factors into one line for beginners. The full script is too long to publish.
⚠️ Important Warnings
Moving averages lag price. By themselves, they can be misleading and should never be the sole basis for trading.
Always use confirmatory indicators (RSI, volume, price action, support/resistance, etc.) before making decisions.
This script is intended as a learning aid for novices — not a standalone trading system.
I built this primarily to help myself (a beginner) learn how to read trend structure.
Disclaimer
This script is provided as is, for educational purposes only.
It is not financial advice. Please test thoroughly and use at your own risk.

ATR + RSEMA📐 What is the RSEMA Indicator
The RSEMA combo is a volatility filter built around ATR (Average True Range) that uses a combination of RMA, SMA, and EMA smoothing methods.
ATR measures the raw size of price movement each bar.
RMA (Running Moving Average) provides a slow, stable baseline for volatility.
SMA (Simple Moving Average) captures the “middle ground” by averaging raw ATR over a fixed window.
EMA (Exponential Moving Average) reacts fastest and highlights short-term volatility spikes or fades.
By stacking these three moving averages together on ATR, you get a layered view of volatility quality.
🔑 Why This Works
When ATR + EMA are strong and above SMA and RMA → market is in an expanding, decisive regime.
When ATR flattens and EMA dips toward SMA/RMA → volatility is compressing and indecision dominates.
If all three averages converge at low levels → chop zone confirmed.
This is much easier to read than raw ATR bars and gives a clear “volatility health check” at a glance.
📊 Use Case for ORB
For the ORB strategy this combo acts as a regime filter:
High ATR with EMA > SMA > RMA → best edge, breakouts follow through (like March and April).
Flat ATR with all averages clustering → indecision and drawdown periods (like August).
THIS CODE IS DERIVED FROM TRADINGVIEWS DEFAULT ATR THING

Heikin FlowHeikin Flow
by Ben Deharde, 2025
Overview
Heikin Flow is a trend and momentum oscillator built on a smoothed reverse-Heikin-Ashi baseline. It quantifies the distance between price and this baseline, then colors the histogram to reflect both direction and acceleration/deceleration. Use it standalone to read trend energy and shifts, or pair it with Heikin Rider for momentum-aware breakout confirmation.
What It Does
Computes a reverse-HA baseline and optionally smooths it with a selectable MA.
Plots a histogram of distance (price minus baseline) to visualize directional pressure.
Colors the histogram by trend state (above/below baseline) and momentum (accelerating vs. decelerating).
Provides alerts on zero-line crosses to spotlight potential momentum regime changes.
The histogram also helps to spot divergence between price and momentum (e.g., price making new highs while the histogram weakens).
How It Works
Reverse-HA Baseline
Heikin Flow derives a “reverse close” value from Heikin Ashi context (using prior HA open/close with current bar range) to capture underlying pressure. This value is range-bounded to avoid extremes, then optionally smoothed. The resulting line acts as a soft directional baseline.
Smoothing (Noise Control)
Choose SMA/EMA/HMA/VWMA/RMA and a length to control baseline responsiveness. Shorter lengths react faster, longer lengths emphasize trend consistency by filtering noise—useful when pairing with breakout tools like Rider.
Trend & Momentum Logic
Trend: If price is above the baseline, the environment is considered uptrend; below indicates downtrend.
Momentum: The change in distance bar-to-bar distinguishes acceleration (growing distance) from deceleration (shrinking distance).
This dual readout helps you see not just direction, but the quality of that direction—strong push vs. weakening move.
Coloring (Aligned with Heikin Rider Palette)
Deep Blue: Uptrend & accelerating
Light Blue: Uptrend & decelerating
Deep Red: Downtrend & accelerating
Soft Orange: Downtrend & decelerating
This mirrors the palette logic from Heikin Rider for immediate visual consistency across the suite.
How to use
Read the histogram above/below zero (price–baseline) as directional bias; watch color changes for momentum context.
Use zero-line crosses as momentum regime shifts; confirm with price action or Heikin Rider breakout signals.
Watch for divergence between price action and the histogram as an early clue of weakening moves.
Adjust smoothing method/length to fit your market and timeframe—faster for scalping, slower to highlight sustained trends.
Inputs
Smoothing Type & Length for the baseline (SMA/EMA/HMA/VWMA/RMA)
Info Box toggles (display and formatting)
Live Mode option for real-time vs. confirmed-bar behavior (avoids inadvertent lookahead)
Originality
Heikin Flow adapts the HA-driven methodology to an oscillator that focuses on distance-to-baseline and momentum quality, using a reverse-HA construction and flexible MA smoothing—complementing Heikin Rider’s smoothed HA envelope breakout design for a cohesive, momentum-aware workflow.
Alerts
Bullish Heikin Flow Cross — distance crosses above 0 (on bar close)
Bearish Heikin Flow Cross — distance crosses below 0 (on bar close)

POC-Change Regime VBP// POC-Change Regime VBP — 取扱説明 / User Guide
// JP: 概要)POC(Point of Control)をレジーム単位で追跡し、価格帯別出来高(VBP/VPVR)を可視化します。
// EN: Overview) Tracks regime-based POC and visualizes Volume by Price (VBP/VPVR).
// JP: 出来高はボディ/髭領域に重み付け配分。髭はオプションで常に50:50の中立配分。
// EN: Volume is distributed to body/wick areas with weights. Wick can be split 50:50 (direction-neutral).
// JP: ラベル:上段=WAP比較(UPμ ≷ DNμ; 許容誤差はティック指定)、下段=UP:DN 正規化(合計100)。
// EN: Label: 1st line = WAP comparison (UPμ ≷ DNμ; tolerance in ticks), 2nd line = normalized UP:DN (sum=100).
// JP: POCは各価格帯の(Up+Dn)合計が最大の帯。UP:DN比は向きの内訳であり価格位置と独立なので、POC上下と矛盾し得ます。
// EN: POC is the price bin with max (Up+Dn). UP:DN ratio is direction mix only; may disagree with POC direction.
// JP: 主なパラメータ)calcBins=計算精度、drawBins=描画粗さ、minConfirmBars=POC変移の確定遅延、
// minShareDraw=小帯の間引き、labelYOffsetTicks=ラベルの被り回避(上に持ち上げ)。
// EN: Key params) calcBins=calc resolution, drawBins=draw coarseness, minConfirmBars=POC change confirmation,
// minShareDraw=drop tiny bins, labelYOffsetTicks=lift labels above boxes to avoid overlap.
// JP: 注意)syminfo.mintickは現在の最小ティック。可変ティック制市場では過去刻みを厳密再現しません。
// EN: Note) syminfo.mintick is current minimum tick; variable-tick markets won’t be reproduced historically.
// JP: ヒント)calcBins↑で精度↑/負荷↑。minConfirmBars↑でダマシ抑制/反応遅延。splitWicksEqually=trueで方向バイアスを抑制。
// EN: Tips) Higher calcBins = higher accuracy & load. Higher minConfirmBars = less noise & slower response.
// splitWicksEqually=true reduces directional bias from wicks.

IV Rank (tasty-style) — VIXFix / HV ProxyIV Rank (tasty-style) — VIXFix / HV Proxy
Overview
This indicator replicates tastytrade’s IV Rank calculation—but built entirely inside TradingView.
Because TradingView does not expose live option-chain implied volatility, the script lets you choose between two widely used price-based IV proxies:
VIXFix (Williams VIX Fix): a fast-reacting volatility estimate derived from price extremes.
HV(30): 30-day annualized historical volatility of daily log returns.
The goal is to approximate the “rich vs. cheap” option volatility environment that traders use to decide whether to sell or buy premium.
Formula
IV Rank answers the question: Where is current implied volatility relative to its own 1-year range?
𝐼
𝑉
𝑅
=
𝐼
𝑉
𝑐
𝑢
𝑟
𝑟
𝑒
𝑛
𝑡
−
𝐼
𝑉
1
𝑦
𝐿
𝑜
𝑤
𝐼
𝑉
1
𝑦
𝐻
𝑖
𝑔
ℎ
−
𝐼
𝑉
1
𝑦
𝐿
𝑜
𝑤
×
100
IVR=
IV
1yHigh
−IV
1yLow
IV
current
−IV
1yLow
×100
IVcurrent: Current value of the chosen IV proxy.
IV1yHigh/Low: Highest and lowest proxy values over the user-defined lookback (default 252 trading days ≈ 1 year).
IVR = 0 → Current IV equals its 1-year low
IVR = 100 → Current IV equals its 1-year high
IVR ≈ 50 → Current IV sits mid-range
How to Use
High IV Rank (≥50–60%)
Options are relatively expensive → short-premium strategies (credit spreads, iron condors, straddles) may be more attractive.
Low IV Rank (≤20%)
Options are relatively cheap → long-premium strategies (debit spreads, calendars, diagonals) may offer better risk/reward.
Combine with your own analysis, liquidity checks, and risk management.
Inputs & Customization
IV Source: Choose “VIXFix” or “HV(30)” as the volatility proxy.
IVR Lookback: Rolling window for 1-year high/low (default 252 trading days).
VIXFix Parameters: Length and stdev multiplier to fine-tune sensitivity.
Info Label: Optional on-chart label displays current IV proxy, 1-year high/low, and IV Rank.
Alerts: Optional alerts when IVR crosses 50, falls below 20, or rises above 80.
Notes & Limitations
This indicator does not pull real option-chain IV.
It provides a close structural analogue to tastytrade’s IV Rank using price-derived proxies for markets where options data is not directly available.
For live option IV, use broker platforms or third-party data feeds alongside this script.
Tags: IV Rank, Implied Volatility, Tastytrade, VIXFix, Historical Volatility, Options, Premium Selling, Debit Spreads, Market Volatility

oscillator fast cryptosmartThe oscillator fast cryptosmart is a high-sensitivity momentum indicator designed to generate signals more rapidly than many traditional oscillators, such as the MACD. It is engineered to detect potential price breakouts by analyzing short-term market cycles.
At its core, the indicator uses a Detrended Price Oscillator (DPO) to remove the longer-term trend from price action, allowing it to focus purely on the underlying momentum cycles. It then calculates dynamic volatility bands around this oscillator line.
Signals are generated when momentum breaks out from a normal range, providing traders with an early warning of a potential acceleration in price.
How to Interpret the Signals:
Buy Signal (Green Vertical Line): A buy signal is generated when the oscillator's main line (yellow) crosses above its upper statistical band. This indicates a sharp surge in positive momentum, suggesting a potential upward move is beginning.
Sell Signal (Red Vertical Line): A sell signal is generated when the oscillator's main line crosses below its lower statistical band. This indicates a significant increase in negative momentum, suggesting a potential downward move is starting.
By focusing on momentum breakouts rather than lagging moving average crossovers, the oscillator fast cryptosmart aims to provide an edge in identifying opportunities in fast-moving markets.

WTI Futures Break-Out StrategyThis Channel indicator is designed for 5 min time frame.
Pre-market high and low is defined per trading day between 9:00 AM to 9:30 AM EST.
How it works:
At 9:00 and 9:30 mark lines on Low and Hi levels.
Wait until a candle is closed above or below Low and Hi levels.
- Break-out high = long trade
- Break-out low = short trade
For additional confirmation, use either MACD or Stochastic RSI indicators.

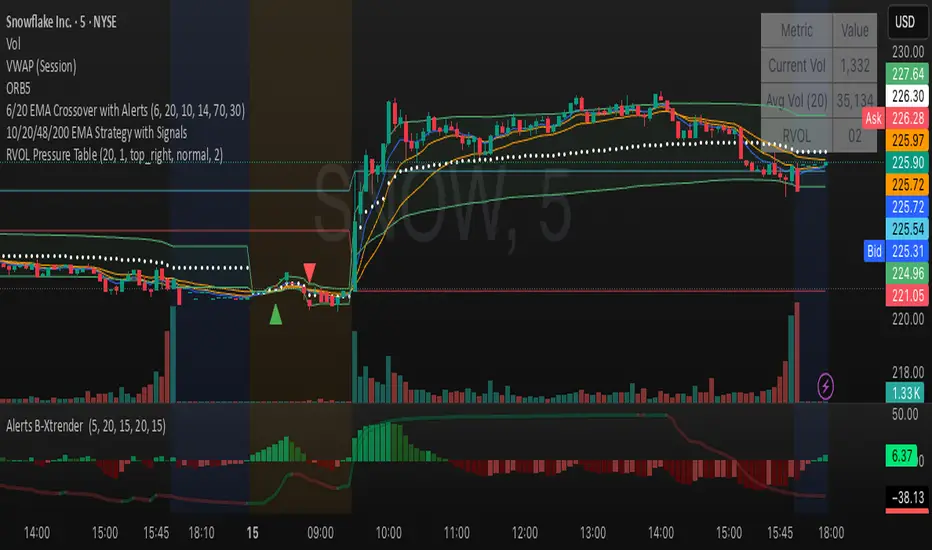
Relative Volume Table with PressureDisplay relative Volume as a table in the top right corner. Turns green when volume is high and price is increasing and red when volume is high and price is decreasing. I use this on D timeframe at the open to screen for stocks breaking out.
Bullish Surge Signal-V2This indicator is best used with KST "Know Sure Thing" and "ADX and DI". Golden bar is positive volume, Red dots means sell volume pressure. When you see buy signals on a one hour chart, you know volume, bullish burst is coming soon.

Argentum Flag [AGP] Ver.2.5Central Purpose and Concept
The Argentum Flag script is a multifunctional tool that integrates and visualizes multiple key indicators to provide a detailed and unified perspective of the market. The core concept is to analyze price from different angles—volatility, volume, and momentum—to identify confluences and patterns that may be difficult to see with separate indicators. This "mashup" is not a simple fusion of indicators, but a strategic combination of tools that complement each other to offer a comprehensive view of asset behavior.
Components and Their Functionality
This script combines and visualizes the following elements:
EMA Percentage Bands (EMA Bands):
Uses an Exponential Moving Average (EMA) as a baseline.
Calculates and draws several volatility bands that deviate from the central EMA by fixed percentages (0.47%, 0.94%, 2.36%). These bands are inspired by Fibonacci ratios and the cyclical nature of the market.
The bands are colored with a dynamic gradient that reflects the current state of volatility.
Utility: These bands act as dynamic support and resistance areas. The price entering or exiting these zones can indicate a change in volatility or a possible exhaustion of the movement.
Volatility Signals (Vortex & Prime Signals):
The script generates visual signals when the price stays outside the volatility bands for a specific number of bars.
Vortex Signals (diamond ⍲): Appear when the price crosses and stays outside the Prime bands, suggesting a high volatility or a possible continuation of the trend.
Exit/Entry Signals (circle ⌾): Are activated when the price stays outside the Vortex bands, indicating an extreme extension of volatility. These can be interpreted as potential reversal or profit-taking zones.
Utility: They help traders quickly identify moments of high and low volatility and potential turning points in price action.
Volume Analysis (Volume Bar Colors):
The script changes the color of the bars based on the relationship between the current volume and the average volume over a 50-bar period.
Utility: This feature allows the trader to immediately visualize the strength behind a price movement. For example, a bullish candle with "extreme" volume suggests strong buying interest, while a bearish candle with "low" volume could indicate a weak correction.
Summary Tables (Dashboard):
EMA-Fibo Table: Displays the values of 12 EMAs based on the Fibonacci sequence (5, 8, 13, 21...) in an easy-to-access table. The background color of each value indicates if the current price is above (bullish) or below (bearish) that EMA.
Multi-Timeframe RSI Table: Displays the Relative Strength Index (RSI) values across multiple timeframes (from 1 minute to monthly). The text color changes to highlight if the RSI is in overbought (orange) or oversold (white) areas, according to the established levels.
Utility: These tables condense a large amount of data into a simple format, allowing traders to perform a quick, multi-timeframe market analysis without constantly switching charts.
How to Use the Script
This script is a contextual analysis tool that works best when its different components are combined. It is not a "buy and sell signal" system on its own, but a tool for informed decision-making.
Trend Identification: Use the EMA table to see the general trend direction across different timeframes. A price above most of the EMAs in the table suggests a bullish bias.
Volatility Reading: Observe the EMA bands. If the price stays within the bands, volatility is low. A strong move that breaks out of the bands, accompanied by an "extreme" volume color (blue), suggests strong momentum that could continue.
Momentum Analysis: Use the RSI table to confirm movements. An overbought 15m RSI could support a reversal signal from the Vortex bands, while a 1D RSI in a neutral zone may indicate that the main trend has not changed.
Signal Confirmation: Visual signals (diamond and circle) should not be used in isolation. They must be confirmed by volume analysis and dashboard readings. For example, an "Exit Signal" (circle) with low volume may be less reliable than one with high volume and a clear reversal candle.
Disclaimer
This script is for informational and educational purposes only. It is not financial advice, nor is it a recommendation to buy or sell any financial instrument. All trading involves risk, and past performance is not indicative of future results. The user is solely responsible for their own trading decisions.

Stop Loss Advisor📊 Stop Loss Advisor - Advanced Risk Management Tool
A sophisticated Pine Script v5 indicator designed to suggest optimal stop loss distances based on market volatility, combining ATR and Standard Deviation analysis for precise risk management.
🎯 What Makes This Different from Bollinger Bands?
While Bollinger Bands focus on mean reversion and overbought/oversold conditions using a moving average center line, this indicator is specifically designed for risk management . It creates dynamic bands around the current price to suggest where NOT to place your stop loss, preventing you from being stopped out by normal market noise.
⚡ Key Features
Dynamic ATR Calculation - Fully customizable ATR periods with adaptive volatility filtering
Standard Deviation Integration - Optional StdDev component for enhanced statistical accuracy
Multiple Combination Modes - Average, Maximum, ATR Weighted, or StdDev Weighted
Flexible Price Sources - Choose from Close, HL2, HLC3, or OHLC4
Automatic Pip Calculation - Works across all instruments with automatic pip value detection
Smart Alerts System - Get notified when suggested stop loss exceeds your base risk tolerance
Real-time Information Table - Displays current values and risk status
Visual Labels - Shows exact pip distances directly on chart
Band Smoothing - Prevents erratic movements with customizable averaging
📈 How It Works
ATR Analysis : Calculates Average True Range to measure current market volatility
Statistical Enhancement : Optionally combines with Standard Deviation for more robust calculations
Dynamic Bands : Creates upper and lower bands that expand/contract with volatility
Pip Conversion : Automatically converts distances to pips for easy interpretation
Risk Assessment : Compares suggested distances with your base stop loss tolerance
🔧 Customization Options
ATR Settings:
Customizable ATR period (default: 14)
Adjustable multiplier with 0.1 step precision
Optional volatility filtering for enhanced sensitivity
Standard Deviation (Optional):
Independent period and multiplier settings
Multiple price source options
Four combination modes with ATR
Visual Customization:
Fully customizable colors for all elements
Multiple line styles (solid, dashed, dotted)
Optional band filling with transparency control
Show/hide ATR line overlay
Configurable band smoothing
💡 Perfect For
Forex Traders - Especially effective on major pairs and XAUUSD
Risk Managers - Calculate optimal stop distances before entering trades
Scalpers - Avoid being stopped out by normal market fluctuations
Swing Traders - Adapt stop losses to current volatility conditions
📊 Indicator Values
The information table displays:
Current ATR Value (in pips)
Suggested Long Stop Loss (distance in pips)
Suggested Short Stop Loss (distance in pips)
Risk Status - "SAFE" or "HIGH RISK" based on your base tolerance
Standard Deviation Value (when enabled)
Combination Method (when using both ATR and StdDev)
⚠️ Important Notes
This indicator suggests minimum stop loss distances, not entry/exit signals
Always combine with your trading strategy and risk management rules
Do not use as a standalone trading system
Backtesting recommended before live implementation
Default settings work well for most scenarios, but optimization is encouraged
🎨 Default Configuration
ATR Period: 14
ATR Multiplier: 2.0
Price Source: Close
Base Stop Loss: 20 pips
Band Smoothing: 3 periods
Standard Deviation: Optional (20 period, 2.0 multiplier)
🚀 Getting Started
Add the indicator to your chart
Set your base stop loss tolerance in the settings
Choose your preferred price source and ATR parameters
Enable Standard Deviation for enhanced accuracy (optional)
Monitor the information table for real-time risk assessment
Use the suggested distances as minimum stop loss levels
Pro Tip: In low volatility markets, the bands will contract suggesting tighter stops. In high volatility periods, they expand warning you to use wider stops to avoid being stopped out by normal price action.
📝 Version History & Updates
This indicator is actively maintained and updated based on user feedback. Future enhancements may include multi-timeframe analysis, trend-based asymmetric bands, and additional statistical measures.
Transform your risk management approach with data-driven stop loss suggestions that adapt to real market conditions!

PopsStocks - Pullback & Breakout (PDP example) - INDICATORPopsStocks — Pullback & Breakout (PDP Example)
This indicator highlights two high-probability trading setups:
Pullback Zone (PB): Marks a price box where buyers may step back in after a dip. Signals trigger when volume and candle patterns confirm strength inside the zone.
Breakout (BO): Triggers when price clears resistance with healthy volume and buildup.
Features include:
Manual or auto-calculated levels using ATR.
Pullback & breakout stop levels and profit targets.
EMA trend filter (20/50).
Optional volume filter and buildup logic.
Custom resolution toggle (analyze signals on any timeframe).
Visual plots, signal panel, and alert conditions for PB & BO trades.

Zenova KAMAThis overlay combines the Kaufman Adaptive Moving Average (KAMA) with a Parabolic SAR (PSAR) and RSI-based overbought/oversold highlighting:
KAMA adapts to market volatility, changing color dynamically:
Blue (#2196f3) when trending up
Pink (#f659eb) when trending down
PSAR dots are plotted on the price for trend confirmation:
Blue dots indicate bullish signals
Pink dots indicate bearish signals
RSI background shading highlights overbought and oversold zones:
RSI above overbought level
RSI below oversold level
This combination helps identify trend direction, potential reversals, and overextended conditions in a single visual overlay.

PopsStocks - Pullback & Breakout (PDP example) - INDICATORPopsStocks — Pullback & Breakout (PDP Example)
This indicator highlights two high-probability trading setups:
Pullback Zone (PB): Marks a price box where buyers may step back in after a dip. Signals trigger when volume and candle patterns confirm strength inside the zone.
Breakout (BO): Triggers when price clears resistance with healthy volume and buildup.
Features include:
Manual or auto-calculated levels using ATR.
Pullback & breakout stop levels and profit targets.
EMA trend filter (20/50).
Optional volume filter and buildup logic.
Custom resolution toggle (analyze signals on any timeframe).
Visual plots, signal panel, and alert conditions for PB & BO trades.


TRAM 37Tram37 represents the 377-day simple moving average, a key indicator for assessing long-term market trends. It provides significant insights on both daily and weekly timeframes, making it an effective tool for investors seeking to evaluate market direction and optimize long-term holding strategies.
