PRESTIJLO ULTIMATE CHART — V2 PRO (Stable)⭐ WORKS BEST IN 5 MINUTES
Why?
Fake signals decrease
The trend appears cleaner
Liquidity (EQH/EQL) works properly
FVG boxes form clearly
TP–SL targets hit most accurately in 5 minutes
Momentum + EMA combination is healthiest here
Indicators and strategies

BTC vs US2000 – Ratio & Spread (BarDai v6 CLEAN)📌 How the Indicator Works
BTC vs US2000 — Ratio & Spread
The indicator shows:
who is stronger right now — crypto-risk (BTC) or equity-risk (US2000 / Russell-2000)
📈 Top Panel — RATIO + Risk Regime Signals
🎯 Ratio (cyan line)
Measures BTC’s relative strength versus US2000:
📈 Ratio rising → BTC outperforming → Risk-ON environment
📉 Ratio falling → BTC underperforming → Risk-OFF environment
📉 EMA (white line)
A smoothed benchmark.
➡ Key signal — when Ratio crosses the EMA
That marks a shift in the risk regime.
🟩🟥 Background Coloring (Risk Mode)
Condition Regime Meaning Trading Logic
Ratio above EMA 🟩 Risk-ON Capital flows into risk assets Favor BTC longs
Ratio below EMA 🟥 Risk-OFF Capital flows out of risk Prefer shorts / hedge / cash
🧭 SpreadNorm — Bottom Panel
🎯 SpreadNorm shows how strong the deviation is:
🟩 Above 0 → BTC risk premium
🟥 Below 0 → Equity-side risk premium (US2000 stronger)
It helps to:
✔ confirm regime signals
✔ filter false crossovers
✔ measure strength of risk move
(Yellow dots mark extreme deviations → mean-reversion potential)
📌 Trading Usage Guide
Scenario Interpretation Action
Ratio above EMA + SpreadNorm green Stable Risk-ON Look for BTC long entries
Ratio below EMA + SpreadNorm red Stable Risk-OFF Avoid aggressive longs
SpreadNorm extreme + yellow dot Reversal potential Take profit / wait for crossover
📌 Best used on 30–60m timeframes for intraday decision making.
🎁 Final Takeaway
The indicator tracks where risk-capital is flowing.
If BTC outperforms equities → we buy BTC.
If BTC underperforms → we don’t buy (or short it).

CVD – Visible Range Candles & Line (Cumulative Delta Volume)Disclaimer:
This indicator is provided for informational and educational purposes only. It does not constitute investment advice, trading advice, or a recommendation to buy or sell any financial instrument. The author assumes no liability for any losses, damages, or errors arising from use or misuse of this script. Please test thoroughly and use at your own risk.
________________________________________________________________________________
Purpose
This indicator provides a fast and clear visualization of Cumulative Delta Volume (CVD) for the currently visible chart range in TradingView. It helps traders identify buy/sell volume pressure and market sentiment over any custom timeframe, with full control over reset intervals and chart style.
Key Features
CVD by Visible Bars: Dynamically calculates CVD only for bars currently visible on the chart, so scrolling and zooming always rescale the line and candles to your view.
Style Selection: Choose line or candlestick display. Candles include both standard OHLC and optional Heikin Ashi smoothing.
Automatic Resets: Restart CVD accumulation at the beginning of every day, week, month, or quarter. Choose ‘None’ for ongoing accumulation.
Fully Custom Colors: Line color, candle body, wick, border – all optimized for clarity and customizable via the indicator’s Style tab.
Autoscale Support: Always fits your timeframe. No need to adjust scale manually.
Zero-Level Reference: Includes a horizontal zero line for quick reversal detection.
Input Parameters
Style: "Line" or "Candles" – controls visual type
Heikin Ashi candles: Enable smoothing for candle view
Show Line: Toggle CVD line visibility
Reset CVD: Options: None, Daily, Weekly, Monthly, Quarterly
How To Use
Add the indicator to your TradingView chart.
Select your preferred visual style (Line or Candles).
Choose reset frequency based on your trading timeframe.
Customize colors in the Style tab (line, candle up/down, wick, border).
Scroll or zoom on the chart – the indicator’s range always fits the currently visible bars.
Typical Use Cases
Intraday traders tracking open/close session volume delta
Swing traders identifying quarterly or monthly market accumulations
Visualizing buy/sell pressure divergence at reversal points
Comparing volume sentiment across flexible chart intervals
Formula
Delta calculation: Delta=volume×(sign(close−open))
Accumulation: Resets at user-chosen intervals, CVD plotted for only visible bars
Author
Created by Ronen Cohen

Global Liquidity Score
Global Liquidity Score – Simple Risk-On / Risk-Off Gauge
This indicator measures overall market liquidity conditions using a single, normalized score.
It takes several macro and crypto variables, standardizes each one (z-score), and combines them into one clear Liquidity Score Line.
You only follow one line (your pink/white line).
The background color shows the current liquidity regime.
⸻
What the indicator measures
The algorithm looks at four major liquidity sources:
1. USD Liquidity (tightening or easing)
• DXY (strong dollar = tighter global liquidity)
• US10Y yield (higher yields = liquidity drain)
2. Risk Sentiment (risk-on vs risk-off)
• VIX index (volatility)
• S&P 500 index (SPX)
3. Credit Market Strength
• High-yield ETFs: HYG, JNK
• Investment-grade corporate credit: LQD
Stronger credit = easier liquidity.
Weaker credit = tightening risk.
4. Internal Crypto Liquidity
• USDT dominance (higher = risk-off in crypto)
• Bitcoin price
• TOTAL2 (crypto market cap excluding BTC)
These are all converted into z-scores and combined into one metric:
Total Liquidity Score =
USD Block + Risk Block − Credit Block − 0.5 × Crypto Block
⸻
How to read the colors
The indicator uses background colors to show the liquidity regime:
Color Meaning
Dark Red Severe liquidity tightening / strong risk-off
Red Mild-to-moderate tightening
Green Liquidity easing / soft risk-on
Dark Green Strong easing, high liquidity / risk-on
Your pink/white line = the final liquidity score.
You only need to follow that single line.
⸻
How to interpret the score
📉 Positive score → Liquidity Tightening (Risk-Off)
• USD stronger
• Yields rising
• Volatility rising
• Credit markets weakening
• Crypto rotating to stablecoins
📈 Negative score → Liquidity Easing (Risk-On)
• USD weakening
• Yields falling
• Stocks rising
• Volatility low
• Credit markets strong
• Crypto beta assets outperform
⸻
What this indicator is NOT
This is not a price predictor.
It does not follow BTC directly.
It tells you liquidity conditions, not immediate price direction.
It answers the macro question:
“Is liquidity flowing INTO the market or OUT of the market?”
If liquidity is tightening (red), crypto rallies are harder to sustain.
If liquidity is easing (green), crypto rallies have more fuel.

Ultimate VFI Adv FilterThe Volume Flow Indicator (VFI) is a technical analysis tool designed to measure the strength, direction, and conviction of market trends using price and volume data. It builds upon traditional volume indicators by factoring in the flow of volume behind price movements, helping traders identify potential accumulation and distribution phases. VFI incorporates noise filtering, adjustable smoothing, and volatility thresholds, making it robust for various market conditions.
Use Cases
Trend Confirmation : VFI helps validate price trends by ensuring that significant moves are supported by strong volume flow, reducing the risk of false signals caused by low-volume price spikes.
Divergence Detection : Spot divergences between volume flow and price to anticipate possible reversals or entries before typical momentum indicators show them.
Breakout and Reversal Signals: When VFI sharply rises or falls above/below its threshold, it can signal high conviction moves, aiding traders to participate in breakouts or anticipate corrections.
Examples
Bullish Confirmation : If price breaks a resistance level accompanied by VFI crossing above zero (or a defined threshold), this confirms a buy signal—volume supports the breakout.
Bearish Divergence : Price forms a new high but VFI fails to do so, indicating weakening momentum—possible shorting opportunity or exit point.
Trend Continuation : Sustained positive VFI readings affirm accumulation and trend strength in uptrends, while persistent negative readings confirm downtrends.
Effectiveness
Noise Reduction : VFI integrates volatility and price movement filtering, reducing sensitivity to market “noise” and accidental spikes, unlike raw volume or basic OBV indicators.
Adaptive Smoothing : Traders can adjust smoothing parameters to match their style (e.g., day trading vs. swing trading).
Versatility : Works across stocks, forex, crypto, and commodities, effective in trending and range-bound markets.
Early Signals : Provides timely alerts to potential trend changes, enabling better risk management and signal confidence.

Micro Pullback Entry SystemMicro Pullback Entry System - Quick Reference
The Pattern
▲ ENTRY (first green to break high)
│
┌──┴───┐
│ 1-3 │ ← PULLBACK (red candles)
│ red │ Stop = Low of this zone
└──────┘
│
┌──┴───┐
│ 3+ │ ← THE MOVE (green candles)
│green │ Strong momentum
└──────┘
Pattern Checklist
Requirement: Why It Matters
3+ green candlesConfirms momentum
1-3 red pullback Brief = momentum intact< 50% retracementShallow = buyers in controlVolume on entryConfirms breakout Above EMA Trend support
Status Flow
Scanning... → 📈 TRENDING → 👀 WATCHING → ⏳ FORMING → 🎯 ENTRY!
StatusMeaningActionScanningLooking for setupWait📈 TRENDINGGreen streak buildingMonitor👀 WATCHINGPullback startedPrepare⏳ FORMINGValid pullback readyGet ready!🎯 ENTRY!Signal triggeredExecute
Entry/Stop/Target
LevelLine ColorHow to SetEntryLime solidClose of signal candleStopRed dashedLow of pullbackTarget 1Aqua dottedEntry + (2 × Risk)Target 2Yellow dottedEntry + (3 × Risk)
Example
Entry: $5.00
Stop: $4.80
Risk: $0.20
Target 1 (2R): $5.00 + $0.40 = $5.40
Target 2 (3R): $5.00 + $0.60 = $5.60
Quality Grades
GradeScoreActionA+5/5 ✓Best setup - full sizeA4/5 ✓Good setup - standard sizeB3/5 ✓Average - reduced sizeC2/5 ✓Weak - skip or tiny size
Scoring Factors
✓ Green streak met minimum
✓ Pullback length valid (1-3)
✓ Retracement shallow (<50%)
✓ Volume confirmed
✓ Above EMA
Trade Execution
Entry
Wait for "⏳ FORMING" status
Watch for green candle forming
Entry triggers when green candle closes above pullback high
Enter at market or small limit above current price
Stop Loss
Set at pullback low (red dashed line)
Non-negotiable - this is your max risk
Trade Management
If no immediate follow-through → exit early
Take 50% off at Target 1 (aqua line)
Move stop to breakeven
Let remainder run to Target 2
Settings Guide
Default (Recommended)
Min Green Candles: 3
Min Pullback: 1
Max Pullback: 3
Max Retracement: 50%
Volume Multiplier: 1.2x
EMA Filter: ON (20)
Conservative (Fewer, Better)
Min Green Candles: 4
Min Pullback: 2
Max Pullback: 3
Max Retracement: 40%
Volume Multiplier: 1.5x
EMA Filter: ON (20)
Aggressive (More Signals)
Min Green Candles: 2
Min Pullback: 1
Max Pullback: 4
Max Retracement: 60%
Volume Multiplier: 1.0x
EMA Filter: OFF
Common Mistakes
❌ Entering before signal
Wait for green triangle
"FORMING" ≠ "ENTRY"
❌ Wide stop
Stop must be at pullback low
If too wide, skip the trade
❌ Ignoring volume
Low volume entries fail more often
Look for ✓ in volume row
❌ Fighting trend
Check EMA status
Should show "Above ✓"
❌ Chasing after entry
If you miss entry by 3+ candles, wait for next setup
Don't chase extended moves
Best Setups
A+ Quality Setup ✓
4-5 green candles (strong move)
2 candle pullback (brief)
25-35% retracement (shallow)
2x+ volume on entry
Well above EMA
Stock already up 5%+ on day
Avoid These ✗
Only 2 green candles
4+ candle pullback (losing momentum)
50%+ retracement (too deep)
Below average volume
Below or at EMA
Against market direction
Timeframe Guide
TFSignalsQualityBest For1mMostLowerScalping5mBalancedGoodDay trading15mFewestHigherSwing entries
Quick Decision Tree
1. Status showing "FORMING"?
NO → Wait
YES → Continue
2. Quality grade A or better?
NO → Skip or small size
YES → Continue
3. Volume confirmed (✓)?
NO → Caution, reduce size
YES → Continue
4. Above EMA (✓)?
NO → Skip
YES → Continue
5. Risk acceptable? (Stop not too wide)
NO → Skip
YES → TAKE THE TRADE
Alert Setup
Essential Alert
"Micro Pullback Entry" - Main signal
How to Set
Right-click chart → Add Alert
Condition: Micro Pullback Entry System
Select "Micro Pullback Entry"
Set notification preferences
Combining with Other Indicators
IndicatorHow to Use5 PillarsFind stocks meeting criteria firstGap & GoLook for micro pullbacks after gap breakoutsR2G TrackerConfirm stock is green before enteringFloat RotationHigh rotation + micro pullback = best setupsBull FlagMicro pullback is a "mini" bull flag
Example Trade
Stock: XYZ
Pre-market: Gapped up 15%
9:35 - 9:38: 4 green candles (move from $4.50 to $5.00)
9:39 - 9:40: 2 red candles (pullback to $4.85)
9:41: Green candle breaks $4.90 (pullback high)
ENTRY: $4.92
STOP: $4.82 (pullback low)
RISK: $0.10
TARGET 1: $5.12 (+$0.20 = 2R)
TARGET 2: $5.22 (+$0.30 = 3R)
Result: Hit Target 2 by 9:55 → +$0.30 per share
Key Takeaways
Micro = 1-3 candles - Brief pullback
Entry = First green to break high - Specific trigger
Stop = Pullback low - Tight risk
Quality matters - Focus on A/A+ setups
Breakout or bailout - Exit if no follow-through

Red to Green / Green to Red Tracker# Red to Green / Green to Red Tracker - Quick Reference
## Core Concept
```
PRIOR CLOSE = Yesterday's closing price = The "zero line" for today
Above Prior Close = 🟢 GREEN (profitable for yesterday's buyers)
Below Prior Close = 🔴 RED (losing for yesterday's buyers)
```
---
## The Two Key Moves
### 🟢 Red to Green (R2G)
```
OPEN: Below prior close (RED)
↓
CROSS: Price moves above prior close
↓
RESULT: Now GREEN - Bullish signal
```
**Why it matters:**
- Bears who shorted get squeezed
- Creates FOMO buying
- Momentum often continues
---
### 🔴 Green to Red (G2R)
```
OPEN: Above prior close (GREEN)
↓
CROSS: Price moves below prior close
↓
RESULT: Now RED - Bearish signal
```
**Why it matters:**
- Longs who bought get trapped
- Triggers stop losses
- Panic selling follows
---
## Signals Explained
| Signal | Shape | Location | Meaning |
|--------|-------|----------|---------|
| R2G | ▲ Green Triangle | Below bar | Crossed to green |
| G2R | ▼ Red Triangle | Above bar | Crossed to red |
---
## Level Lines
| Line | Color | Style | What It Is |
|------|-------|-------|------------|
| Prior Close | Orange | Solid | KEY R2G/G2R level |
| Prior High | Green | Dashed | Yesterday's high |
| Prior Low | Red | Dashed | Yesterday's low |
| Today Open | White | Dotted | Gap reference |
---
## Info Table Reference
| Field | What It Shows |
|-------|---------------|
| Status | 🟢 GREEN / 🔴 RED / ⚪ FLAT |
| Day Change | % change from prior close |
| Prior Close | The key level price |
| Distance | How far from prior close |
| Opened | Did today open green or red |
| R2G | R2G status + price if triggered |
| G2R | G2R status + price if triggered |
| Rel Vol | Current relative volume |
| Prior High | Yesterday's high + distance |
| Prior Low | Yesterday's low + distance |
---
## Trading R2G (Long Setup)
### Entry Checklist
- Stock opened RED (below prior close)
- R2G cross signal triggered (green triangle)
- Volume confirmation (1.5x+ preferred, 2x+ ideal)
- Price holding above prior close
- Overall market not tanking
### Entry Method
1. **Aggressive:** Enter immediately on R2G cross
2. **Conservative:** Wait for pullback to prior close (now support)
### Stop Loss
- Below the R2G cross candle low
- OR below prior close (tighter)
### Target
- Prior day high (first target)
- 2:1 risk-reward minimum
---
## Trading G2R (Short Setup)
### Entry Checklist
- Stock opened GREEN (above prior close)
- G2R cross signal triggered (red triangle)
- Volume confirmation
- Price staying below prior close
- Overall market not ripping
### Entry Method
1. **Aggressive:** Enter immediately on G2R cross
2. **Conservative:** Wait for bounce to prior close (now resistance)
### Stop Loss
- Above the G2R cross candle high
- OR above prior close (tighter)
### Target
- Prior day low (first target)
- Gap fill (if gapped up)
---
## Signal Quality
### High Quality R2G ✓
- Opened significantly red (-2% or more)
- Strong volume on cross (2x+)
- First R2G of the day
- Market trending up
- News catalyst present
### Low Quality R2G ✗
- Opened barely red (-0.5%)
- Low volume cross
- Multiple R2G/G2R already today (choppy)
- Fighting market direction
- No clear catalyst
---
## Common Patterns
### Clean R2G (Best)
```
Open red → Steady climb → Cross prior close → Continue higher
```
### Failed R2G (Avoid/Exit)
```
Open red → Cross to green → Immediately fail back to red
```
### Choppy R2G/G2R (Avoid)
```
Multiple crosses back and forth = Indecision, no clear direction
```
---
## First Cross Rule
**The FIRST R2G or G2R of the day is usually the most significant.**
Why?
- Catches traders off guard
- Largest reaction from market
- Sets tone for rest of day
If you miss the first cross, be more selective on subsequent crosses.
---
## Volume Guide
| Rel Volume | Quality | Action |
|------------|---------|--------|
| < 1.0x | Weak | Skip or small size |
| 1.0-1.5x | Average | Standard position |
| 1.5-2.0x | Good | Full position |
| 2.0x+ | Strong | High conviction |
---
## Settings Recommendations
### Default (Balanced)
```
Require Opposite Open: ON
Require Volume: ON (1.5x)
Candle Close Confirm: OFF
Min Cross %: 0
```
### Conservative (Fewer, Better Signals)
```
Require Opposite Open: ON
Require Volume: ON (2.0x)
Candle Close Confirm: ON
Min Cross %: 0.5
```
### Aggressive (More Signals)
```
Require Opposite Open: OFF
Require Volume: OFF
Candle Close Confirm: OFF
Min Cross %: 0
```
---
## Alert Setup
### Essential Alerts
1. **First R2G of Day** - Highest value alert
2. **R2G with Strong Volume** - High conviction
### How to Set
1. Right-click chart → Add Alert
2. Condition: R2G/G2R Tracker
3. Select alert type
4. Set notification method
---
## Combining with Other Indicators
| Indicator | How to Use |
|-----------|------------|
| **Gap & Go** | R2G on gap-down stock = strong reversal |
| **Bull Flag** | Look for bull flag after R2G confirmation |
| **Float Rotation** | R2G + high rotation = explosive potential |
| **VWAP** | R2G above VWAP = strongest setup |
---
## Common Mistakes
❌ **Chasing late R2G**
- If price is already 3-5% green, you missed the move
- Wait for pullback or next setup
❌ **Ignoring volume**
- Low volume R2G often fails
- Always check relative volume
❌ **Fighting the market**
- R2G in a tanking market often fails
- G2R in a ripping market often fails
❌ **No stop loss**
- Failed R2G can reverse hard
- Always have a defined stop
❌ **Overtrading choppy stocks**
- Multiple R2G/G2R = no clear direction
- Skip stocks that keep crossing back and forth
---
## Quick Decision Framework
```
1. Did it open opposite color? (Red for R2G, Green for G2R)
- NO → Lower probability, be cautious
- YES → Continue
2. Is volume confirming? (1.5x+ relative volume)
- NO → Skip or small size
- YES → Continue
3. Is this the first cross of the day?
- YES → Higher probability
- NO → Be more selective
4. Is market direction supportive?
- NO → Skip
- YES → Take the trade
5. Can you define risk? (Clear stop level)
- NO → Skip
- YES → Execute
```
---
## Key Takeaways
1. **Prior close is THE key level** - everyone watches it
2. **First cross matters most** - sets daily tone
3. **Volume confirms** - low volume crosses often fail
4. **Failed crosses reverse hard** - always use stops
5. **Don't overtrade choppy action** - multiple crosses = stay out
---
Happy Trading! 🟢🔴

Colored HMA [Trend Trigger]This indicator replaces the RSI as a visual "Timing Trigger."
The Wait: As the stock drops to your support level (Volume Wall / VWAP), the HMA line will be Red/Maroon and sloping down.
The Trigger: You wait for the line to Turn Teal.
Why: This confirms the momentum has physically shifted. You aren't guessing the bottom; you are waiting for the "U-Turn" to complete.


Ultimate Trend System — Multi-Timeframe State MachineThis indicator is built for high-frequency and intraday trading (such as Micro Silver futures) and features advanced multi-timeframe signal logic:
Signal stability: BUY, SELL, and STOP are managed as a state machine. Trade signals appear only when the state changes, preventing clutter and making execution cleaner.
Multi-timeframe filtering: Trade signals on your main chart (e.g., 2-minute) are filtered by the dominant trend from higher timeframes (15min SMA and VWAP). Entry signals only appear when aligned with the higher timeframe trend.
Momentum confirmation: ATR (volatility) and QQE (momentum) must also confirm the trend direction before a signal appears.
STOP state: Only appears after a BUY or SELL state if a reversal or noise situation is detected (such as a fake breakout), helping you step aside during poor conditions.
Fakeout detection: The script identifies fake breakouts to avoid entering trades on unreliable price moves.
Optional SuperTrend module: Enable for additional trend filtering if required.
Easy to tune: All main logic and filters are parameters you can further adjust based on your own strategy tests.
Designed for day trading, trend-following algorithms, and backtesting workflows. Gives clear, uncluttered execution signals only in meaningful market regimes. Test, share your results, and feel free to optimize parameters for your own style!
本脚本针对微型银等高频短线交易场景设计,信号逻辑采用多时间框架趋势过滤 + 动能共振。具体特性如下:
主信号只在状态切换时显示,BUY/SELL/STOP互斥,避免信号堆积,更便于实盘执行。
信号触发条件需同时满足短周期动能(ATR、QQE)及15分钟趋势(SMA、VWAP)过滤,仅在趋势顺势区间出现BUY或SELL。
STOP信号仅在出现实际交易信号后才有可能触发,严格控制观望/退出点,提高策略稳健性。
FAKEOUT逻辑干扰信号,避免假突破和无效行情参与。
可选SuperTrend模块开关,进一步增强趋势识别过滤。
适合日内交易、算法跟随、程序化回测场景。欢迎回测、交流及参数联调优化!

ORB 15min: Break & ConfirmUsing the 15-minute opening candle range, this generates an alert when a 5-minute candle breaks the range and another 5-minute candle closes above the breakout candle's high or the high of any other candle that attempted to break the range.

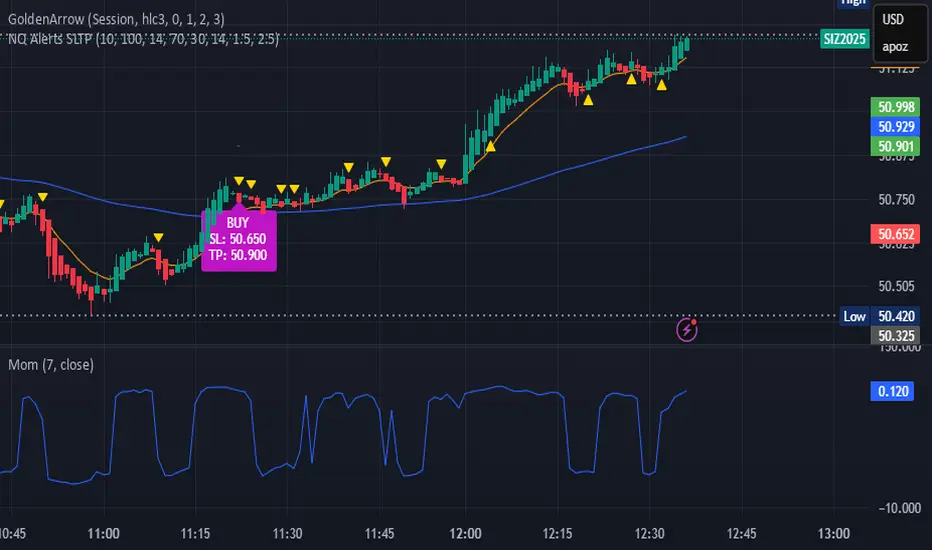
bows//@version=5
indicator("NQ EMA+RSI+ATR Alerts with SL/TP", overlay=true, shorttitle="NQ Alerts SLTP")
// === Inputs ===a
fastLen = input.int(9, "Fast EMA", minval=1)
slowLen = input.int(21, "Slow EMA", minval=1)
rsiLen = input.int(14, "RSI Length", minval=1)
rsiLongMax = input.int(70, "Max RSI to allow LONG", minval=50, maxval=90)
rsiShortMin = input.int(30, "Min RSI to allow SHORT", minval=10, maxval=50)
atrLen = input.int(14, "ATR Length", minval=1)
atrMultSL = input.float(1.5, "ATR Stop-Loss Multiplier", step=0.1)
atrMultTP = input.float(2.5, "ATR Take-Profit Multiplier", step=0.1)
// === Indicator calculations ===
price = close
fastEMA = ta.ema(price, fastLen)
slowEMA = ta.ema(price, slowLen)
rsiVal = ta.rsi(price, rsiLen)
atr = ta.atr(atrLen)
// === Entry signals ===
longSignal = ta.crossover(fastEMA, slowEMA) and rsiVal < rsiLongMax
shortSignal = ta.crossunder(fastEMA, slowEMA) and rsiVal > rsiShortMin
// === SL/TP Levels ===
longSL = price - atr * atrMultSL
longTP = price + atr * atrMultTP
shortSL = price + atr * atrMultSL
shortTP = price - atr * atrMultTP
// === Plotting ===
plot(fastEMA, color=color.orange, title="Fast EMA")
plot(slowEMA, color=color.blue, title="Slow EMA")
plotshape(longSignal, title="Buy Signal", style=shape.triangleup, color=color.new(color.green, 0), location=location.belowbar, size=size.tiny)
plotshape(shortSignal, title="Sell Signal", style=shape.triangledown, color=color.new(color.red, 0), location=location.abovebar, size=size.tiny)
// Optional visualization of SL/TP
plot(longSignal ? longSL : na, "Long Stop-Loss", color=color.new(color.red, 50), style=plot.style_linebr)
plot(longSignal ? longTP : na, "Long Take-Profit", color=color.new(color.green, 50), style=plot.style_linebr)
plot(shortSignal ? shortSL : na, "Short Stop-Loss", color=color.new(color.red, 50), style=plot.style_linebr)
plot(shortSignal ? shortTP : na, "Short Take-Profit", color=color.new(color.green, 50), style=plot.style_linebr)
// === Alerts with SL/TP info ===
alertcondition(longSignal, title="BUY Signal",
message="BUY Alert — NQ LONG: Entry @ {{close}} | SL: {{plot_1}} | TP: {{plot_2}} | {{ticker}}")
alertcondition(shortSignal, title="SELL Signal",
message="SELL Alert — NQ SHORT: Entry @ {{close}} | SL: {{plot_3}} | TP: {{plot_4}} | {{ticker}}")
// === Visual labels ===
if (longSignal)
label.new(bar_index, low, "BUY SL: " + str.tostring(longSL, format.mintick) + " TP: " + str.tostring(longTP, format.mintick),
style=label.style_label_up, color=color.new(#be14c4, 0), textcolor=color.white)
if (shortSignal)
label.new(bar_index, high, "SELL SL: " + str.tostring(shortSL, format.mintick) + " TP: " + str.tostring(shortTP, format.mintick),
style=label.style_label_down, color=color.new(color.red, 0), textcolor=color.white)
[CT] Kurutoga MTF HistogramWhat is Kurutoga MTF Histogram?
The Kurutoga MTF Histogram is a multi-time-frame momentum and mean-deviation tool.
It measures how far the current close is trading away from a rolling midpoint of price and then displays that deviation as a color-coded histogram.
Instead of looking only at one lookback, this version plots three Kurutoga “leads” at the same time:
Kurutoga Lead (x1) – base length
Kurutoga Lead 2x – slower, 2 × base length
Kurutoga Lead 4x – slowest, 4 × base length
Each lead is calculated both on the chart’s timeframe (LTF) and on a Higher Time Frame (HTF) of your choice, so you can see short-term deviation inside a higher-time-frame structure.
4-color Kurutoga scheme
Each Kurutoga lead uses a 4-color MACD-style scheme:
For a given lead:
Up Light – divergence ≥ 0 and rising compared to the previous bar
Up Dark – divergence ≥ 0 and falling (positive but losing momentum)
Down Light – divergence < 0 and falling (bearish momentum increasing)
Down Dark – divergence < 0 and rising (negative but contracting)
By default the same four teal / red hues are shared across x1, x2, and x4. The only difference between the leads is transparency:
x1 = strongest (least transparent)
x2 = medium opacity
x4 = faintest
This lets you see all three layers at once without the chart becoming a solid block of color.
The HTF areas use the same palette but with an extra transparency offset applied, so they appear as soft background bands rather than competing with the histograms.
Inputs and how to use them
1. Base Length
Defines the lookback for the main Kurutoga Lead.
The script automatically creates:
len1 = baseLength
len2 = baseLength × 2
len3 = baseLength × 4
Smaller base lengths → faster, more reactive histograms.
Larger base lengths → smoother, trend-focused behavior.
2. Higher Time Frame
This is the HTF used for the area plots and HTF midpoints.
Examples:
5-minute chart with HTF = 30 or 60 minutes
15-minute chart with HTF = 4H or 1D
The idea is to trade on the lower timeframe while seeing how far price is stretched relative to a higher-time-frame range midpoint.
3. Show / Hide toggles
Under “Show / Hide” you can independently turn on/off:
Kurutoga Lead (x1)
Kurutoga Lead 2x
Kurutoga Lead 4x
HTF Lead, HTF Lead 2x, HTF Lead 4x
This lets you:
Run only a single Kurutoga if you want a clean panel, or
Stack multiple leads for a “multi-speed” view of extension and mean reversion.
4. Color Scheme (4-color Kurutoga)
Up Light / Up Dark / Down Light / Down Dark – base hues used for every lead.
Lead opacity (x1, 2x, 4x) – sets how strong or faint each lead appears.
x1 is usually your primary “trading speed.”
x2 and x4 can be faded so they act as context.
Extra transparency for HTF areas – additional opacity applied on top of each lead’s opacity when drawing HTF areas. This keeps the HTF layer subtle.
You can fine-tune the exact teal/red values here to match your personal palette.
Practical reading & trade ideas
Trend alignment
When all three Kurutoga leads (x1, 2x, 4x) are above zero, price is trading above its rolling mid-range on multiple speeds → bullish environment.
When all three are below zero, you have a multi-speed bearish environment.
Mixed readings (e.g., x1 above zero, x4 below zero) can signal transition or mean-reversion areas.
Momentum vs exhaustion
Up Light / Down Light (light colors) show momentum expanding in that direction.
Up Dark / Down Dark (dark colors) show momentum contracting – price still on that side of zero, but the push is weakening.
After a run of Up Light bars, a shift to Up Dark may hint at a stall or pullback.
After a run of Down Light bars, a shift to Down Dark may hint at short covering / bounce potential.
Multi-time-frame confluence
Use the HTF areas as a backdrop:
If LTF Kurutoga leads are above zero while the HTF area is also positive (and ideally expanding), that’s strong bullish alignment.
If LTF leads are trying to flip up while HTF divergence is still deeply negative, you may be looking at a counter-trend bounce rather than a true trend change.
Example setups
Trend-following entries:
Look for x2 & x4 leads on the same side of zero as the HTF area, then use x1 color shifts (from Down Dark → Up Light or vice versa) to fine-tune entries in the direction of that higher-time-frame bias.
Mean-reversion fades:
Watch for extreme Kurutoga values where x1/x2 are strongly extended beyond zero while color flips from Light to Dark (momentum stalling) against an opposing HTF backdrop .
Notes
The indicator is non-directional by itself – it measures distance from a rolling midpoint rather than trend structure or order flow. It works best when combined with your existing price action/trend tools (moving averages, HLBO, structure zones, etc.).
Because HTF values are brought down via request.security, choose HTF settings that make sense for your product and session (for example, don’t use very high HTFs on thin intraday markets).
Use the Kurutoga MTF Histogram as a visual scanner for extension, momentum regime, and multi-speed alignment, then layer your own entry/exit rules on top.

Daily AVWAPsDaily AVWAPs is designed for intraday and swing traders who track institutional volume benchmarks. Instead of a single "rolling" line that resets continuously, this indicator identifies the starting timestamp of the last 5 trading sessions and draws five distinct Anchored VWAPs from those exact moments.
This allows traders to see exactly where the average volume-weighted price stands for the current day (1D), yesterday (2D), and the three days prior (3D, 4D, 5D) simultaneously.
Key Features
Polyline Visualization: Unlike standard indicators that plot historical values for every bar (creating a messy "sawtooth" effect), this script uses Pine Script Polylines. It draws clean, static lines starting from the specific anchor point to the present price, mimicking the manual "Anchored VWAP" drawing tool.
Dynamic Session Detection: The script contains zero hardcoded dates. It automatically detects when a new trading day begins based on the chart data. It works seamlessly across all asset classes (Stocks, Crypto, Futures) and automatically adjusts for weekends, holidays, and irregular trading weeks without manual updates.
Unified Color Control: Input colors are synchronized. Changing a color in the settings menu updates both the chart line and the price scale label instantly.
Toggle Controls: Individual checkboxes allow you to toggle any specific VWAP (1D through 5D) on or off to keep your chart clean.
How to Use
Trend Strength: When the 1D, 2D, and 3D VWAPs are "fanning out" in alignment, the trend is strong.
Mean Reversion: In a sideways market, price often gravitates back to the 5-Day VWAP as a "value area."
Support & Resistance: Watch for price to respect the VWAP of a previous high-volume day (e.g., bouncing off the 3D VWAP during a pullback).
Settings
Source: Select the price data source (default is OHLC4) .
Colors & Toggles: Use the checkboxes to enable/disable specific lines. Customize the color for each specific day's AVWAP directly in the Inputs tab.
This indicator was adapted and repurposed from the original work by The_Last_Gentleman .
Technical Note: This indicator is optimized for intraday timeframes (1m, 5m, 15m, 1H). Because it uses polyline and array logic to scan specific session timestamps, it calculates exclusively on the most recent bar to maintain high performance.
Ultimate Multi-Asset Correlation System by able eiei Ultimate Multi-Asset Correlation System - User Guide
Overview
This advanced TradingView indicator combines WaveTrend oscillator analysis with comprehensive multi-asset correlation tracking. It helps traders understand market relationships, identify regime changes, and spot high-probability trading opportunities across different asset classes.
Key Features
1. WaveTrend Oscillator
Main Signal Lines: WT1 (blue) and WT2 (red) plot momentum and its moving average
Overbought/Oversold Zones: Default levels at +60/-60
Cross Signals:
🟢 Bullish: WT1 crosses above WT2 in oversold territory
🔴 Bearish: WT1 crosses below WT2 in overbought territory
Higher Timeframe (HTF) Analysis: Shows WT1 from 4H, Daily, and Weekly timeframes for trend confirmation
2. Multi-Asset Correlation Tracking
Monitors relationships between:
Major Assets: Gold (XAUUSD), Dollar Index (DXY), US 10-Year Yield, S&P 500
Crypto Assets: Bitcoin, Ethereum, Solana, BNB
Cross-Asset Analysis: Correlation between traditional markets and crypto
3. Market Regime Detection
Automatically identifies market conditions:
Risk-On: High correlation + positive sentiment (🟢 Green background)
Risk-Off: High correlation + negative sentiment (🔴 Red background)
Crypto-Risk-On: Strong crypto correlations (🟠 Orange background)
Low-Correlation: Divergent market behavior (⚪ Gray background)
Neutral: Mixed signals (🟡 Yellow background)
How to Use
Basic Setup
Add to Chart: Apply the indicator to any chart (works on all timeframes)
Choose Display Mode (Display Options):
All: Shows everything (recommended for comprehensive analysis)
WaveTrend Only: Focus on momentum signals
Correlation Only: View market relationships
Heatmap Only: Simplified correlation view
Enable Asset Groups:
✅ Major Assets: Traditional markets (stocks, bonds, commodities)
✅ Crypto Assets: Digital currencies
Mix and match based on your trading focus
Reading the Charts
WaveTrend Section (Bottom Panel)
Above 0 = Bullish momentum
Below 0 = Bearish momentum
Above +60 = Overbought (potential reversal)
Below -60 = Oversold (potential bounce)
Lighter lines = Higher timeframe trends
Correlation Histogram (Colored Bars)
Blue bars: Major asset correlations
Orange bars: Crypto correlations
Purple bars: Cross-asset correlations
Bar height: Correlation strength (-50 to +50 scale)
Background Color
Intensity reflects correlation strength
Color shows market regime
Dashboard Elements
🎯 Market Regime Analysis (Top Left)
Current Regime: Overall market condition
Average Correlation: Strength of relationships (0-1 scale)
Risk Sentiment: -100% (risk-off) to +100% (risk-on)
HTF Alignment: Multi-timeframe trend agreement
Signal Quality: Confidence level for current signals
📊 Correlation Matrix (Top Right)
Shows correlation values between asset pairs:
1.00: Perfect positive correlation
0.75+: Strong correlation (🟢 Green)
0.50+: Medium correlation (🟡 Yellow)
0.25+: Weak correlation (🟠 Orange)
Below 0.25: Negative/no correlation (🔴 Red)
🔥 Correlation Heatmap (Bottom Right)
Visual matrix showing:
Gold vs. DXY, BTC, ETH
DXY vs. BTC, ETH
BTC vs. ETH
Color-coded strength
📈 Performance Tracker (Bottom Left)
Tracks individual asset momentum:
WT1 Values: Current momentum reading
Status: OB (overbought) / OS (oversold) / Normal
Trading Strategies
1. High-Probability Trend Following
✅ Entry Conditions:
WaveTrend bullish/bearish cross
HTF Alignment matches signal direction
Signal Quality > 70%
Correlation supports direction
2. Regime Change Trading
🎯 Watch for regime shifts:
Risk-Off → Risk-On = Consider long positions
High correlation → Low correlation = Reduce position size
Crypto-Risk-On = Focus on crypto longs
3. Divergence Trading
🔍 Look for:
Strong correlation breakdown = Potential volatility
Cross-asset correlation surge = Follow the leader
Volume-price correlation extremes = Trend confirmation
4. Overbought/Oversold Reversals
⚡ Trade reversals when:
WT crosses in extreme zones (-60/+60)
HTF alignment shows opposite trend weakening
Correlation confirms mean reversion setup
Customization Tips
Fine-Tuning Parameters
WaveTrend Core:
Channel Length (10): Lower = more sensitive, Higher = smoother
Average Length (21): Adjust for your timeframe
Correlation Settings:
Length (50): Longer = more stable, Shorter = more responsive
Smoothing (5): Reduce noise in correlation readings
Market Regime:
Risk-On Threshold (0.6): Lower = earlier regime signals
High Correlation Threshold (0.75): Adjust sensitivity
Custom Asset Selection
Replace default symbols with your preferred markets:
Major Assets: Any forex, indices, bonds
Crypto: Any digital currencies
Must use correct exchange prefix (e.g., BINANCE:BTCUSDT)
Alert System
Enable "Advanced Alerts" to receive notifications for:
✅ Market regime changes
✅ Correlation breakdowns/surges
✅ Strong signals with high correlation
✅ Extreme volume-price correlation
✅ Complete HTF alignment
Correlation Interpretation Guide
ValueMeaningTrading Implication+0.75 to +1.0Strong positiveAssets move together+0.5 to +0.75Moderate positiveGenerally aligned+0.25 to +0.5Weak positiveLoose relationship-0.25 to +0.25No correlationIndependent movements-0.5 to -0.25Weak negativeSlight inverse relationship-0.75 to -0.5Moderate negativeTend to move opposite-1.0 to -0.75Strong negativeStrongly inversely correlated
Best Practices
Use Multiple Timeframes: Check HTF alignment before trading
Confirm with Correlation: Strong signals work best with supportive correlations
Watch Regime Changes: Adjust strategy based on market conditions
Volume Matters: Enable volume-price correlation for confirmation
Quality Over Quantity: Trade only high-quality setups (>70% signal quality)
Common Patterns to Watch
🔵 Risk-On Environment:
Gold-BTC positive correlation
DXY negative correlation with risk assets
High crypto correlations
🔴 Risk-Off Environment:
Flight to safety (Gold up, stocks down)
DXY strength
Correlation breakdowns
🟡 Transition Periods:
Low correlation across assets
Mixed HTF signals
Use caution, reduce position sizes
Technical Notes
Calculation Period: Uses HLC3 (average of high, low, close)
Correlation Window: Rolling correlation over specified length
HTF Data: Accurately calculated using security() function
Performance: Optimized for real-time calculation on all timeframes
Support
For optimal performance:
Use on 15-minute to daily timeframes
Enable only needed asset groups
Adjust correlation length based on trading style
Combine with your existing strategy for confirmation
Enjoy comprehensive multi-asset analysis! 🚀

Long Short Lien TucRSI Long Short Continuum
The RSI Long Short Continuum unveils a meticulously engineered paradigm for decoding market momentum, transcending the rudimentary confines of the traditional Relative Strength Index (RSI). By orchestrating a symphony of Exponential Moving Average (EMA) and Weighted Moving Average (WMA) dynamics, this indicator distills the chaotic oscillations of price action into a refined lattice of actionable signals. Its esoteric methodology probes the undercurrents of trend expansion and contraction, harnessing real-time price flux to illuminate pivotal junctures of market intent.
Core Constructs:
• RSI (Period 14): A sentinel of momentum, its chromatic transmutations—crimson at ≥80, verdant at ≤20—herald zones of exuberance or capitulation.
• EMA (Period 9) of RSI: A mercurial filter that tempers the RSI’s caprice, tracing the ephemeral shifts in market fervor with surgical precision.
• WMA (Period 45) of RSI: An anchor of gravitas, weaving a tapestry of long-term momentum to sieve transient noise from enduring trends.
• Trend Expansion Logic: A proprietary calculus that discerns anomalous divergences between RSI and WMA, auguring moments of kinetic eruption or subsidence.
• Real-Time Signal Nexus: By interrogating live candle data, the indicator conjures buy and sell sigils—triangular glyphs of intent—poised at the precipice of momentum reversal.
Operational Codex:
The Continuum operates as a dualistic oracle, simultaneously charting the ebb of momentum and the crescendo of trend potential. Its signals emerge from a confluence of arcane conditions:
• Buy Signals: Manifest when RSI ascends past the EMA in the wake of a downtrend’s distension, with the EMA’s curvature aligning toward convergence with the WMA. The slope of the EMA, ascending gently, corroborates the nascent resurgence, while a disciplined proximity between EMA and WMA ensures fidelity.
• Sell Signals: Crystallize as RSI descends beneath the EMA following an uptrend’s apogee, with the EMA’s declivity and narrowing EMA-WMA interstice heralding exhaustion. The antecedent trend’s vigor, now waning, validates the signal’s portent.
• Trend Divination: The EMA’s ascent above the WMA augurs a burgeoning momentum, while its descent portends enervation. The indicator’s vigilance over trend expansion—gauged through aberrant RSI-WMA disparities—unveils moments of latent reversal.
Distinction from Orthodoxy:
Unlike the prosaic RSI, tethered to static thresholds of overbought and oversold, the Continuum probes deeper strata of market dynamics. Its fusion of EMA slope analysis, WMA-referenced trend anchoring, and real-time divergence detection transcends conventional momentum paradigms. By eschewing the banal reliance on fixed levels, it navigates the liminal spaces of price flux, offering prescience where others falter.
Application Mandala:
• Optimal Context: The Continuum thrives in the crucible of short-term frameworks—5 to 15-minute charts—where its real-time alchemy captures fleeting dislocations in forex, equities, or volatile indices.
• Strategic Deployment: Seek buy signals in the aftermath of oversold retrenchments, corroborated by EMA-WMA convergence; deploy sell signals at the zenith of overbought exuberance, tempered by trend exhaustion cues.
• Complementary Synthesis: Augment with support/resistance confluences or volume surges to refine entry precision.
Caveat Emporium:
This construct serves as a lens for technical divination, not an infallible prophecy. Markets, in their probabilistic dance, elude certainty. Practitioners are adjured to wield robust risk protocols and seek confluence across manifold analytical vectors before committing capital.

Delta Signals NO REPINTA (FINAL)📢 New Indicator: Delta Signals NO REPAINT 🔥
Introducing my new indicator based on Order Flow Delta, designed to provide buy and sell signals with absolutely NO repainting — perfect for scalping, day trading, or swing trading.
This tool combines two powerful components:
✅ Order Flow Delta — Measures the real strength between buyers and sellers
✅ Smart Trend Filter — Only shows signals in the direction of the dominant trend
Together, they deliver cleaner, more accurate and more reliable signals, with clear entry markers on the chart and a delta histogram revealing real market pressure.
🚀 What’s Included?
🔹 Buy/Sell signals with NO repaint
🔹 Intelligent delta calculation
🔹 Trend filter using moving average
🔹 Clear labels on entry points
🔹 Visual delta histogram
🔹 Works great on Crypto, Forex, Indices & Stocks
🔹 Very lightweight and fast on TradingView
🎯 Why is it powerful?
Because it doesn't rely on lagging indicators — it reads the actual imbalance between buyers and sellers, often detecting strong moves before traditional indicators do.
This type of analysis is used by professional order flow traders, but now you have it on your TradingView chart in a simple, visual format.
🔥 Perfect for:
Scalpers who need precision
Day traders working breakouts and pullbacks
Swing traders seeking strong confirmations
Traders who want clean, NO-repaint signals
If you want a version with automatic TP/SL, alerts, or full backtesting, I can publish that as well.
Just let me know. 🚀📈

Bull Flag & Flat Top Breakout DetectorBull Flag & Flat Top Detector - Quick Reference Guide
Pattern Overview
🚩 Bull Flag
╱╲
╱ ╲ ← Pullback (2-5 red candles)
╱ ╲
╱ ╲____
╱ ╲
│ │
│ THE POLE │ ← Strong upward move (3+ green candles)
│ │
└──────────────┘
What to look for:
Strong initial move (the "pole") - 3+ green candles, 3%+ move
Brief pullback - 2-5 candles, less than 50% retracement
Pullback should "drift" lower, not crash
Entry on first candle to make new high after pullback
📊 Flat Top Breakout
════════════════ ← Resistance (multiple touches)
↑ ↑ ↑
╱╲ ╱╲ ╱╲
╱ ╲╱ ╲╱ ╲ ← Consolidation
╱ ╲
╱ ╲
What to look for:
Multiple touches of same resistance level (2+)
Tight consolidation range
Each failed breakout builds pressure
Entry on convincing break above resistance with volume
Signal Types
SignalShapeColorMeaningBull Flag Breakout▲ TriangleLimeEntry signal - go longFlat Top Breakout◆ DiamondAquaEntry signal - go longBear Flag Breakout▼ TriangleRedShort entry (if enabled)Pattern Forming🚩 FlagFaded GreenBull flag developingPattern Forming■ SquareFaded BlueFlat top developing
Level Lines Explained
LineColorStyleMeaningEntryLimeSolidBreakout trigger priceStop LossRedDashedExit if price falls hereTarget 1AquaDottedFirst profit target (2R)Target 2YellowDottedSecond profit target (3R)
Info Table Reference
FieldWhat It ShowsBull FlagScanning / Forming 🚩 / Breakout ✓Flat TopScanning / Forming 📊 / Breakout ✓PullbackCandle count + retracement %Rel VolumeCurrent bar vs averageEMA 20Above ✓ or Below ✗VWAPAbove ✓ or Below ✗Green StreakConsecutive green candles (pole)ResistanceTouch count for flat top
Trading Checklist
Before Entry ✅
Pattern status shows "FORMING" or "BREAKOUT"
Price above EMA (table shows ✓)
Price above VWAP (table shows ✓)
Relative volume 1.5x+ (ideally 2x+)
Stock is in play (up 5%+ on day, has catalyst)
Market direction supportive (not fighting trend)
Entry Execution
Wait for breakout candle to form
Confirm volume spike on breakout
Enter as close to entry line as possible
Set stop loss at red dashed line
Know your target levels
Trade Management
If no immediate follow-through → consider exit ("breakout or bailout")
Take 50% off at Target 1
Move stop to breakeven
Let remainder run toward Target 2
Exit fully if price returns below entry
Bull Flag Quality Checklist
Pole Quality:
FactorIdealAcceptableAvoidGreen candles5+3-4Less than 3Move size10%+3-10%Less than 3%VolumeIncreasingSteadyDecliningCandle bodiesLargeMediumSmall/doji
Pullback Quality:
FactorIdealAcceptableAvoidCandle count2-34-56+RetracementUnder 38%38-50%Over 50%VolumeDecliningSteadyIncreasingCharacterOrderly driftChoppySharp drop
Flat Top Quality Checklist
FactorGood SetupWeak SetupTouches3+ at same levelOnly 2, widely spacedToleranceVery tight (0.2%)Loose (1%+)Duration5-15 barsToo short or too longVolumeDrying upErraticPrior trendUpSideways/down
Common Mistakes to Avoid
❌ Entering too early
Wait for actual breakout, not anticipation
"Forming" ≠ "Breakout"
❌ Ignoring volume
No volume = likely false breakout
Require 1.5x+ relative volume minimum
❌ Fighting the trend
Check EMA and VWAP status
Both should be ✓ for high probability
❌ Wide stops
Stop should be below pullback low
If stop is too wide, skip the trade
❌ Holding losers
"Breakout or bailout" - if it doesn't work, exit
Failed breakouts often reverse hard
❌ Chasing extended moves
If you missed entry, wait for next pattern
Don't chase 5+ candles after breakout
Risk Management Rules
Position Sizing
Risk Amount = Account × Risk % (typically 1-2%)
Position Size = Risk Amount ÷ (Entry - Stop)
Example:
Account: $25,000
Risk: 1% = $250
Entry: $5.00
Stop: $4.70
Risk per share: $0.30
Position Size: $250 ÷ $0.30 = 833 shares
Risk-Reward Targets
TargetR MultipleExample (risk $0.30)Target 12:1+$0.60 ($5.60)Target 23:1+$0.90 ($5.90)
Timeframe Guide
TimeframeProsConsBest For1-minMore patterns, precise entryNoisy, false signalsScalping5-minGood balance, cleaner patternsFewer signalsDay trading15-minHigh quality patternsMiss fast movesSwing entries
Settings Quick Reference
Default Settings (Balanced)
Pole: 3 candles, 3% move
Pullback: 2-5 candles, 50% max retrace
Volume: 1.5x required
Filters: EMA + VWAP ON
Aggressive Settings
Pole: 2 candles, 2% move
Pullback: 2-6 candles, 60% max retrace
Volume: 1.2x required
Filters: VWAP OFF
Conservative Settings
Pole: 4 candles, 5% move
Pullback: 2-4 candles, 40% max retrace
Volume: 2.0x required
Filters: Both ON
Alert Setup
Recommended Alerts
"Bull Flag Forming"
Get early warning as pattern develops
Prepare your position size and levels
"Bull Flag Breakout"
Primary entry alert
React quickly when triggered
"Any Bullish Breakout"
Catch both bull flags and flat tops
Good for watchlist scanning
Alert Setup Steps
Right-click chart → Add Alert
Condition: Select "Bull Flag & Flat Top Breakout Detector"
Choose alert type from dropdown
Set expiration and notification method
Troubleshooting
Q: Patterns not detecting?
Lower the Min Pole Move % setting
Reduce Min Pole Candles requirement
Check that price is in acceptable range
Q: Too many false signals?
Increase volume multiplier to 2.0x
Enable both EMA and VWAP filters
Increase Min Pole Move %
Q: Levels not showing?
Enable "Show Entry Line", "Show Stop Loss", "Show Targets"
Check "Max Patterns to Display" setting
Q: Info table not visible?
Enable "Show Info Table" in settings
Try different table position
Pattern Combinations
Best Setups (A+ Quality)
Bull flag on a gap day (Gap & Go → Bull Flag)
Flat top at pre-market high resistance
Pattern forming above VWAP with 5x+ volume
Avoid These
Bull flag below VWAP
Flat top in downtrending stock
Low volume patterns
Patterns late in the day (after 2pm)
Daily Routine
Pre-Market (7-9am)
Build watchlist of gappers (5%+, high volume)
Apply indicator to top 3-5 candidates
Note pre-market levels
Market Open (9:30-10:30am)
Watch for "FORMING" status on watchlist
Prepare entries as patterns develop
Execute on breakout signals
Manage trades according to plan
Midday (10:30am-2pm)
Look for second-wave patterns
Be more selective (less momentum)
Consider tighter stops
Close (2-4pm)
Generally avoid new patterns
Manage existing positions
Review day's trades

Bitcoin Buy-the-Dip + Bottom (Auto TF Swtich)This indicator is designed for friends who wish to invest in Bitcoin but are neither familiar with trading nor have the time/energy to learn it, helping them buy Bitcoin at the right timing.
It is intended only for daily , weekly , and monthly charts, and should be used as follows:
- In a bull market cycle: When Bitcoin’s price falls below the Dip line , allocate 25% of your position to buy Bitcoin.
- When the daily chart forms a clear lower low, it signals the transition from a bull market to a bear market.
- In a bear market cycle: When Bitcoin’s price drops below the Bottom line , consider deploying a large position to accumulate Bitcoin.
Wishing you all financial freedom—and To The Moon! 🚀

SMA Close/High/Low with Input LengthCustom SMA Indicator on TradingView: Close, High, and Low
This TradingView Pine Script indicator plots three Simple Moving Averages (SMAs) on the main price chart using the closing, high, and low prices of the asset. Unlike a standard SMA that considers only the closing price, this indicator gives you insights into the average price behavior from three different perspectives simultaneously.
What It Does
Calculates a 20-period (default) SMA of the Closing price to show the average trend of closing prices.
Calculates a 20-period SMA of the High price to track the average upper price movement.
Calculates a 20-period SMA of the Low price to track the average lower price movement.
All three lines are overlaid on the price chart for easy comparison.
The SMA length is adjustable by the user via an input box, making the indicator versatile for different trading timeframes and strategies.

SCOTTGO - DAY TRADE STOCK QUOTEThis indicator is a comprehensive, customizable information panel designed for active day traders and scalpers. It consolidates key financial, volatility, volume, and ownership metrics into a single, clean table overlaid on your chart, eliminating the need to constantly switch tabs or look up data externally.

AnAn Master: VWAP + EMA9/21 + Spike Arrows (simple)AnAn Master: VWAP + EMA9/21 + Spike Arrows (simple)AnAn Master: VWAP + EMA9/21 + Spike Arrows (simple)

Volume Spike Bars (AnAn Edition)volume spike indicators that will help show you when volume is spiking
