Marx Current Trend DisplayMarx Current Trend Display
Identify trend direction instantly on any timeframe
This indicator gives you a clear, visual confirmation of the current market trend — Bullish or Bearish — based on price action relative to a customisable Exponential Moving Average (EMA).
⸻
✅ Features
• Dynamically determines trend using a user-defined EMA (default: 200)
• Shows a floating label above price:
• 🟢 “BULLISH TREND” when price is above EMA
• 🔴 “BEARISH TREND” when price is below EMA
• Optional color-coded background to make trend state even more obvious
• Works on any market and timeframe
• Simple, clean, and easy to interpret
⸻
🧠 How It Works
• Bullish Trend: Current price is above the EMA
• Bearish Trend: Current price is below the EMA
• EMA is plotted directly on the chart for additional clarity
⸻
⚙️ Customisable Settings
• EMA length (default: 200)
• Show/hide trend labels
• Toggle background color on/off
⸻
This is a perfect tool for traders who want quick confirmation of trend bias without clutter. Pair it with your entry/exit system or use it as a filter to stay aligned with market momentum.
Indicators and strategies

XAUUSD Fake Breakout Reversal Strategy - SunAlgoXAUUSD Fake Breakout Reversal Strategy | Intraday Gold Scalper
Created by SunAlgo
This indicator is built for intraday XAUUSD (Gold/USD) traders who want to capitalize on fake breakouts and liquidity traps during the high-volatility London–New York session overlap.
🚀 Key Features:
Automatically plots the Asian session high and low (00:00–08:00 UTC).
Detects false breakouts (liquidity sweeps) beyond the session range.
Confirms reversals using bullish/bearish engulfing candles.
Provides clean Buy (🔼) and Sell (🔽) signals directly on the price chart.
📈 Strategy Summary:
Gold often makes deceptive breakouts post-Asian session to trap traders.
This indicator captures those moves and signals potential reversals based on pure price action.
Best used on 15-minute charts during London–New York overlap.
🧠 Trading Guidelines:
Wait for the Asian range to be drawn after 08:00 UTC.
Look for price to break the range and close back inside.
Enter trades at signal candles with appropriate SL/TP levels.
⚠️ Disclaimer:
This indicator is for educational purposes only. Always apply risk management and confirm signals with your own judgment.

Breakout Confirmation🔍 Indicator Name: Breakout Confirmation (Body + Volume)
📌 Purpose:
This indicator is designed to detect high-probability breakout setups based on price structure and volume strength. It identifies moments when the market breaks through a key support or resistance level, confirmed by two consecutive strong candles with large real bodies and high volume.
⚙️ How It Works
1. Support and Resistance Detection
The indicator uses pivot points to identify potential horizontal support and resistance levels.
A pivot high or pivot low is considered valid if it stands out over a configurable number of candles (default: 50).
Only the most recent valid support and resistance levels are tracked and displayed as horizontal lines on the chart.
2. Breakout Setup
The breakout condition is defined as:
First Candle (Breakout Candle):
Large body (compared to the recent body average)
High volume (compared to the recent volume average)
Must close beyond a resistance or support level:
Close above resistance (bullish breakout)
Close below support (bearish breakout)
Second Candle (Confirmation Candle):
Also must have a large body and high volume
Must continue in the direction of the breakout (i.e., higher close in bullish breakouts, lower close in bearish ones)
3. Signal Plotting
If both candles meet the criteria, the indicator plots:
A green triangle below the candle for bullish breakouts
A red triangle above the candle for bearish breakouts
📈 How to Interpret the Signals
✅ Green triangle below a candle:
Indicates a confirmed bullish breakout.
The price has closed above a recent resistance level with strength.
The trend may continue higher — possible entry for long positions.
🔻 Red triangle above a candle:
Indicates a confirmed bearish breakout.
The price has closed below a recent support level with strength.
Potential signal to enter short or exit long positions.
⚠️ The plotted horizontal lines show the last key support and resistance levels. These are the zones being monitored for breakouts.
📊 How to Use It
Timeframe: Works best on higher timeframes (1H, 4H, Daily), but can be tested on any chart.
Entry: Consider entries after the second candle confirms the breakout.
Stop Loss:
For longs: Below the breakout candle or the broken resistance
For shorts: Above the breakout candle or broken support
Take Profit:
Based on previous structure, risk:reward ratios, or using trailing stops.
Filter with Trend or Other Indicators (optional):
You can combine this with moving averages, RSI, or market structure for confluence.
🛠️ Customization Parameters
lengthSR: How many candles to look back for identifying support/resistance pivots.
volLength: Length of the moving average for volume and body size comparison.
bodyMultiplier: Multiplier threshold to define a “large” body.
volMultiplier: Multiplier threshold to define “high” volume.
✅ Ideal For:
Price action traders
Breakout traders
Traders who use volume analysis
Anyone looking to automate the detection of breakout + confirmation setups


MACD-VWAP-BB IndicatorMACD-VWAP-BB Indicator Description
This Pine Script creates a technical analysis indicator called the "MACD-VWAP-BB Indicator" for use on TradingView. It combines three popular indicators—MACD (Moving Average Convergence Divergence), VWAP (Volume Weighted Average Price), and Bollinger Bands—to generate buy and sell signals on a chart. The indicator plots visual signals (triangles) to help traders identify potential entry points based on the combined signals from these indicators.
What This Indicator Does
Calculates MACD: Measures momentum by comparing two moving averages of the price.
Calculates VWAP: Tracks the average price weighted by volume to gauge whether the price is above or below a "fair" value.
Calculates Bollinger Bands: Identifies volatility and potential overbought or oversold conditions based on price deviation from a moving average.
Combines Signals: Merges the signals from MACD, VWAP, and Bollinger Bands to create a single oscillator.
Generates Buy/Sell Signals: Plots green triangles below the price for buy signals and red triangles above for sell signals when all indicators align.
How It Works
Inputs You Can Customize:
MACD Fast Length (Default: 6): The shorter moving average period for MACD.
MACD Slow Length (Default: 13): The longer moving average period for MACD.
MACD Signal Length (Default: 5): The period for the MACD signal line.
Bollinger Bands Length (Default: 10): The period for calculating the Bollinger Bands' moving average.
Bollinger Bands Multiplier (Default: 1.5): Controls the width of the Bollinger Bands.
VWAP Lookback (Default: 7): The period for calculating VWAP.
Signal Line Smoothing Period (Default: 5): Smooths the combined signal for clarity.
Signal Confirmation Delay (Default: 1): The number of bars to confirm a signal, reducing false signals.
Indicator Calculations:
MACD: Generates a +1 signal for bullish crossovers (MACD line above signal line) or -1 for bearish crossunders.
VWAP: Gives a +1 signal if the price is above VWAP (bullish) or -1 if below (bearish).
Bollinger Bands: Signals +1 if the price is above the upper band (overbought) or -1 if below the lower band (oversold).
Combined Signal: Adds the three signals (ranging from -3 to +3) and smooths them to create an oscillator.
Buy/Sell Signals: A buy signal occurs when the combined signal is +3 (all indicators bullish) and the oscillator crosses above its signal line. A sell signal occurs when the combined signal is -3 (all indicators bearish) and the oscillator crosses below its signal line. Signals are confirmed within the specified delay period.
Visual Output:
Buy Signals: Green triangles appear below the price bars when conditions for a buy are met.
Sell Signals: Red triangles appear above the price bars when conditions for a sell are met.
How to Use It
Add to Chart:
Copy the script into TradingView’s Pine Editor.
Click "Add to Chart" to apply it to your selected chart.
Adjust Inputs:
Go to the indicator’s settings to tweak parameters like MACD lengths, Bollinger Bands multiplier, or VWAP lookback to suit your trading style.
Interpret Signals:
Look for green triangles below bars for potential buy opportunities.
Look for red triangles above bars for potential sell opportunities.
Use in conjunction with other analysis tools, as no indicator guarantees profits.
Test First:
Backtest the indicator on historical data or use it in a demo account to understand its behavior before trading with real money.
Important Notes
Educational Purpose: This indicator is designed to assist with technical analysis and is not financial advice. Always conduct your own research before trading.
Risk Warning: Trading involves risks, and past performance does not guarantee future results. Use this indicator as part of a broader trading strategy.
Customization: Adjust the input settings to match your preferred timeframe or market (e.g., stocks, forex, crypto).
Limitations: The indicator may produce false signals in choppy or low-volatility markets. The confirmation delay helps reduce this but doesn’t eliminate it entirely.
Compliance with TradingView Rules
This script is shared under the Mozilla Public License 2.0, as noted in the code.
No proprietary claims are made, and the script is provided for educational purposes.
The description avoids promising specific trading results or profits, focusing on functionality and usage.

Shade ET Sessions: 1–3 AM & 9–10:30 AMTo identify XAUUSD trading sessions where the London open preceded a by NY extension.


Line at Custom Price📌 Script Title: Line at Custom Price
📝 Description:
Draw a clean and customizable horizontal line at any price level you define.
This simple but effective indicator is perfect for marking psychological levels, round numbers (e.g., 100k BTC), support/resistance zones, or target areas. Use it to visually track key price levels without cluttering your chart.
⸻
🔧 Features:
• 🔹 Customizable input for any price level (default: 103,000)
• 🔹 Bold, dashed red line overlay for maximum visibility
• 🔹 Works on all timeframes and assets
• 🔹 Ideal for marking breakout zones, profit targets, or alert areas
⸻
💡 Usage Ideas:
• Set a key resistance level like 103000 on BTC
• Track liquidation zones or Fibonacci targets
• Combine with other indicators like Moving Averages or VWAP

EMA Confluence Zones — Dynamic Support/ResistanceThis indicator identifies zones where multiple EMAs converge tightly together, which often act as dynamic support or resistance. You can customize which EMAs to include and define the maximum % spread between them to trigger a “confluence zone.”
🔧 How to Use
Use default EMAs (8, 13, 21, 34) or add your own.
Zones appear when EMAs are within a tight price range (configurable).
Look for price pullbacks into these zones for entries or continuation plays.
Great for trend traders and smart money setups.
Visual and adaptive — this indicator shows you where institutions might be stacking positions.

Candle Body Pressure HeatmapThis indicator colors candles based on the strength of their real body relative to the total candle range (body + wicks). Strong bullish and bearish candles are highlighted with brighter colors, while weak or indecisive candles are shaded softly. Optional arrows mark high-conviction candles when volume exceeds the 20-period average.
🔧 How to Use
Bright Green = Strong Bullish Pressure (large body, small wicks, high volume)
Bright Red = Strong Bearish Pressure
Faded Candles = Weak conviction (spinning tops, doji-like)
Arrows signal strong candles backed by above-average volume.
Enable the volume filter to hide fake moves during low activity.
Useful for price action traders who want to focus on meaningful candles only. Combine with support/resistance or trendlines for better confirmation.

VWAP Bands with Volume PressureThis indicator plots a session-based VWAP (Volume Weighted Average Price) with dynamic standard deviation bands. The VWAP line is color-coded based on volume pressure — green when volume increases, red when it decreases — providing an instant view of market momentum.
💡 How to use it:
VWAP Line: Used as a dynamic fair value. Price above VWAP may suggest bullish pressure, below VWAP bearish.
Upper/Lower Bands: Represent overbought and oversold zones based on real-time volatility (standard deviation). When price touches or exceeds a band, it may signal:
A potential reversal zone (mean reversion)
Or a breakout continuation if supported by volume
Color of VWAP:
🔹 Green VWAP: increasing volume — confirms price move
🔻 Red VWAP: decreasing volume — caution, move may lack strength
📈 Useful for intraday traders, scalpers, and swing traders wanting to combine price and volume dynamics in a clean visual way.

Range Box (Manual Bar Index)Here’s a clear and public-facing description of your **Range Box with Manual Bar Index** tool for TradingView, written for traders of all experience levels:
---
### 📦 Range Box (with Manual Bar Selection)
**Description:**
The **Range Box with Manual Bar Index** is a visual tool designed for traders who want to **analyze historical price action** with precision. Rather than relying on live, real-time data only, this version allows you to **manually select any past bar** on your chart to display detailed range metrics for that specific candle.
---
### 🔍 Features:
* **Manual Bar Selection:** Input the bar index (distance from the most recent candle) to inspect.
* **Range Metrics Displayed:**
* **Range:** High - Low of the selected bar
* **Average Range:** Calculated over a customizable lookback period
* **ATR Multiples:** Shows 1.5× and 2× ATR values for volatility comparison
* **Customizable Positioning:** Text box can be offset on the X (bars) and Y (price) axis for visibility
* **Color-Coded Alerts:** Highlights if the range exceeds normal behavior based on ATR multipliers
---
### 🛠 Use Cases:
* Identify **unusual volatility** in prior bars
* Study historical **breakout ranges** or compression candles
* Train your eye to spot **institutional-sized bars** versus average price action
* Prep screenshots for analysis, reports, or educational posts
---
### 📌 How to Use:
1. Add the script to your chart
2. Set the **"Bar Index"** to the number of bars back you want to analyze (e.g., `0` = current, `1` = one bar ago)
3. The script will draw a **box around the candle**, and display key range info nearby
---
Would you like a copy-and-paste version of this for TradingView's Public Library description or script header?

Multi-Session MarkerMulti-Session Marker is a flexible visual tool for traders who want to highlight up to 10 custom trading sessions directly on their chart’s background.
Custom Sessions: Enter up to 10 time ranges (in HHMM-HHMM format) to mark any market session, news window, or personal focus period.
Visual Clarity: For each session, toggle the highlight on or off and select a unique background color and opacity, making it easy to distinguish active trading windows at a glance.
Universal Time Handling: Session times automatically follow your chart’s time zone—no manual adjustment required.
Efficient and Fast: Utilizes TradingView’s bgcolor() for smooth performance, even on fast timeframes like 1-second charts.
Clean Interface: All session controls are grouped for easy editing in the indicator’s settings panel.
How to use:
In the indicator settings, enter your desired session times (e.g., 0930-1130) for each session you want to highlight.
Toggle “Show Session” and pick a color for each session.
The background will automatically highlight those periods on your chart.
This indicator is ideal for day traders, futures traders, or anyone who wants to visually segment their trading day for better focus and analysis.

🔥 lucy FullPower_VTS)🐂🐻 BULL and BEAR CHRONICLES
Author: Lucifer
Version: 1.0
Script Type: Overlay / Strategy (specify based on your script)
Tags: bullish, bearish, trend detection, price action, Lucifer, MACD, EMA, volume filter, breakouts, sideways filter, RSI, VWAP
🔥 Overview
BULL and BEAR CHRONICLES by Lucifer is a high-precision, multi-factor trading framework designed to track the ongoing battle between bullish surges and bearish breakdowns. This script combines trend logic, momentum, volume dynamics, and sideways filtering into one coherent system that visually narrates who’s in control—the bulls or the bears.
Built for traders who value structure, confirmation, and clarity, this tool helps you avoid fakeouts and stay aligned with true momentum.
🧠 What It Does
✅ Trend Detection using fast/slow EMAs (e.g. 8/34)
🔄 Momentum Confirmation with MACD crossovers & RSI extremes
🧱 VWAP anchor for institutional price zones
🔊 Volume Spike Detection (relative to recent range)
📉 Sideways Market Filter to avoid entering during low-probability zones
🛑 SL/TP Calculation Zones based on % distance from entry
🎯 Visual Highlights
Color-coded candles or backgrounds based on trend strength
Volume-sensitive visual effects to highlight accumulation/distribution
Optional SL/TP logic for manual trade placement or automation hooks
🧪 Ideal For
Traders who prefer confluence over chaos
Visual learners looking to read market structure at a glance
Systems that thrive in clear bullish or bearish conditions
⚠️ Disclaimer
This tool is designed for educational purposes and discretionary analysis. It does not provide financial advice, and Lucifer (the author) is not responsible for trading outcomes. Always apply proper risk management and test strategies before using real capital.

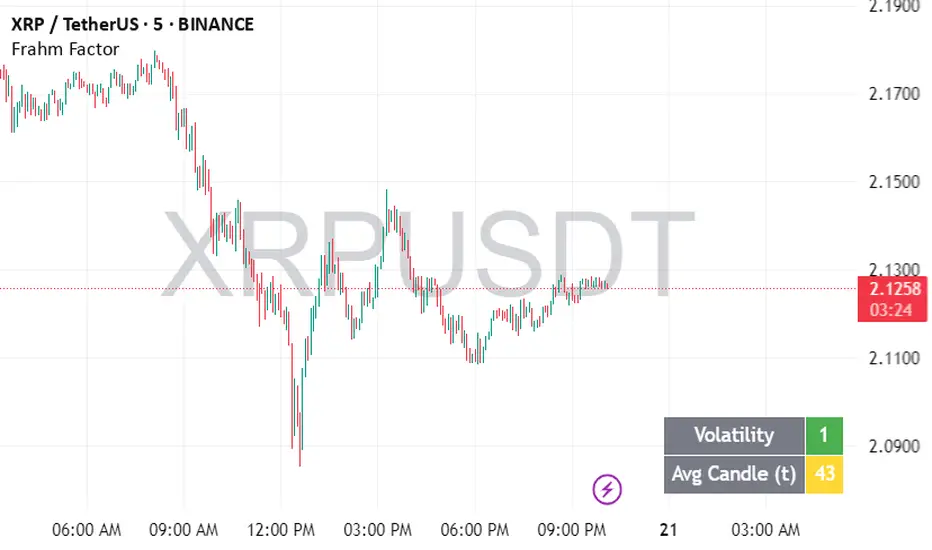
Frahm FactorIntended Usage of the Frahm Factor Indicator
The Frahm Factor is designed to give you a rapid, at-a-glance assessment of how volatile the market is right now—and how large the average candle has been—over the most recent 24-hour window. Here’s how to put it to work:
Gauge Volatility Regimes
Volatility Score (1–10)
A low score (1–3, green) signals calm seas—tight ranges, low risk of big moves.
A mid score (4–6, yellow) warns you that volatility is picking up.
A high score (7–10, red) tells you to prepare for disorderly swings or breakout opportunities.
How to trade off it
In low-volatility periods, you might favor mean-reversion or range-bound strategies.
As the score climbs into the red zone, consider widening stops, scaling back position size, or switching to breakout momentum plays.
Monitor Average Candle Size
Avg Candle (ticks) cell shows you the mean true-range of each bar over that 24h window in ticks.
When candles are small, you know the market is consolidating and liquidity may be thin.
When candles are large, momentum and volume are driving strong directional bias.
The optional dynamic color ramp (green→yellow→red) immediately flags when average bar size is unusually small or large versus its own 24h history.
Customize & Stay Flexible
Timeframes: Works on any intraday chart—from 1-minute scalping to 4-hour swing setups—because it always looks back exactly 24 hours.
Toggles:
Show or hide the Volatility and Avg-Candle cells to keep your screen uncluttered.
Turn on the dynamic color ramp only when you want that extra visual cue.
Alerts: Built-in alerts fire automatically at meaningful thresholds (Volatility ≥ 8 or ≤ 3), so you’ll never miss regime shifts, even if you step away.
Real-World Applications
Risk Management: Automatically adjust your stop-loss distances or position sizing based on the current volatility band.
Strategy Selection: Flip between range-trading and momentum strategies as the volatility regime changes.
Session Analysis: Pinpoint when during the day volatility typically ramps—perfect for doorway sessions like London opening or the US midday news spikes.
Bottom line: the Frahm Factor gives you one compact dashboard to see the pulse of the market—so you can make choices with conviction, dial your risk in real time, and never be caught off guard by sudden volatility shifts.
Logic Behind the Frahm Factor Indicator
24-Hour Rolling Window
On every intraday bar, we append that bar’s True Range (TR) and timestamp to two arrays.
We then prune any entries older than 24 hours, so the arrays always reflect exactly the last day of data.
Volatility Score (1–10)
We count how many of those 24 h TR values are less than or equal to the current bar’s TR.
Dividing by the total array size gives a percentile (0–1), which we scale and round into a 1–10 score.
Average Candle Size (ticks)
We sum all TR values in the same 24 h window, divide by array length to get the mean TR, then convert that price range into ticks.
Optionally, a green→yellow→red ramp highlights when average bar size is unusually small, medium or large versus its own 24 h history.
Color & Alerts
The Volatility cell flips green (1–3), yellow (4–6) or red (7–10) so you see regime shifts at a glance.
Built-in alertcondition calls fire when the score crosses your high (≥ 8) or low (≤ 3) thresholds.
Modularity
Everything—table location, which cells to show, dynamic coloring—is controlled by simple toggles, so you can strip it back or layer on extra visual cues as needed.
That’s the full recipe: a true 24 h look-back, a percentile-ranked volatility gauge, and a mean-bar-size meter, all wrapped into one compact dashboard.
EMA Crossover with Stop Loss LabelEMA Crossover Strategy with Dynamic Stop Loss
This indicator generates Buy and Sell signals based on the crossover of two customizable EMAs. Each signal is accompanied by a real-time Stop Loss, calculated from the previous candle's high or low:
✅ Buy Signal: When Fast EMA crosses above Slow EMA 📍 Stop Loss = Previous candle’s Low
❌ Sell Signal: When Fast EMA crosses below Slow EMA 📍 Stop Loss = Previous candle’s High
Key Features:
User-defined EMA lengths
Clean Buy/Sell labels directly on the chart
Real-time Stop Loss annotations for precision risk management
Ideal for trend-following and swing trading strategies

Multi-Timeframe Trend Heatmap (EMA/RSI Based)Multi-Timeframe Trend Heatmap is a compact visual indicator that shows trend direction across multiple timeframes at a glance.
You can choose between two trend detection methods:
✅ EMA: Price compared to an exponential moving average
✅ RSI: Overbought/oversold zone filtering (above 55 = bullish, below 45 = bearish)
🔍 How it works:
For each timeframe (up to 3), the script checks whether the trend is bullish, bearish, or neutral.
The result is shown as a heatmap using colored bars:
🟩 Green = Bullish
🟥 Red = Bearish
⬜ Gray = Neutral
✅ Features:
Select up to 3 custom timeframes (ex: 5min / 15min / 1h)
Choose between EMA or RSI trend logic
Works in a separate pane (non-overlay)
This indicator is especially useful for scalpers and intraday traders who want a quick and reliable overview of multi-timeframe alignment.

Three EMA Indicatortree moving avCertainly! Here's a simple script for a trading indicator that incorporates three Exponential Moving Averages (EMA): EMA 114, EMA 20, and EMA 50. This script is written in Pine Script, the language used for developing indicators in TradingView.arage

XRP Alert Strategy - 3X CycleBottom Watch → $1.60 and $1.50 triggers
Reversal Signals → RSI breakout & EMA crossover
Profit Zone Targets → $3.00 and $4.50 levels
(Optional): Volume spike logic for top signal

2 EMA + 2 SMA Signals with EMA Crossovers (1-Day Timeframe)Simple Ema or Sma allowing to choose custom intervals

Multi-EMA with Daily EMA OverlayThe Multi-EMA with Daily EMA Overlay shows the 8,13,21,50,200 EMAs on the current timeframe. In addition shows the 50,200 Daily EMAs on every other timeframes.

Multi-EMA with Daily EMA(8,13,21,50,200) OverlayThis indicator shows the 8,13,21,50,200 EMAs on the current timeframe. Furthermore it shows the Daily 8,13,21,50,200 EMAs on every other timeframes.

ATR Volatility BandsATR Volatility Bands is a simple and effective alternative to Bollinger Bands, using the Average True Range (ATR) instead of standard deviation to measure market volatility.
The indicator plots three lines:
A central moving average (SMA or EMA)
An upper band = MA + (ATR × multiplier)
A lower band = MA - (ATR × multiplier)
✅ Features:
Choose between EMA and SMA
Adjustable ATR and MA lengths
Customizable multiplier
🔍 How to use:
Breakouts: Price crossing above/below the bands may indicate strong momentum.
Squeeze Detection: Narrow bands can signal a period of low volatility — potential breakout setup.
Dynamic Support/Resistance: Use bands as zones for pullbacks and targets.
This tool helps traders better adapt to market conditions with volatility-aware levels.
