Smooth BTCSPL [GiudiceQuantico] – Dual Smoothed MAsSmooth BTCSPL – Dual Smoothed MAs
What it measures
• % of Bitcoin addresses in profit vs loss (on-chain tickers).
• Spread = profit % − loss % → quick aggregate-sentiment gauge.
• Optional alpha-decay normalisation ⇒ keeps the curve on a 0-1 scale across cycles.
User inputs
• Use Alpha-Decay Adjusted Input (true/false).
• Fast MA – type (SMA / EMA / WMA / VWMA) & length (default 100).
• Slow MA – type & length (default 200).
• Colours – Bullish (#00ffbb) / Bearish (magenta).
Computation flow
1. Fetch daily on-chain series.
2. Build raw spread.
3. If alpha-decay enabled:
alpha = (rawSpread − 140-week rolling min) / (1 − rolling min).
4. Smooth chosen base with Fast & Slow MAs.
5. Bullish when Fast > Slow, bearish otherwise.
6. Bars tinted with the same bull/bear colour.
How to read
• Fast crosses above Slow → rising “addresses-in-profit” momentum → bullish bias.
• Fast crosses below Slow → stress / capitulation risk.
• Price-indicator divergences can flag exhaustion or hidden accumulation.
Tips
• Keep in a separate pane (overlay = false); bar-colouring still shows on price chart.
• Shorter lengths for swing trades, longer for macro outlook.
• Combine with funding rates, NUPL or simple price-MA crossovers for confirmation.
Indicators and strategies

ZigZag ProZigZag Pro is a precise market structure indicator that automatically detects two independent ZigZag patterns and highlights breakouts whenever significant highs or lows are breached.
The indicator calculates two separate ZigZag structures in real time. ZigZag1 captures the broader market swings and is ideal for trend or swing trading. ZigZag2 is optional and reacts more quickly – perfect for intraday or scalping setups. Both layers are fully customizable in terms of depth, color, and line width.
What makes this tool especially useful: whenever a previous swing high (for long trades) or swing low (for short trades) is broken, the indicator draws a horizontal breakout line on the chart. This makes it easy to spot structural breakouts and take advantage of potential momentum moves.
ZigZag Pro is designed for traders who rely on clean, rule-based market structure — whether you're trading classic breakouts, smart money concepts, or simply want a clearer view of trend shifts. The visuals are minimal, responsive, and suitable for any timeframe.

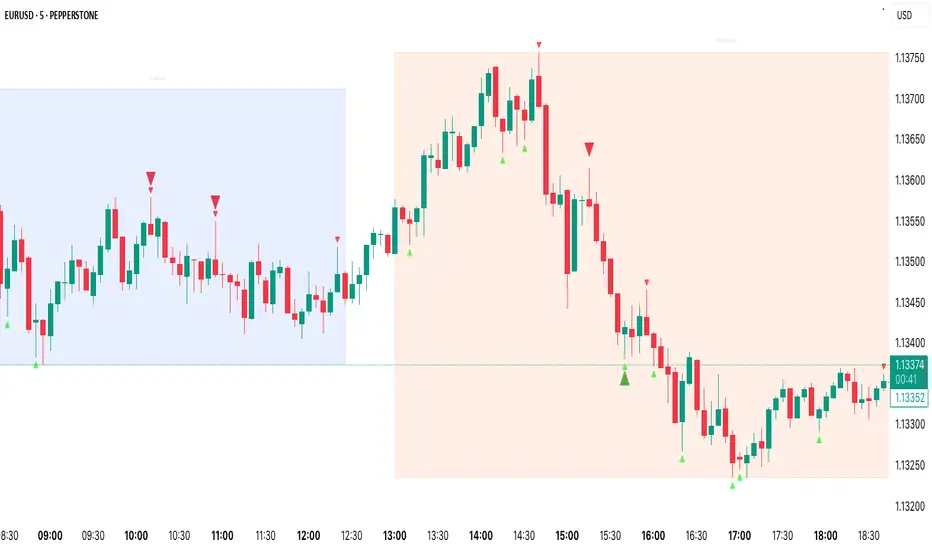
Pin Bar Highlighter OnlyAbsolutely — here’s a full **description and breakdown** of what the script does:
---
## 📜 Script Name:
**"Pin Bar Highlighter Only"**
---
## 🎯 Purpose:
This script **detects and highlights classic pin bar reversal candles** directly on the chart — without plotting any entry, stop loss, or take profit levels.
It’s designed for traders who:
* Want to manually assess trades
* Prefer a clean chart
* Use pin bar price action as a signal for potential reversals
---
## ✅ What It Does:
* **Scans each candle** to check if it qualifies as a **bullish** or **bearish pin bar**
* If valid:
* Plots a **green triangle below** bullish pin bars
* Plots a **red triangle above** bearish pin bars
* Keeps your chart **minimal and uncluttered**
---
## 📌 How It Detects a Pin Bar:
### 🔹 1. Candle Structure:
* Measures the total candle range: `high - low`
* Calculates the **body size**: `abs(close - open)`
* Calculates the **upper and lower wick sizes**
### 🔹 2. Pin Bar Criteria:
* The **wick (nose)** must be at least **2/3 of the total candle length**
* The **body** must be small — **≤ 1/3** of the total range
* The **body** must be located at **one end** of the candle
* The wick must **pierce the high/low** of the previous candle
---
## 📍 Bullish Pin Bar Requirements:
* Close > Open (green candle)
* Lower wick ≥ 66% of candle range
* Body ≤ 33% of range
* Candle **makes a new low** (current low < previous low)
### 📍 Bearish Pin Bar Requirements:
* Close < Open (red candle)
* Upper wick ≥ 66% of candle range
* Body ≤ 33% of range
* Candle **makes a new high** (current high > previous high)
---
## 🖼️ Visual Output:
* 🔻 Red triangle **above** bearish pin bars
* 🔺 Green triangle **below** bullish pin bars
---
## 🛠️ Example Use Cases:
* Identify **reversal points** at support/resistance
* Confirm signals with **VWAP**, supply/demand zones, or AVWAP (manually plotted)
* Use in **conjunction with other strategies** — without clutter
---
Data High/LowMarks out High and Low of a specified candle.
Intended use for news candle's data high and low.
Time, line color, and line length are customizable in settings options.
Lines are only draw on 1m timeframe and lower.

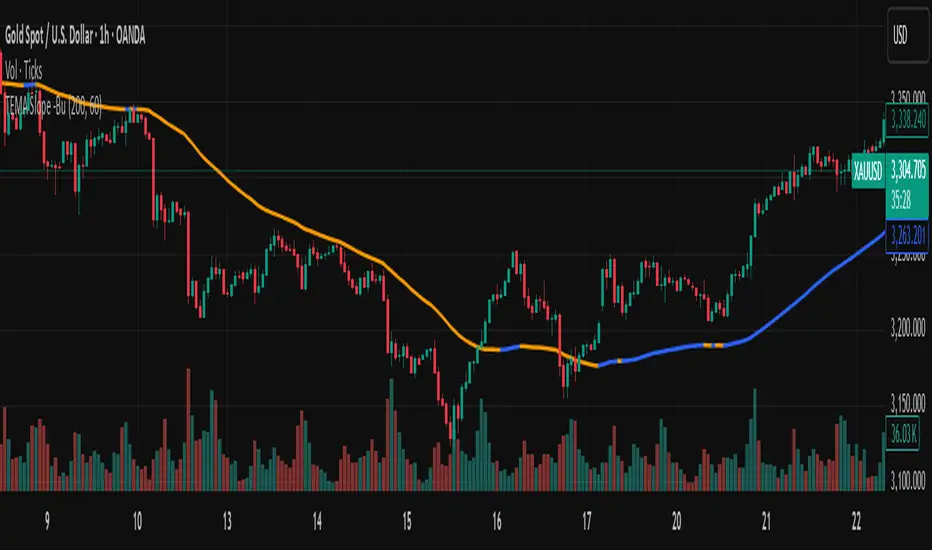
TEMA with Slope Color [MrBuCha]This TEMA indicator is particularly useful for trend following strategies. The key innovation here is using a higher timeframe (default 1-hour) to get a broader perspective on the trend direction, while the color-coding makes it immediately obvious whether the momentum is bullish (blue) or bearish (orange).
The 200-period length makes this more suitable for swing trading rather than day trading, as it filters out short-term noise and focuses on significant trend movements.
//
What is TEMA and How Does It Work?
TEMA (Triple Exponential Moving Average) is a technical indicator that builds upon the standard EMA to reduce lag and provide faster response to price changes. The calculation process is:
EMA1 = EMA of closing price with specified length
EMA2 = EMA of EMA1 with the same length
EMA3 = EMA of EMA2 with the same length
TEMA = 3 × (EMA1 - EMA2) + EMA3
This formula helps reduce the lag inherent in smoothing calculations, making TEMA more responsive to price movements compared to other moving averages.
Default Values
Length: 200 periods
Timeframe: "60" (1 hour)
Slope Colors
Blue: When TEMA is trending upward (tema_current > tema_previous)
Orange: When TEMA is trending downward (tema_current ≤ tema_previous)
Pros and Cons Summary
Advantages:
Fast Response: Reduces lag better than SMA and regular EMA
Easy to Use: Color-coded slope makes trend direction immediately visible
Multi-timeframe Capability: Can display TEMA from higher timeframes
Trend Following: Excellent for identifying trend direction
Visual Clarity: Clear color signals help with quick decision making
Disadvantages:
False Signals: Prone to whipsaws in sideways/choppy markets
Noise in Volatility: Frequent color changes during high volatility periods
Not Suitable for Scalping: Length of 200 is quite long for short-term trading
Still Lagging: Despite improvements, it remains a lagging indicator
Requires Confirmation: Should be used with other indicators for better accuracy
Best Use Cases:
Medium to long-term trend following
Identifying major trend changes
Multi-timeframe analysis
Combine with momentum oscillators for confirmation
Trading Tips:
Wait for color confirmation before entering trades
Use higher timeframe TEMA for overall trend bias
Combine with support/resistance levels
Avoid trading during consolidation periods
Manual Fib Levels (Paul Laurent Trading)📜 Script Description for TradingView
Manual Fibonacci Levels with Whole Number Lines
This script draws infinite horizontal lines for custom Fibonacci retracement and extension levels, based on manually entered high and low points. It also includes additional lines at full whole number levels (e.g., 1.0000, 2.0000, 3.0000), making it easier to visualize key psychological price zones within the Fibonacci range.
Features:
* Custom manual high/low inputs
* Infinite Fib lines (retracement + extension)
* Separate whole-number lines within the Fib range
* Adjustable line color and thickness for both sets
Useful for traders who prefer visual clarity with precise price alignment across major and whole-number levels.

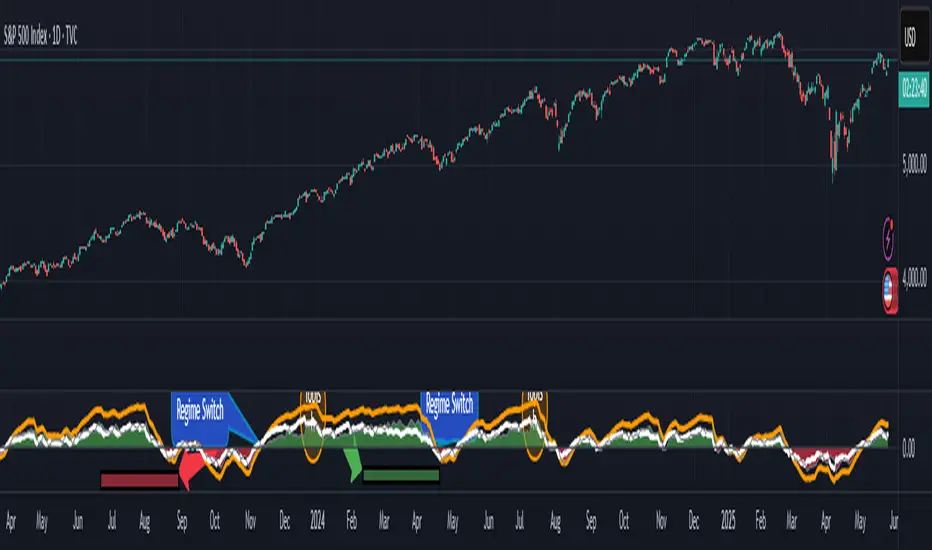
RSI.TrendContext
The Relative Strength Index (RSI) is one of the most widely used classical indicators in technical analysis, typically employed to identify overbought or oversold market conditions. It reflects the degree of upside or downside dominance within a specified period. However, in its standard form, RSI is not particularly effective as a standalone entry trigger.
The RSI.Trend indicator enhances the RSI to provide a more reliable method for distinguishing between bullish and bearish market regimes and offers specific entry triggers. It adds supplementary value to the pure RSI read.________________________________________
Concept
In trending markets, an Exponential Moving Average (EMA) of the price is often smoother and more stable than raw price data. As a result, the RSI calculated on this smoothed price (i.e., the EMA) tends to react earlier and more consistently than the standard RSI. Specifically:
• In uptrends, the RSI of the EMA tends to exceed the RSI of the original price.
• In downtrends, it tends to lag behind.
The difference between these two RSI readings provides a stable and less noisy measure of market bias—positive in uptrends, negative in downtrends. The crossing points can serve as entry triggers. This is, what the RSI.Trend is trying to capture.
________________________________________
The RSI.Trend indicator operates as follows:
• It first computes the 5-period EMA of the price series of the underlying ("EMA5").
• It calculates the 14-period RSI of the original price series ("RSI") as well as the 14-period RSI of EMA5 ("RSIEMA").
• It then determines the 14-period EMA of RSI ("RSI.MA") and RSIEMA ("RSIEMA.MA").
These values are used to define a Baseline and a Trigger Line:
• Baseline: The average of RSI and RSI.MA.
• Trigger Line: The average of RSIEMA and RSIEMA.MA.
Essentially, the baseline represents a smoother version of the RSI of the original price series, while the trigger line is a smoother version of the RSI on the EMA5 of the original price series.
Additionally, the RSI.Trend Background Value is calculated as the difference between the Trigger Line and the Baseline, slightly accelerated by incorporating the current bias of this difference. This acceleration causes the Background Value to react somewhat faster than the pure difference between the two lines.
How to use the RSI.Trend:
• As mentioned in the introductory context, during uptrends, the trigger line remains above the baseline; in downtrends, it stays below the baseline.
• A crossover of the baseline by the trigger line indicates a regime shift from bearish to bullish and can signal avoiding adding short positions, closing short positions, or adding long positions.
• A crossunder of the baseline by the trigger line indicates a regime shift from bullish to bearish and can signal avoiding adding long positions, closing long positions, or adding short positions.
• The level of the Trigger Line can serve as a confidence indicator; for instance, if the trigger line crosses under the baseline coming from very high values, it implies high confidence.
• The Background Value indicates the accelerated difference between the two lines:
o > 0 (Green background): Indicates a Bullish regime.
o < 0 (Red background): Indicates a Bearish regime.
The Background Value reacts slightly faster than line crossings due to its acceleration relative to the difference of the two lines.
Including these lines in the script besides the Background Value, provides insight into their levels and their origins, aiding in formulating confidence in an entry trigger, which the background value alone cannot provide. The change in slope of the trigger Line can also be used as an early and fast position-trigger.
Finally, the Background Value can be utilized in continuous trading scenarios (i.e., no entry points, always engaged) as a multiplier on a predefined max-exposure value, representing the current exposure as a fraction of that max-exposure.
The usage of RSI.Trend is also exemplified in the introductory chart.________________________________________
Final Notes
As with all indicators, the RSI.Trend is most effective when used in conjunction with other technical tools and market context. It does not predict future price movements; rather, it reflects current market dynamics and recent directional tendencies. Use it with discretion and as part of a broader trading strategy.
Enhanced Stock Ticker with 50MA vs 200MADescription
The Enhanced Stock Ticker with 50MA vs 200MA is a versatile Pine Script indicator designed to visualize the relative position of a stock's price within its short-term and long-term price ranges, providing actionable bullish and bearish signals. By calculating normalized indices based on user-defined lookback periods (defaulting to 50 and 200 bars), this indicator helps traders identify potential reversals or trend continuations. It offers the flexibility to plot signals either on the main price chart or in a separate lower pane, leveraging Pine Script v6's force_overlay functionality for seamless integration. The indicator also includes a customizable ticker table, visual fills, and alert conditions for automated trading setups.
Key Features
Dual Lookback Indices: Computes short-term (default: 50 bars) and long-term (default: 200 bars) indices, normalizing the closing price relative to the high/low range over the specified periods.
Flexible Signal Plotting: Users can toggle between plotting crossover signals (triangles) on the main price chart (location.abovebar/belowbar) or in the lower pane (location.top/bottom) using the Plot Signals on Main Chart option.
Crossover Signals: Generates bullish (Golden Cross) and bearish (Death Cross) signals when the short or long index crosses above 5 or below 95, respectively.
Visual Enhancements:
Plots short-term (blue) and long-term (white) indices in a separate pane with customizable lookback periods.
Includes horizontal reference lines at 0, 20, 50, 80, and 100, with green and red fills to highlight overbought/oversold zones.
Dynamic fill between indices (green when short > long, red when long > short) for quick trend visualization.
Displays a ticker and legend table in the top-right corner, showing the symbol and lookback periods.
Alert Conditions: Supports alerts for bullish and bearish crossovers on both short and long indices, enabling integration with TradingView's alert system.
Technical Innovation: Utilizes Pine Script v6's force_overlay parameter to plot signals on the main chart from a non-overlay indicator, combining the benefits of a separate pane and chart-based signals in a single script.
Technical Details
Calculation Logic:
Uses confirmed bars (barstate.isconfirmed) to calculate indices, ensuring reliability by avoiding real-time bar fluctuations.
Short-term index: (close - lowest(low, lookback_short)) / (highest(high, lookback_short) - lowest(low, lookback_short)) * 100
Long-term index: (close - lowest(low, lookback_long)) / (highest(high, lookback_long) - lowest(low, lookback_long)) * 100
Signals are triggered using ta.crossover() and ta.crossunder() for indices crossing 5 (bullish) and 95 (bearish).
Signal Plotting:
Main chart signals use force_overlay=true with location.abovebar/belowbar for precise alignment with price bars.
Lower pane signals use location.top/bottom for visibility within the indicator pane.
Plotting is controlled by boolean conditions (e.g., bullishLong and plot_on_chart) to ensure compliance with Pine Script's global scope requirements.
Performance Considerations: Optimized for efficiency by calculating indices only on confirmed bars and using lightweight plotting functions.
How to Use
Add to Chart:
Copy the script into TradingView's Pine Editor and add it to your chart.
Configure Settings:
Short Lookback Period: Adjust the short-term lookback (default: 50 bars) to match your trading style (e.g., 20 for shorter-term analysis).
Long Lookback Period: Adjust the long-term lookback (default: 200 bars) for broader market context.
Plot Signals on Main Chart: Check this box to display signals on the price chart; uncheck to show signals in the lower pane.
Interpret Signals:
Golden Cross (Bullish): Green (long) or blue (short) triangles indicate the index crossing above 5, suggesting a potential buying opportunity.
Death Cross (Bearish): Red (long) or white (short) triangles indicate the index crossing below 95, signaling a potential selling opportunity.
Set Alerts:
Use TradingView's alert system to create notifications for the four alert conditions: Long Index Valley, Long Index Peak, Short Index Valley, and Short Index Peak.
Customize Visuals:
The ticker table displays the symbol and lookback periods in the top-right corner.
Adjust colors and styles via TradingView's settings if desired.
Example Use Cases
Swing Trading: Use the short-term index (e.g., 50 bars) to identify short-term reversals within a broader trend defined by the long-term index.
Trend Confirmation: Monitor the fill between indices to confirm whether the short-term trend aligns with the long-term trend.
Automated Trading: Leverage alert conditions to integrate with bots or manual trading strategies.
Notes
Testing: Always backtest the indicator on your chosen market and timeframe to validate its effectiveness.
Optional Histogram: The script includes a commented-out histogram for the index difference (index_short - index_long). Uncomment the plot(index_diff, ...) line to enable it.
Compatibility: Built for Pine Script v6 and tested on TradingView as of May 27, 2025.
Acknowledgments
This indicator was inspired by the need for a flexible tool that combines lower-pane analysis with main chart signals, made possible by Pine Script's force_overlay feature. Share your feedback or suggestions in the comments below, and happy trading!

RSI Crossover Signal Companion - Alerts + Visuals🔷 RSI Crossover Signal Companion — Alerts + Visuals
The Relative Strength Index (RSI) is a momentum oscillator that measures the speed and change of recent price movements. It helps traders identify overbought or oversold conditions, possible trend reversals, and momentum strength.
This utility builds on TradingView’s classic Relative Strength Index (RSI) by adding real-time alerts and triangle markers when the RSI crosses its own moving average — a common technique for early momentum detection.
It is designed as a lightweight, visual companion tool for traders using RSI/MA crossover logic in manual or semi-automated strategies.
🔍 Features
✅ Preserves the full original RSI layout, including:
• Gradient fill and overbought/oversold zones
• Standard RSI input settings (length, source, etc.)
• MA smoothing options with user-defined type and length
🔺 Adds visual triangle markers:
🔼 Up triangle when RSI crosses above its MA
🔽 Down triangle when RSI crosses below its MA
📢 Built-in alerts for RSI/MA crosses:
“RSI Crossed Above MA”
“RSI Crossed Below MA”
📈 How to Use
This script is ideal for:
• Spotting early momentum shifts
• Confirming entries or exits in other systems (price action, trendlines, breakouts)
• Building alert-based automation (webhooks, bots, etc.)
Popular use cases:
• Combine with trend indicators like MA200 or MA12
• Use in confluence with price structure and divergence
• Validate breakout moves with momentum confirmation
⚙️ Customization
RSI length, MA length, MA type, and source are fully adjustable
Triangle marker size, shape, and color can be edited under Style
Alerts are pre-built and ready for use

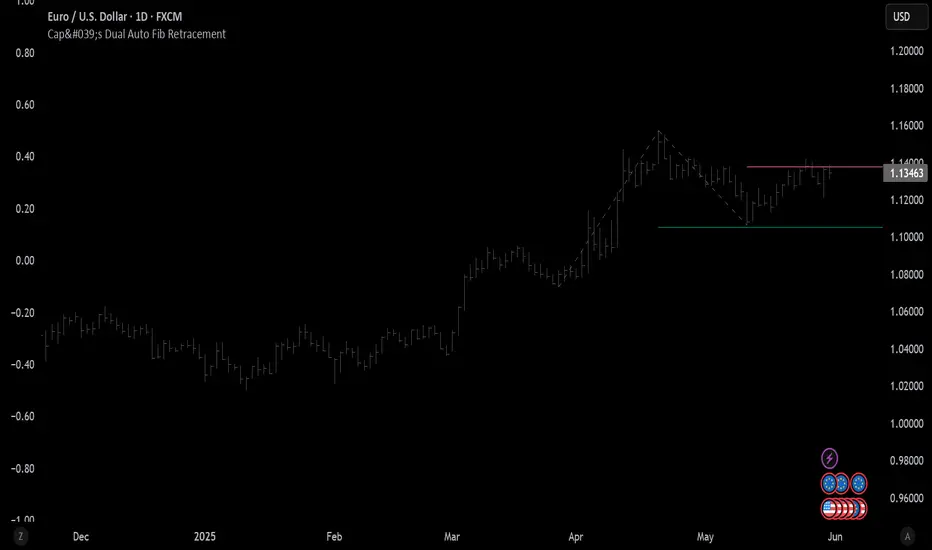
Cap's Dual Auto Fib RetracementThis will draw both a bullish retracement and a bearish retracement. It's defaulted to just show the 0.618 level as I feel like this is the "make or break" level.
- A close below the bullish 0.618 retracement would be considered very bearish.
- A close above the bearish 0.618 would be considered very bullish.
(You can still configure whichever levels you want, however.)
This script was removed by TradingView last time it was published. I couldn't find another script that would provide both bearish/bullish retracements, so I'm assuming this is "original" enough. Maybe it was removed because the description wasn't long enough, so...
Detailed Description:
This indicator automatically plots Fibonacci retracement levels based on zigzag pivot points for both bullish (low-to-high) and bearish (high-to-low) price movements. It identifies key pivot points using a customizable deviation multiplier and depth setting, then draws Fibonacci levels (0, 0.236, 0.382, 0.5, 0.618, 0.786, 1) with user-defined visibility and colors for each level.
Features:
Deviation: Adjusts sensitivity for detecting pivots (default: 2).
Depth: Sets minimum bars for pivot calculation (default: 10).
Extend Lines: Option to extend lines left, right, or both.
Show Prices/Levels: Toggle price and level labels, with options for value or percentage display.
Labels Position: Choose left or right label placement.
Background Transparency: Customize fill transparency between levels.
Alerts: Triggers when price crosses any Fibonacci level.
Usage: Apply to any chart to visualize potential support/resistance zones. Adjust settings to suit your trading style. Requires sufficient data; use lower timeframes or reduce depth if pivots are not detected.
Note: This is a technical analysis tool and does not provide trading signals or financial advice. Always conduct your own research.
SMA50 ATR%SMA50 ATR% Zones Indicator
Overview:
The "SMA50 ATR%" indicator is designed to provide dynamic zones above and below a Simple Moving Average (SMA) based on multiples of the Average True Range (ATR). These zones can help traders identify potential areas of interest for entries, profit-taking, and stop-loss placement by visualizing how far the price has deviated from its medium-term mean (SMA) relative to its recent volatility (ATR).
Key Features:
Central SMA: Plots a customizable Simple Moving Average (default 50-period) as the baseline.
ATR-Based Zones: Calculates and displays distinct zones by adding or subtracting multiples of the ATR (default 10-period) from the SMA.
Color-Coded Visuals: Each zone type is clearly differentiated by color and shading intensity, providing an intuitive visual guide.
Current Zone Label: Displays the specific ATR multiple zone the current price is trading in, offering quick insight into the market's current position relative to the zones.
Zone Breakdown:
The indicator plots the following zones:
Entry Zones (Green Shades):
+1x ATR to +2x ATR above SMA
+2x ATR to +3x ATR above SMA
+3x ATR to +4x ATR above SMA
The green shades become progressively lighter as they move further from the SMA, with the zone closest to the SMA being the darkest green.
Hold Zones (Yellow Shades):
+4x ATR to +5x ATR above SMA (Darker Yellow)
+5x ATR to +6x ATR above SMA (Lighter Yellow)
Sell Zones (Red Shades):
+6x ATR to +7x ATR above SMA
+7x ATR to +8x ATR above SMA
+8x ATR to +9x ATR above SMA
+9x ATR to +10x ATR above SMA
+10x ATR to +11x ATR above SMA
The red shades become progressively darker as they move further from the +6x ATR level, with the +10x to +11x ATR zone being the darkest red.
Stop Loss Zones (Red Shades):
-1x ATR below SMA (Lighter Red)
-1x ATR to -2x ATR below SMA (Darker Red)
How to Use:
Potential Entry Areas: The green "Entry Zones" might indicate areas where the price has pulled back towards the SMA but is still showing strength, or areas where a breakout above the SMA is gaining momentum relative to volatility.
Potential Overbought/Hold Areas: The yellow "Hold Zones" could suggest that the price is becoming extended from its mean, warranting caution or a "hold" approach for existing positions.
Potential Profit-Taking/Sell Areas: The red "Sell Zones" might highlight significantly overbought conditions where the price has moved multiple ATRs above the SMA, potentially signaling areas for profit-taking or considering short entries.
Potential Stop-Loss Areas: The red "Stop Loss Zones" below the SMA can help define areas where a breakdown below the moving average, considering volatility, might invalidate a bullish bias.
Customization:
SMA Length: Adjust the period for the Simple Moving Average (Default: 50).
ATR Length: Adjust the period for the Average True Range calculation (Default: 10).
Show Current Zone Label: Toggle the visibility of the on-screen label that displays the current price's ATR zone.
SMA Line Width: Customize the thickness of the SMA line.
Label Position & Size: Control the placement and text size of the current zone label for optimal chart readability.
Disclaimer:
This indicator is a tool for technical analysis and should not be considered as financial advice. Always use risk management and combine with other analysis methods before making trading decisions.

Ergodic Market Divergence (EMD)Ergodic Market Divergence (EMD)
Bridging Statistical Physics and Market Dynamics Through Ensemble Analysis
The Revolutionary Concept: When Physics Meets Trading
After months of research into ergodic theory—a fundamental principle in statistical mechanics—I've developed a trading system that identifies when markets transition between predictable and unpredictable states. This indicator doesn't just follow price; it analyzes whether current market behavior will persist or revert, giving traders a scientific edge in timing entries and exits.
The Core Innovation: Ergodic Theory Applied to Markets
What Makes Markets Ergodic or Non-Ergodic?
In statistical physics, ergodicity determines whether a system's future resembles its past. Applied to trading:
Ergodic Markets (Mean-Reverting)
- Time averages equal ensemble averages
- Historical patterns repeat reliably
- Price oscillates around equilibrium
- Traditional indicators work well
Non-Ergodic Markets (Trending)
- Path dependency dominates
- History doesn't predict future
- Price creates new equilibrium levels
- Momentum strategies excel
The Mathematical Framework
The Ergodic Score combines three critical divergences:
Ergodic Score = (Price Divergence × Market Stress + Return Divergence × 1000 + Volatility Divergence × 50) / 3
Where:
Price Divergence: How far current price deviates from market consensus
Return Divergence: Momentum differential between instrument and market
Volatility Divergence: Volatility regime misalignment
Market Stress: Adaptive multiplier based on current conditions
The Ensemble Analysis Revolution
Beyond Single-Instrument Analysis
Traditional indicators analyze one chart in isolation. EMD monitors multiple correlated markets simultaneously (SPY, QQQ, IWM, DIA) to detect systemic regime changes. This ensemble approach:
Reveals Hidden Divergences: Individual stocks may diverge from market consensus before major moves
Filters False Signals: Requires broader market confirmation
Identifies Regime Shifts: Detects when entire market structure changes
Provides Context: Shows if moves are isolated or systemic
Dynamic Threshold Adaptation
Unlike fixed-threshold systems, EMD's boundaries evolve with market conditions:
Base Threshold = SMA(Ergodic Score, Lookback × 3)
Adaptive Component = StDev(Ergodic Score, Lookback × 2) × Sensitivity
Final Threshold = Smoothed(Base + Adaptive)
This creates context-aware signals that remain effective across different market environments.
The Confidence Engine: Know Your Signal Quality
Multi-Factor Confidence Scoring
Every signal receives a confidence score based on:
Signal Clarity (0-35%): How decisively the ergodic threshold is crossed
Momentum Strength (0-25%): Rate of ergodic change
Volatility Alignment (0-20%): Whether volatility supports the signal
Market Quality (0-20%): Price convergence and path dependency factors
Real-Time Confidence Updates
The Live Confidence metric continuously updates, showing:
- Current opportunity quality
- Market state clarity
- Historical performance influence
- Signal recency boost
- Visual Intelligence System
Adaptive Ergodic Field Bands
Dynamic bands that expand and contract based on market state:
Primary Color: Ergodic state (mean-reverting)
Danger Color: Non-ergodic state (trending)
Band Width: Expected price movement range
Squeeze Indicators: Volatility compression warnings
Quantum Wave Ribbons
Triple EMA system (8, 21, 55) revealing market flow:
Compressed Ribbons: Consolidation imminent
Expanding Ribbons: Directional move developing
Color Coding: Matches current ergodic state
Phase Transition Signals
Clear entry/exit markers at regime changes:
Bull Signals: Ergodic restoration (mean reversion opportunity)
Bear Signals: Ergodic break (trend following opportunity)
Confidence Labels: Percentage showing signal quality
Visual Intensity: Stronger signals = deeper colors
Professional Dashboard Suite
Main Analytics Panel (Top Right)
Market State Monitor
- Current regime (Ergodic/Non-Ergodic)
- Ergodic score with threshold
- Path dependency strength
- Quantum coherence percentage
Divergence Metrics
- Price divergence with severity
- Volatility regime classification
- Strategy mode recommendation
- Signal strength indicator
Live Intelligence
- Real-time confidence score
- Color-coded risk levels
- Dynamic strategy suggestions
Performance Tracking (Left Panel)
Signal Analytics
- Total historical signals
- Win rate with W/L breakdown
- Current streak tracking
- Closed trade counter
Regime Analysis
- Current market behavior
- Bars since last signal
- Recommended actions
- Average confidence trends
Strategy Command Center (Bottom Right)
Adaptive Recommendations
- Active strategy mode
- Primary approach (mean reversion/momentum)
- Suggested indicators ("weapons")
- Entry/exit methodology
- Risk management guidance
- Comprehensive Input Guide
Core Algorithm Parameters
Analysis Period (10-100 bars)
Scalping (10-15): Ultra-responsive, more signals, higher noise
Day Trading (20-30): Balanced sensitivity and stability
Swing Trading (40-100): Smooth signals, major moves only Default: 20 - optimal for most timeframes
Divergence Threshold (0.5-5.0)
Hair Trigger (0.5-1.0): Catches every wiggle, many false signals
Balanced (1.5-2.5): Good signal-to-noise ratio
Conservative (3.0-5.0): Only extreme divergences Default: 1.5 - best risk/reward balance
Path Memory (20-200 bars)
Short Memory (20-50): Recent behavior focus, quick adaptation
Medium Memory (50-100): Balanced historical context
Long Memory (100-200): Emphasizes established patterns Default: 50 - captures sufficient history without lag
Signal Spacing (5-50 bars)
Aggressive (5-10): Allows rapid-fire signals
Normal (15-25): Prevents clustering, maintains flow
Conservative (30-50): Major setups only Default: 15 - optimal trade frequency
Ensemble Configuration
Select markets for consensus analysis:
SPY: Broad market sentiment
QQQ: Technology leadership
IWM: Small-cap risk appetite
DIA: Blue-chip stability
More instruments = stronger consensus but potentially diluted signals
Visual Customization
Color Themes (6 professional options):
Quantum: Cyan/Pink - Modern trading aesthetic
Matrix: Green/Red - Classic terminal look
Heat: Blue/Red - Temperature metaphor
Neon: Cyan/Magenta - High contrast
Ocean: Turquoise/Coral - Calming palette
Sunset: Red-orange/Teal - Warm gradients
Display Controls:
- Toggle each visual component
- Adjust transparency levels
- Scale dashboard text
- Show/hide confidence scores
- Trading Strategies by Market State
- Ergodic State Strategy (Primary Color Bands)
Market Characteristics
- Price oscillates predictably
- Support/resistance hold
- Volume patterns repeat
- Mean reversion dominates
Optimal Approach
Entry: Fade moves at band extremes
Target: Middle band (equilibrium)
Stop: Just beyond outer bands
Size: Full confidence-based position
Recommended Tools
- RSI for oversold/overbought
- Bollinger Bands for extremes
- Volume profile for levels
- Non-Ergodic State Strategy (Danger Color Bands)
Market Characteristics
- Price trends persistently
- Levels break decisively
- Volume confirms direction
- Momentum accelerates
Optimal Approach
Entry: Breakout from bands
Target: Trail with expanding bands
Stop: Inside opposite band
Size: Scale in with trend
Recommended Tools
- Moving average alignment
- ADX for trend strength
- MACD for momentum
- Advanced Features Explained
Quantum Coherence Metric
Measures phase alignment between individual and ensemble behavior:
80-100%: Perfect sync - strong mean reversion setup
50-80%: Moderate alignment - mixed signals
0-50%: Decoherence - trending behavior likely
Path Dependency Analysis
Quantifies how much history influences current price:
Low (<30%): Technical patterns reliable
Medium (30-50%): Mixed influences
High (>50%): Fundamental shift occurring
Volatility Regime Classification
Contextualizes current volatility:
Normal: Standard strategies apply
Elevated: Widen stops, reduce size
Extreme: Defensive mode required
Signal Strength Indicator
Real-time opportunity quality:
- Distance from threshold
- Momentum acceleration
- Cross-validation factors
Risk Management Framework
Position Sizing by Confidence
90%+ confidence = 100% position size
70-90% confidence = 75% position size
50-70% confidence = 50% position size
<50% confidence = 25% or skip
Dynamic Stop Placement
Ergodic State: ATR × 1.0 from entry
Non-Ergodic State: ATR × 2.0 from entry
Volatility Adjustment: Multiply by current regime
Multi-Timeframe Alignment
- Check higher timeframe regime
- Confirm ensemble consensus
- Verify volume participation
- Align with major levels
What Makes EMD Unique
Original Contributions
First Ergodic Theory Trading Application: Transforms abstract physics into practical signals
Ensemble Market Analysis: Revolutionary multi-market divergence system
Adaptive Confidence Engine: Institutional-grade signal quality metrics
Quantum Coherence: Novel market alignment measurement
Smart Signal Management: Prevents clustering while maintaining responsiveness
Technical Innovations
Dynamic Threshold Adaptation: Self-adjusting sensitivity
Path Memory Integration: Historical dependency weighting
Stress-Adjusted Scoring: Market condition normalization
Real-Time Performance Tracking: Built-in strategy analytics
Optimization Guidelines
By Timeframe
Scalping (1-5 min)
Period: 10-15
Threshold: 0.5-1.0
Memory: 20-30
Spacing: 5-10
Day Trading (5-60 min)
Period: 20-30
Threshold: 1.5-2.5
Memory: 40-60
Spacing: 15-20
Swing Trading (1H-1D)
Period: 40-60
Threshold: 2.0-3.0
Memory: 80-120
Spacing: 25-35
Position Trading (1D-1W)
Period: 60-100
Threshold: 3.0-5.0
Memory: 100-200
Spacing: 40-50
By Market Condition
Trending Markets
- Increase threshold
- Extend memory
- Focus on breaks
Ranging Markets
- Decrease threshold
- Shorten memory
- Focus on restores
Volatile Markets
- Increase spacing
- Raise confidence requirement
- Reduce position size
- Integration with Other Analysis
- Complementary Indicators
For Ergodic States
- RSI divergences
- Bollinger Band squeezes
- Volume profile nodes
- Support/resistance levels
For Non-Ergodic States
- Moving average ribbons
- Trend strength indicators
- Momentum oscillators
- Breakout patterns
- Fundamental Alignment
- Check economic calendar
- Monitor sector rotation
- Consider market themes
- Evaluate risk sentiment
Troubleshooting Guide
Too Many Signals:
- Increase threshold
- Extend signal spacing
- Raise confidence minimum
Missing Opportunities
- Decrease threshold
- Reduce signal spacing
- Check ensemble settings
Poor Win Rate
- Verify timeframe alignment
- Confirm volume participation
- Review risk management
Disclaimer
This indicator is for educational and informational purposes only. It does not constitute financial advice. Trading involves substantial risk of loss and is not suitable for all investors. Past performance does not guarantee future results.
The ergodic framework provides unique market insights but cannot predict future price movements with certainty. Always use proper risk management, conduct your own analysis, and never risk more than you can afford to lose.
This tool should complement, not replace, comprehensive trading strategies and sound judgment. Markets remain inherently unpredictable despite advanced analysis techniques.
Transform market chaos into trading clarity with Ergodic Market Divergence.
Created with passion for the TradingView community
Trade with insight. Trade with anticipation.
— Dskyz , for DAFE Trading Systems

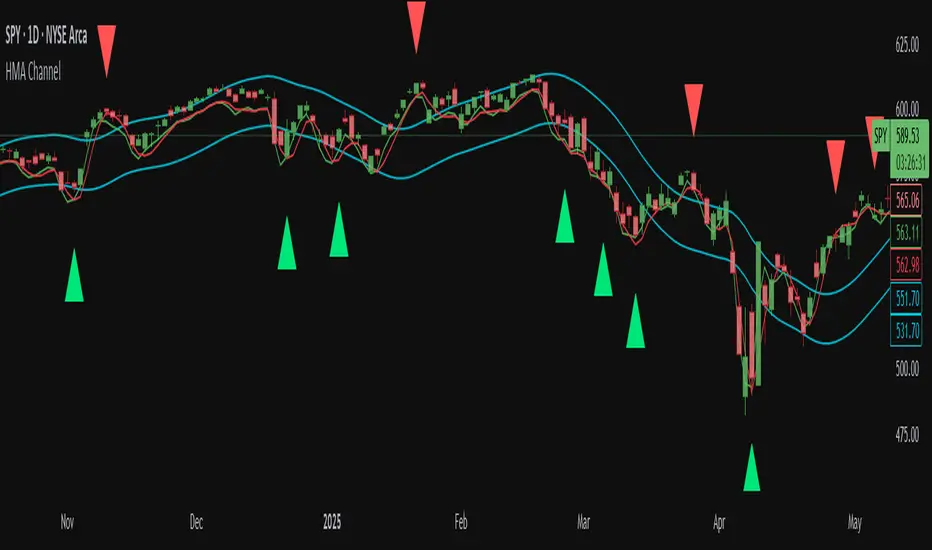
Hull MA Channel with Filtered CrossoversI've created an indicator that let's you create a HMA channel with 2 displaced HMA (A/B). As well as a HMA crossover set (C/D).
Here's how it works:
The HMA crossovers from C and D will not signal unless they are outside of the channel of A and B. As a matter of fact, NO buy signal whatsoever will occur above the channel and NO sell signal will occur below the channel.
The crossover HMA pair (C/D) can have their lengths adjusted to the 0.00 decimal point for VERY fine tuning of the crossovers.
(edit-it doesn't fine tune to the .00. This must not be a feature that is able to be utilized. I tried) The length adjustment still works to the nearest whole number. The .00 are mute :(
In keeping with that same logic, you can adjust the displacement of the channel independently to the 0.00 decimal, again for VERY fine tuning.
This is great for reversals while eliminating noise from false signals, keeping the chart nice and clean. Should be used in combination with other indicators for the best confirmations.
Multi-Timeframe Opening Dots with PlotcharPlot clean, smart dots that mark where the real action starts — the opening levels of the three higher timeframes above your current chart.
How it works:
Automatically grabs the next 3 higher timeframes.
Drops a slick dot right at each opening price — but only while that bar is still active.
Color-coded at a glance: Price above open? → green dot. Price below open? → red dot.
Why it’s useful: Get instant visual cues on higher timeframe opens — powerful markers for support, resistance, and directional bias.
Perfect for intraday traders and swing strategists who want to stay synced with the big picture.

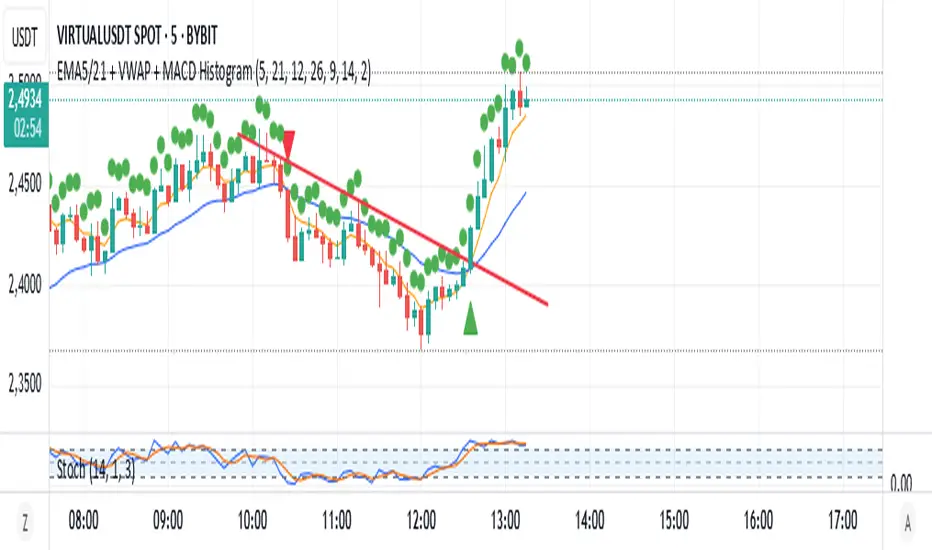
EMA5/21 + VWAP + MACD HistogramScript Summary: EMA + VWAP + MACD + RSI Strategy
Objective: Combine multiple technical indicators to identify market entry and exit opportunities, aiming to increase signal accuracy.
Indicators Used:
EMAs (Exponential Moving Averages): Periods of 5 (short-term) and 21 (long-term) to identify trend crossovers.
VWAP (Volume Weighted Average Price): Serves as a reference to determine if the price is in a fair value zone.
MACD (Moving Average Convergence Divergence): Standard settings of 12, 26, and 9 to detect momentum changes.
RSI (Relative Strength Index): Period of 14 to identify overbought or oversold conditions.
Entry Rules:
Buy (Long): 5-period EMA crosses above the 21-period EMA, price is above VWAP, MACD crosses above the signal line, and RSI is above 40.
Sell (Short): 5-period EMA crosses below the 21-period EMA, price is below VWAP, MACD crosses below the signal line, and RSI is below 60.
Exit Rules:
For long positions: When the 5-period EMA crosses below the 21-period EMA or MACD crosses below the signal line.
For short positions: When the 5-period EMA crosses above the 21-period EMA or MACD crosses above the signal line.
Visual Alerts:
Buy and sell signals are highlighted on the chart with green (buy) and red (sell) arrows below or above the corresponding candles.
Indicator Plotting:
The 5 and 21-period EMAs, as well as the VWAP, are plotted on the chart to facilitate the visualization of market conditions.
This script is a versatile tool for traders seeking to combine multiple technical indicators into a single strategy. It can be used across various timeframes and assets, allowing adjustments according to the trader's profile and market characteristics.
Juliano Einhardt Ulguim, Brazil, 05/27/2025.
Auto AI Trendlines [TradingFinder] Clustering & Filtering Trends🔵 Introduction
Auto AI trendlines Clustering & Filtering Trends Indicator, draws a variety of trendlines. This auto plotting trendline indicator plots precise trendlines and regression lines, capturing trend dynamics.
Trendline trading is the strongest strategy in the financial market.
Regression lines, unlike trendlines, use statistical fitting to smooth price data, revealing trend slopes. Trendlines connect confirmed pivots, ensuring structural accuracy. Regression lines adapt dynamically.
The indicator’s ascending trendlines mark bullish pivots, while descending ones signal bearish trends. Regression lines extend in steps, reflecting momentum shifts. As the trend is your friend, this tool aligns traders with market flow.
Pivot-based trendlines remain fixed once confirmed, offering reliable support and resistance zones. Regression lines, adjusting to price changes, highlight short-term trend paths. Both are vital for traders across asset classes.
🔵 How to Use
There are four line types that are seen in the image below; Precise uptrend (green) and downtrend (red) lines connect exact price extremes, while Pivot-based uptrend and downtrend lines use significant swing points, both remaining static once formed.
🟣 Precise Trendlines
Trendlines only form after pivot points are confirmed, ensuring reliability. This reduces false signals in choppy markets. Regression lines complement with real-time updates.
The indicator always draws two precise trendlines on confirmed pivot points, one ascending and one descending. These are colored distinctly to mark bullish and bearish trends. They remain fixed, serving as structural anchors.
🟣 Dynamic Regression Lines
Regression lines, adjusting dynamically with price, reflect the latest trend slope for real-time analysis. Use these to identify trend direction and potential reversals.
Regression lines, updated dynamically, reflect real-time price trends and extend in steps. Ascending lines are green, descending ones orange, with shades differing from trendlines. This aids visual distinction.
🟣 Bearish Chart
A Bullish State emerges when uptrend lines outweigh or match downtrend lines, with recent upward momentum signaling a potential rise. Check the trend count in the state table to confirm, using it to plan long positions.
🟣 Bullish Chart
A Bearish State is indicated when downtrend lines dominate or equal uptrend lines, with recent downward moves suggesting a potential drop. Review the state table’s trend count to verify, guiding short position entries. The indicator reflects this shift for strategic planning.
🟣 Alarm
Set alerts for state changes to stay informed of Bullish or Bearish shifts without constant monitoring. For example, a transition to Bullish State may signal a buying opportunity. Toggle alerts On or Off in the settings.
🟣 Market Status
A table summarizes the chart’s status, showing counts of ascending and descending lines. This real-time overview simplifies trend monitoring. Check it to assess market bias instantly.
Monitor the table to track line counts and trend dominance.
A higher count of ascending lines suggests bullish bias. This helps traders align with the prevailing trend.
🔵 Settings
Number of Trendlines : Sets total lines (max 10, min 3), balancing chart clarity and trend coverage.
Max Look Back : Defines historical bars (min 50) for pivot detection, ensuring robust trendlines.
Pivot Range : Sets pivot sensitivity (min 2), adjusting trendline precision to market volatility.
Show Table Checkbox : Toggles display of a table showing ascending/descending line counts.
Alarm : Enable or Disable the alert.
🔵 Conclusion
The multi slopes indicator, blending pivot-based trendlines and dynamic regression lines, maps market trends with precision. Its dual approach captures both structural and short-term momentum.
Customizable settings, like trendline count and pivot range, adapt to diverse trading styles. The real-time table simplifies trend monitoring, enhancing efficiency. It suits forex, stocks, and crypto markets.
While trendlines anchor long-term trends, regression lines track intraday shifts, offering versatility. Contextual analysis, like price action, boosts signal reliability. This indicator empowers data-driven trading decisions.

Auto FaustAuto Faust – Intraday Market Context & Structure
Auto Faust is a visual market overlay designed for intraday traders who want fast context without relying on signals or automation. It combines classic price tools — VWAP, EMAs, RSI, Chop Score, and market structure trendlines — into a single glanceable dashboard.
🔍 What It Does:
VWAP (Volume Weighted Average Price): Shows the day's fair value price anchor.
EMAs (3, 21, 113, 200): Map short-term to long-term trend alignment. Crossovers can be used for confluence or caution.
RSI (10): Monitors local momentum. Displayed in a compact table.
Chop Score: Measures how directional price action is. High chop = ranging conditions; low = trending.
Session High/Low Tracker: Tracks the daily extremes in real-time.
Volume Monitor: Shows current candle volume, color-coded vs previous bar (green = higher, red = lower).
Dynamic Support & Resistance Lines: Plotted from pivot highs/lows (not static levels).
Automatic Trendlines: Drawn from swing structure, updating live.
📊 How to Use:
Use EMAs + VWAP alignment to assess directional bias.
Confirm clean trends with low Chop Score and RSI support.
Watch for price interaction around dynamic S/R lines and trendline breaks.
Use volume coloring to assess if momentum is increasing or fading.
No buy/sell signals are generated — this is a trader-facing tool to guide discretionary decision-making.

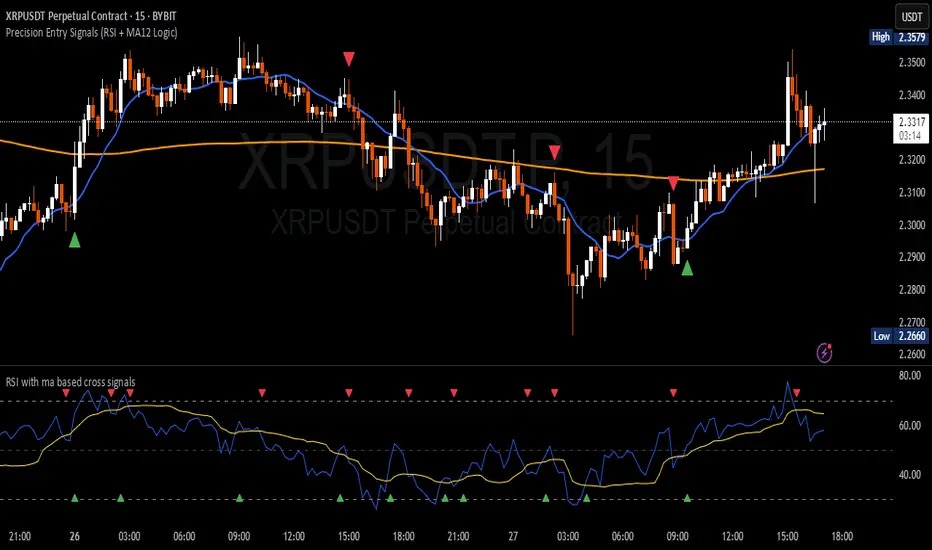
Precision Entry Signals (RSI + MA12 Logic)Description:
This script provides precise entry signals based on a clean confluence of MA12 breakouts and RSI momentum, filtered by a VWMA (Volume-Weighted Moving Average) of the RSI.
-----------------------------------------------------------------------------------------------------------------
🔹 Long entry conditions:
- Candle opens below the 12-period MA and closes above it
- RSI crosses above its VWMA
- Previous candle is bearish (additional confirmation)
🔹 Short entry conditions:
- Candle opens above the 12-period MA and closes below it
- RSI crosses below its VWMA
- Previous candle is bullish
----------------------------------------------------------------------------------------------------------------
Once a signal is confirmed, the script automatically draws:
Entry line (at close price)
Stop Loss line (just below recent lows for long, or above highs for short)
Take Profit 1 (1R)
Take Profit 2 (2R)
Labels are attached to the lines for clarity: ENTRY, SL, TP1, and TP2.
⚠️ Note: This tool only provides entry signals and visual risk/reward guidance. It does not manage exits dynamically. Manual trade management is recommended.
This script is intended for active intraday traders, especially on lower timeframes like 3-minute, 5-minute or 15-minute charts.
---------------------------------------------------------------------------------------------------------------
🔧 Recommended companion indicator:
For better confirmation and visual tracking of the RSI/VWMA cross logic, it is strongly recommended to also use the companion script:
🔹 Relative Strength Index (with MA based cross signals)
→ Shows RSI and its moving average visually, with triangle plots on every valid cross.
→ Matches exactly the RSI/VWMA behavior used in this entry signal script.
📌 Important:
After adding the RSI script to your chart, make sure to set:
RSI Length = 14
MA Type = VWMA
MA Length = 20
This ensures it visually matches the logic used by the entry signal script.
Both indicators are fully open source and meant to be used together — especially when trading manually.
MTF Candle Direction Forecast + Breakdown🧭 MTF Candle Direction Forecast + Breakdown 🔥📈🔼
This script is a multi-timeframe (MTF) price action dashboard that helps traders assess real-time directional bias across five customizable timeframes — with a focus on candle behavior, trend alignment, and confidence strength.
📌 What It Does
For each timeframe, this dashboard summarizes:
Current direction → Bullish, Bearish, or Neutral
Confidence score (0–100) → How strongly price is likely to continue in that direction
Candle strength → 🔥 icon appears if the current candle has a large body relative to its range
Trend alignment:
📈 = EMA9 is above EMA20
🔼 = Price is above VWAP
Color-coded background to visually reinforce directional state
Each row gives you a visual “at-a-glance” readout of what price is doing right now — not in the past.
💡 Why It’s Useful
✅ Direction forecasting based on price action
Instead of lagging indicators, this script prioritizes:
Candle body-to-range ratio (momentum)
Real-time VWAP/EMA structure
Immediate price positioning
✅ Confidence is quantified
The score (0–100) helps you judge how reliable each directional signal is:
90+ → Strong conviction
50–70 → Mixed but potentially valid
<40 → Weak move or early signal
✅ Timeframe confluence at a glance
See whether multiple timeframes are aligning directionally — helpful for scalping, day trading, or waiting for multi-timeframe breakout setups.
✅ Visual & intuitive
Icons, colors, and layout make it easy to scan your dashboard instead of deciphering charts or code.
🛠️ Adjustable Settings
Setting Description
Timeframe 1–5 Choose any timeframes to monitor (e.g., 5m, 15m, 1h, 4h)
Candle Display Mode Show trend color via emoji (🟢/🔴) or background shading
Strong Candle Threshold Adjust the body-to-range % needed to trigger 🔥 strength
Bullish/Bearish Background Customize label color coding
Neutral Background (opacity) Set transparency or styling for flat/consolidating zones
Table Location Place the dashboard anywhere on the chart
🎯 Use Cases
Scalpers: Confirm trend across 1m/5m/15m before entering
Day Traders: Use confidence score to avoid low-momentum setups
Swing Traders: Monitor higher timeframes for trend shifts while tracking intraday noise
VWAP/EMA traders: Quickly see when price is reclaiming or losing critical trend levels
🧠 What Makes It Unique?
Unlike generic trend meters or mashups of standard indicators, this script:
Uses live candle dynamics (not just closes or lagging values)
Computes directional bias and confidence together
Visualizes strength and structure in a compact, readable interface
Let’s you filter by price action, not just indicator alignment
💥 Why Traders Love Will Love It
✅ Instant clarity on which timeframes agree
✅ No more guessing candle strength or trend health
✅ Confidence score keeps you out of weak trades
✅ Works with any strategy — trend following, VWAP reclaim, EMA scalps, even breakouts
✅ Keeps your chart clean — all the context, none of the clutter
⚠️ Transparency🧬 Under the Hood
Powered by live candle body analysis, trend structure (EMA9 vs EMA20), and VWAP placement.
All scores are generated in real-time — No repainting or lookahead bias: all values are computed with lookahead=barmerge.lookahead_on
Confidence scores reflect the current candle only — they do not predict future moves but measure momentum and alignment in real-time
Labels update per bar and respond to subtle shifts in candle structure and trend indicators
✅ MTF Trend Snapshot (Live Output Example Shown in Chart Above)
This dashboard gives you a fast, visual summary of market trend and momentum across 5 timeframes. Here's what it's telling you right now:
🕔 5 Minute (5m)
📉 EMA Trend: Down
🔼 Price: Above VWAP
Direction: Bearish (42)
🟥 Weak bearish bias. Short-term pullback against a stronger trend. Use caution — lower confidence and mixed structure.
⏱️ 15 Minute (15m)
📈 EMA Trend: Up
🔼 Price: Above VWAP
Direction: Bullish (73)
🟩 Clean bullish structure with growing momentum. Solid for intraday confirmation.
🕧 30 Minute (30m)
📈 EMA Trend: Up
🔼 Price: Above VWAP
Direction: Bullish (77)
🟩 Stronger trend forming. Above VWAP and EMAs — building conviction.
🕐 1 Hour (1h)
📈 EMA Trend: Up
🔼 Price: Above VWAP
Direction: Bullish (70)
🟩 Confident, clean trend. Good alignment across indicators. Ideal timeframe for swing entries.
🕓 4 Hour (4h)
🔥 Strong Candle
📈 EMA Trend: Up
🔼 Price: Above VWAP
Direction: Bullish (100)
🟩 Full trend alignment with max momentum. Strong body candle + structure — high confidence continuation.
🧠 Quick Takeaway
🔻 5m is pulling back short term
✅ 15m through 4h are fully aligned Bullish
🔥 4h has max confidence — big-picture trend is intact
📈 Ideal setup for momentum traders looking to ride trend with multi-timeframe confirmation
Try pinning this dashboard to your chart during live trading to read price like a story across timeframes, and filter out weak setups with low-confidence noise.

Liquidity LinesLiquidity Lines Indicator
This advanced TradingView indicator identifies key liquidity zones on your price chart by detecting bullish and bearish engulfing candles, which often signify areas where liquidity accumulates. It helps traders visually spot potential support and resistance levels created by market participants’ stop-loss orders or pending orders.
Key Features :
-Aggregated Bars Option : Smooth out price data by grouping bars together, enabling clearer liquidity zone identification on higher timeframes or noisy charts.
-Upper Liquidity Lines : Displays dashed lines at recent highs where bearish engulfing patterns indicate potential resistance or supply zones.
-Lower Liquidity Lines : Displays dashed lines at recent lows where bullish engulfing patterns suggest potential support or demand zones.
-Customizable Colors : Choose your preferred colors for bullish (default black) and bearish (default white) liquidity lines for better visual distinction.
-Automatic Line Cleanup : Maintains chart clarity by automatically removing old liquidity lines after a configurable limit.
-Dynamic Alerts : Trigger alerts when price breaches upper or lower liquidity lines, signaling potential breakout or reversal opportunities.
Use Cases :

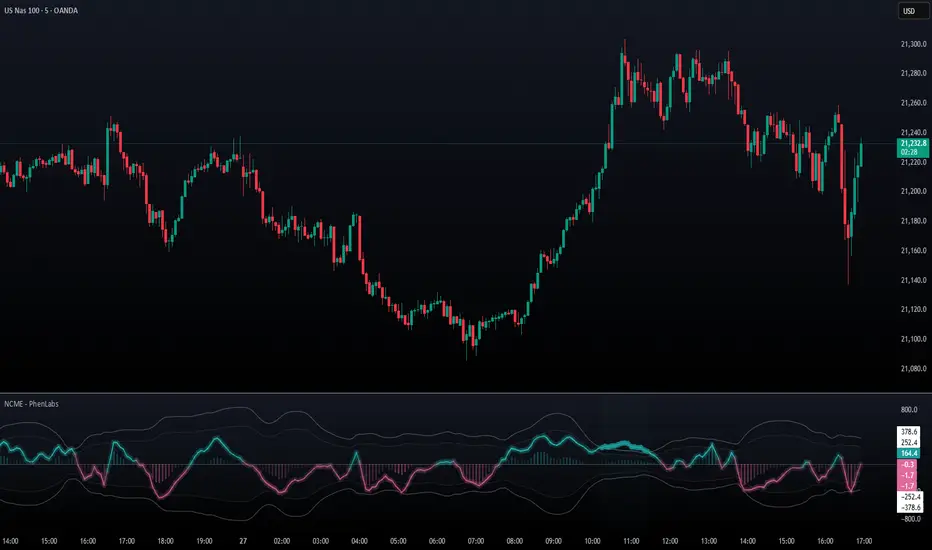
Navier-Cauchy Market Elasticity [PhenLabs]📊 Navier-Cauchy Market Elasticity
Version: PineScript™ v6
📌 Description
The Navier-Cauchy Market Elasticity (NCME) indicator takes a new step into technical analysis by applying materials science principles to financial markets. Similar to last weeks release utilizing Navier-Stokes dynamics equation this indicator focuses on the elastic interaction of virtual “solids”. Based on elasticity theory used in engineering, NCME treats price movements as material deformations, calculating market stress and strain using proven physics formulas. This unique approach reveals hidden market dynamics invisible to traditional indicators.
By implementing Lamé parameters and Young’s modulus calculations, NCME identifies critical stress points where markets exhibit extreme tension or compression. These zones often precede significant price movements, providing traders with advanced warning of potential reversals or breakouts.
🚀 Points of Innovation
• First indicator to apply Navier-Cauchy elasticity equations to market analysis
• Dynamic stress tensor calculations adapted for one-dimensional price movements
• Real-time Poisson ratio adjustments for market-specific elasticity modeling
• Gradient-based coloring system that visualizes stress intensity variations
• Advanced display modes with customizable visual layers for professional analysis
• Physics-based volatility normalization using Young’s modulus principles
🔧 Core Components
• Elasticity Engine: Calculates market elasticity using volatility-adjusted Young’s modulus
• Stress Tensor System: Computes normal stress values using Lamé parameters (λ and μ)
• Strain Measurement: Tracks price displacement relative to historical movement patterns
• Dynamic Bands: Statistical deviation bands that adapt to market elasticity changes
🔥 Key Features
• Four Display Modes: Choose between Histogram, Line, Both, or Advanced visualization
• Five Color Schemes: Modern, Classic, Neon, Ocean, and Fire themes with gradient support
• Background Stress Zones: Five distinct zones showing market stress levels visually
• Customizable Smoothing: Adjustable period for noise reduction without signal lag
• Extreme Value Detection: Automatic marking of critical stress points with visual alerts
• Advanced Mode Options: Glow effects, momentum ribbon, and extreme dots toggles
🎨 Visualization
• Stress Line: Primary indicator showing real-time market stress with gradient coloring
• Histogram Bars: Normalized stress values with dynamic opacity based on magnitude
• Reference Bands: Primary and secondary deviation bands for context
• Background Zones: Color-coded regions indicating stress intensity levels
• Signal Dots: Markers appearing at extreme stress points for easy identification
📖 Usage Guidelines
Display Settings
• Display Style
○ Default: Advanced
○ Options: Histogram, Line, Both, Advanced
○ Description: Controls visual presentation mode. Advanced offers the most comprehensive view with multiple layers
• Smoothing Period
○ Default: 3
○ Range: 1-50
○ Description: Moving average periods for noise reduction. Higher values create smoother signals but may introduce lag
Elasticity Parameters
• Displacement Length
○ Default: 14
○ Range: 1-100
○ Description: Lookback period for strain calculation. Shorter periods detect rapid stress changes
• Elasticity Length
○ Default: 30
○ Range: 1-200
○ Description: Period for volatility-based elasticity calculation. Longer periods provide more stable readings
• Poisson Ratio
○ Default: 0.3
○ Range: 0-0.5
○ Description: Theoretical elasticity ratio. 0.3 works well for most markets; adjust for specific asset classes
✅ Best Use Cases
• Identifying market tension before major breakouts
• Detecting compression zones during accumulation phases
• Confirming trend strength through stress persistence
• Timing reversals at extreme stress levels
• Multi-timeframe stress analysis for comprehensive market view
⚠️ Limitations
• Requires sufficient price history for accurate elasticity calculations
• May produce false signals during unprecedented market events
• Works best in liquid markets with consistent volume
• Not suitable as a standalone trading system
💡 What Makes This Unique
• Physics-Based Foundation: First indicator to properly implement elasticity theory
• Academic Rigor: Based on proven Navier-Cauchy equations from materials science
• Visual Innovation: Multiple display modes with professional-grade aesthetics
• Adaptive Technology: Self-adjusting parameters based on market conditions
🔬 How It Works
1. Strain Calculation:
• Measures price displacement over specified period
• Normalizes displacement relative to price level
2. Elasticity Determination:
• Calculates Young’s modulus using inverse volatility
• Updates Lamé parameters based on Poisson ratio
3. Stress Computation:
• Applies elasticity theory formula: σ = (λ + 2μ) × ε
• Scales result for visual clarity
• Applies smoothing to reduce noise
💡 Note: NCME represents a breakthrough in applying physics principles to market analysis. While based on proven scientific formulas, remember that markets are complex systems influenced by human psychology and external factors. Use NCME as part of a comprehensive trading strategy with proper risk management.
Algo Structure [ValiantTrader_]Explanation of the "Algo Structure" Trading Indicator
This Pine Script indicator, created by ValiantTrader_, is a multi-timeframe swing analysis tool that helps traders identify key price levels and market structure across different timeframes. Here's how it works and how traders can use it:
Core Components
1. Multi-Timeframe Swing Analysis
The indicator tracks swing highs and lows across:
The current chart timeframe
A higher timeframe (weekly by default)
An even higher timeframe (monthly by default)
2. Swing Detection Logic
Current timeframe swings: Identified when price makes a 3-bar high/low pattern
Higher timeframe swings: Uses the highest high/lowest low of the last 3 bars on those timeframes
3. Visual Elements
Horizontal lines marking swing points
Labels showing the timeframe and percentage distance from current price
An information table summarizing key levels
How Traders Use This Indicator
1. Identifying Key Levels
The indicator draws recent swing highs (red) and swing lows (green)
These levels act as potential support/resistance areas
Traders watch for price reactions at these levels
2. Multi-Timeframe Analysis
By seeing swings from higher timeframes (weekly, monthly), traders can:
Identify more significant support/resistance zones
Understand the broader market context
Spot confluence areas where multiple timeframes align
3. Measuring Price Distance
The percentage display shows how far current price is from each swing level
Helps assess potential reward/risk at current levels
Shows volatility between swings (wider % = more volatile moves)
4. Table Summary
The info table provides a quick reference for:
Exact price levels of swings
Percentage ranges between highs and lows
Comparison across timeframes
5. Trading Applications
Breakout trading: When price moves beyond a swing high/low
Mean reversion: Trading bounces between swing levels
Trend confirmation: Higher highs/lows in multiple timeframes confirm trends
Support/resistance trading: Entering trades at swing levels with other confirmation
Customization Options
Traders can adjust:
The higher timeframes analyzed
Whether to show the timeframe labels
Whether to display swing levels
Whether to show the info table
The indicator also includes price alerts for new swing highs/lows on the current timeframe, allowing traders to get notifications when market structure changes.
This tool is particularly valuable for traders who incorporate multi-timeframe analysis into their strategy, helping them visualize important price levels across different time perspectives

Moving Average Deviation Rate with MA TypeJapanese below / 日本語説明は下記
This indicator displays moving average deviation rate with the ability to select moving average type with signals and alerts.
Price and moving average have the characteristics that when the price moves away from the moving average, it moves back to the moving average.
Example:
In the chart below, when the deviation rate increases to 2%(green circle), price momentum gradually decreases and it moves back to the moving average.
Taking advantage of this characteristic, traders can make decisions to take profit and/or take contrarian trades.
Signals can be displayed either on main chart or sub chart when the deviation rate crosses over/under upper/lower band.
Alert can be set with the same condition as the signals.
----------------------
移動平均線乖離率を表示することのできるインジケーターです。
移動平均線タイプを選択できる他、乖離率とアッパーバンド/ロワーバンドとのクロスでシグナルを表示することができます。
価格と移動平均線には、価格が移動平均線から乖離すると、再び移動平均線まで戻ってくるという特徴があります。
この特徴を利用することで、トレーダーは利益確定のタイミングや逆張りでポジションを取るタイミングを図ることができます。
例
以下のチャートでは乖離率が2%付近(黄緑の丸)まで上昇すると、価格の上昇の勢いが衰えて再び移動平均線まで戻っていることが確認できます。
乖離率とアッパーバンド/ロワーバンドがクロスした時に、メインチャートまたはサブチャートのいずれかにシグナルを表示することが可能です。
また、同じ条件でアラートを設定することもできます。
